The external costs of pasture weed spread: an economic assessment of
serrated tussock control
R.E. Jones
∗, D.T. Vere, M.H. Campbell
Co-operative Research Centre for Weed Management Systems and NSW Agriculture, Orange Agricultural Institute, Forest Road, Orange, New South Wales 2800, Australia
Received 1 February 1999; received in revised form 16 August 1999; accepted 8 September 1999
Abstract
The external cost associated with the spread of pasture weeds such as serrated tussock (Nassella trichotoma) is an important economic problem. This problem is complicated in many parts of south-eastern Australia where low rainfall and low soil fertility prevent the economic viability of control of this weed through pasture improvement. A consequence of serrated tussock spread in this region has been calls for increased public intervention in its control. However, because there have been no attempts to measure the external costs of serrated tussock spread, one of the major economic grounds on which this activity might be justified has not been quantified. The purpose of this paper is to provide this information. A stochastic simulation model is developed to determine the size of the external cost associated with the spread of serrated tussock and to evaluate the economic benefits of a range of control scenarios. It is concluded that on low rainfall-low soil fertility country the socially optimal control option for serrated tussock is to retire land from agriculture and re-vegetate it with trees. ©2000 Elsevier Science B.V. All rights reserved.
Keywords: External costs; Weed spread; Stochastic simulation; Australia
1. Introduction
One of the least studied areas of weed research has been to evaluate the external costs of weed spread. Ex-ternal costs result when the actions of individuals im-pose uncompensated costs on others. Spreading weeds impose external costs where they adversely affect the economic welfare of other landholders, both private and public. These costs indicate a divergence between the private and socially desirable optimal level of weed control. They are thus a component of the overall so-cial costs attributable to weeds and vary according to
∗Corresponding author. Tel.: +612-63913960;
fax: +612-63913975
E-mail address: [email protected] (R.E. Jones)
the rate of spread, the nature of the production systems affected and the prevailing environment. Where the rate of spread is rapid, the greater is the private–social divergence in control requirements and the stronger is the rationale for public intervention in facilitating weed control (Auld et al., 1987).
External costs are important in relation to weed spread because they are a primary indication of the concept of market failure that is a central issue in proposals for policies of public intervention in weed control. Pannell (1994) considered that market failure pervaded most of the weed management activities of governments. Of the 11 types of market failure that were categorised as being relevant to all weeds, nine were characterised by external costs. The first two cat-egories concerning the spread of weeds between farms
and from farms to the environment are particularly rel-evant to pasture weeds. Pannell considered that the ap-propriate public response to these external cost prob-lems was through direct control and legislation where farms were the source of weed spread in the expec-tation that such activity would generate greater social benefits than the operations of the free market.
Serrated tussock (Nassella trichotoma) is a major weed of pastures in south-eastern Australia given that it has no grazing value because of its high fibre and low protein content and has a propensity to invade and colonise desirable pastures. The main components of the economic problem caused by serrated tussock are the reduced livestock production caused by infes-tations in pastures, the costs of control with herbi-cides and improved pastures and the external costs of spread. While the first two components have been well researched (Vere et al., 1980; Edwards and Freebairn, 1982; Vere et al., 1993; Jones and Vere, 1998), the third has not. The external cost aspect of the serrated tussock problem is now assuming greater prominence as the weed becomes more concentrated in the more marginal agricultural areas. While there has been a long history of successful serrated tussock control by landholders and local government, it is apparent that such direct control methods have been ineffective un-der unfavourable environmental and economic condi-tions (Vere et al., 1993). The problem of serrated tus-sock in these areas persists because many landholders cannot undertake profitable control and this results in the infestation of other areas.
Serrated tussock is now well established in large ar-eas of south-ar-eastern Australia in which the soil fertil-ity and rainfall environments prevent economic con-trol under the preferred method of replacement by im-proved pastures. Heavy infestations of the weed in such areas are a source of infestation to both neigh-bouring and distant lands as serrated tussock seeds can disperse over long distances. Recent surveys in 1994 (Gorham, unpublished) and in 1997 (Jones and Vere, 1998) found that the total area of serrated tussock in New South Wales was 9 and 30% higher than an ear-lier estimate by Campbell (1987). Of a total area of approximately 887,000 ha infested by serrated tussock (Jones and Vere, 1998), 14.1, 24.7 and 61.2% was classified as being heavily, moderately and lightly in-fested, respectively. The Monaro region had 18.1% of the total area of serrated tussock and importantly, 28%
of the heavy infestations which was double the state proportion of heavy to total infestation. In 10 years, heavy serrated tussock areas in the Monaro increased from 2400 to 35000 ha. This temporal change evidence indicates that serrated tussock is a prominent example of the external cost problems caused by weed spread. The external cost aspects of the spread of serrated tussock are now attracting considerable public con-cern. Recognition that the problem of this weed in low potential agricultural country has moved beyond the private control decision context has given rise to proposals for increased levels of public intervention (Anon., 1998). As Pannell (1994) has indicated, the presence of market failure and net social benefits com-prises the economic rationale for such activity. As the existence of external costs is a foremost condition in the demonstration of market failure, there is a need to evaluate these costs in a logical and consistent manner. The purpose of this paper is to evaluate options for reducing the external costs associated with the spread of serrated tussock. A stochastic simulation model is developed which incorporates two options for control-ling serrated tussock by landholders and one option for public control. While the paper does not attempt to develop a case for public intervention in serrated tussock control, such policies are closely linked with any analysis of the external cost problem.
2. Modelling weed spread
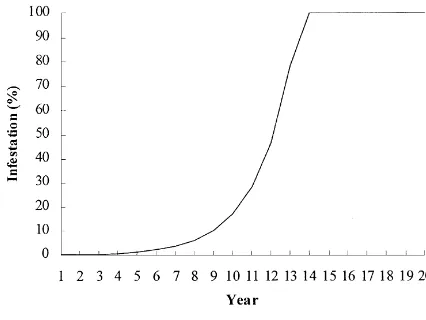
Auld and Coote (1980, 1981) described the rate of weed spread in terms of; (i) population growth rate at a primary infection site, (ii) the proportion of an-nual population increase which is dispersed beyond the boundaries of the infection site; (iii) the area over which the fraction (ii) is dispersed, and (iv) the sus-ceptibility of invaded areas to colonisation. It has been suggested that invading weed species have a constant exponential rate of population growth (Harper, 1977). Auld and Coote (1980, 1981) used an exponential pop-ulation growth model for a weed-affected farm repre-sented by Eq. (1).
where Pn is the population in terms of the
Fig. 1. Exponential weed spread.
0 and 100), P0is the initial population, c is a constant rate factor, and T is the time to full infestation. In this model, population growth continues until Pn= 100,
when complete infestation occurs and Pnremains
con-stant. For the spread of serrated tussock, values of 15–20 years to reach full infestation have been ob-served in naturalised pasture systems. To illustrate the exponential growth model a hypothetical weed spread function is presented in Fig. 1 using parameter values of P0= 2 and T = 15. To derive the function in Fig. 1 the first step is to determine the constant, (1 + c/100), by substituting the appropriate values for Pn and T
into Eq. (1).
The annual levels of weed infestation illustrated in Fig. 1 were thus estimated from the following equa-tion:
For a weed such as serrated tussock, where wind is the main seed dispersal agent, a small proportion of seeds are distributed significant distances from the par-ent plant. Approximately half of the seeds fall near
the parent prior to the inflorescences being dispersed by wind, the remainder are transported in the inflores-cence to spread on and beyond the farm. In relation to the annual increment in population growth, it is rea-sonable to assume that the dispersal fraction from one farm to others is a constant from year to year. If a fixed proportion, s, of the annual population increase occurs beyond the farm then Auld and Coote (1980, 1981) propose annual population growth (on the farm) as;
Pn=
In this study the annual population growth equation as proposed by Auld and Coote (1980, 1981) is reformu-lated to Eq. (3). This equation has two developments. First, notation (i) is introduced to represent the spe-cific farm infested and, second, it is now a Markov equation as infestation in year n is a function of in-festation in year n−1 and not the initial infestation in year 0. This latter feature facilitates the modelling of a dynamic system.
Eq. (3) implies that the weed population growth on farm i is reduced to the extent that some of the pop-ulation growth is dispersed beyond the farm bound-ary. The first term within the brackets of Eq. (3), (1 + ci/100), represents the proportional increase in
weed infestation while the second term, (1−si/100),
represents the proportion of the new infestation dis-persed beyond the farm. Consequently, Pi,nrepresents
the level of infestation only on farm i in year n, not the total level of infestation derived from the previous farm infestation, Pi ,n−1.
Now consider a neighbour, farm j. Weed popula-tion growth on this farm will be a funcpopula-tion of increas-ing density from previous infestations on farm j, plus additional infestations from the dispersal fraction on farm i. This is represented as follows;
This process of weed spread may continue with farm
j (and possibly farm i) dispersing a fraction of
infesta-tion to farm k and so on. Addiinfesta-tionally, there is the po-tential for infestation dispersal from farm j to farm i. If farm j has no initial weed presence, i.e. Pj ,0= 0, then the only source of weed infestation is from colonisa-tion by weed dispersal from farm i. However, once this takes place then Pj ,n> 0 and population growth
can occur from infestations within the farm.
As the parameter s is a proportional increase in in-festation from farm i to farm j, it is independent of the size of farm j. Consequently, the area of infesta-tion occurring on farm j in any given year from farm
i is calculated as a function of the infested area on
farm i by the dispersal fraction. Auld and Coote (1980, 1981) restricted the parameter s to occur only follow-ing population saturation at the farm level. Given the nature of seed spread from serrated tussock there ap-pears little evidence to impose such a constraint and the approach adopted here was to allow spread at all population levels.
3. The serrated tussock model
A stochastic simulation model was developed to evaluate management options for reducing the external cost of serrated tussock. Rainfall is the major stochas-tic variable as it affects pasture productivity, and there-fore potential livestock stocking rate, and the estab-lishment success of perennial pastures and trees. The principles of weed spread are explicitly incorporated in the model as is the impact of serrated tussock on pasture and livestock performance.
The model used a Latin hypercube sampling proce-dure and was solved for 5000 iterations over 25 years at a discount rate of 5%. The solution included esti-mated means, standard deviations and percentile val-ues for net present value (NPV) for each specific area. The model estimated the benefits of a range of control scenarios and ranked the results according to stochas-tic dominance (Anderson et al., 1977).
3.1. Land types
The effect of serrated tussock spread on- and off-farm was estimated from Eqs. (3) and (4). The private cost from weed spread was determined by
ap-plying Eq. (3) to estimate weed density, while Eq. (4) was used to determine the associated external costs.
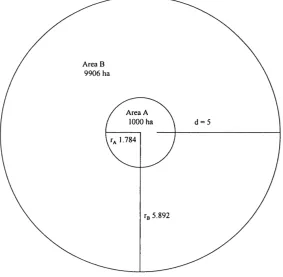
The external costs of serrated tussock and the ben-efits of its control were estimated for two represen-tative land types in a low rainfall environment. Area
A comprised of a naturalised pasture on non-arable
land with low soil fertility and a heavy serrated tus-sock infestation. Area B comprised of a fertilised mix of naturalised pasture in arable high fertility country and with no initial serrated tussock. The distribution of spread of serrated tussock over area B, through the dispersal proportion s, was assumed to be uniform. The alternative land types are illustrated in Fig. 2 and are represented by the two concentric rings, the inner circle being area A while the outer ring is area B. The external boundary of area B represents the outer limit to which new infestations can occur. Areas A and B can be thought of as representing farms i and j, but here area B represents an aggregation of three to four farms affected by seed dispersal from farm i (i.e. area
A). By treating area B as one large farm, infestation
of neighbouring farms in area B is endogenously in-corporated through the first term of Eq. (4).
Although serrated tussock seeds have been observed to travel up to 20 km, the large proportion of seeds which lead to new infestations occur on neighbour-ing farms and consequently travel much smaller dis-tances. Accordingly, the dispersal proportion was con-fined to a radius of 5 km from the source. It is assumed that weeds are distributed uniformly in area A and the source of the infestation is taken to be the midpoint of the radius of area A, rA.
Given the relationship between the dispersal pro-portion (s) and the distance seeds can travel (d) there is a direct relationship between the size of area A and the circumference of area B and accordingly its area. Setting area A to be 1000 ha, the radius (rA) is
calcu-lated at 1.784 km (r = 0.1√A/π)1. If d = 5 the radius of area B (rB) is 5.892 km [i.e. 5 + 0.5(1.784)] and the
size of area B is calculated as;
B=π100rB2−A
Fig. 2. Land types for measuring weed spread. where B and A are the sizes of the respective
ar-eas. From this process area B was determined to be 9906 ha.
3.2. Control scenarios and annual decisions
Three separate serrated tussock control scenarios were proposed for area A. Control options in area B were not included as the objective was to evaluate the external cost of weed spread imposed on this region. A ‘no control’ scenario was used to estimate the impact of each of the control scenarios upon the external cost due to weed spread. A ‘no control’ scenario is not a serious management option as serrated tussock is a declared noxious weed and by legislation must be controlled. The three control scenarios are described as follows.
Scenario 1: Naturalised pasture with periodic
her-bicide control. This scenario involves the spraying of a herbicide on a naturalised pasture supporting sheep when serrated tussock exceeds 50% of the area. This is the least cost scenario and given that no additional
con-trols are imposed (such as competitive pasture species) it can be expected that serrated tussock will need to be controlled again within 7–10 years. The main species in this pasture are winter growing Danthonia spp.,
Trifolium subterraneum, annual grasses (Vulpia spp., Hordeum leporinum), and summer-growing Bothri-ochloa macra, Microlaena stipoides, Themeda trian-dra and Stipa spp. Given the nature of summer and
winter production from these pastures, annual rainfall distribution is considered an important determinant of pasture production. As the herbicides used to control serrated tussock can have a negative effect upon some of these species, no livestock can be supported in the year of control. After a herbicide treatment it can take up to 3 years until a pasture fully recovers and, conse-quently, stocking rates of 50 and 80% of full carrying capacity in the years 2 and 3 after control are assumed.
Scenario 2: Introduced perennial pasture. A
suc-cessful method of serrated tussock control is to sow a competitive introduced perennial pasture, such as
es-tablished, these species can replace serrated tussock on infested areas and provide long-term control. On non-arable low fertility country, the probability of suc-cessful establishment is low due to the difficulty in establishing pastures by aerial seeding in dry years. The two critical periods for rainfall which determine whether establishment will be successful are June to August and September to December. If rainfall is defi-cient in either of these two periods, a perennial pasture will fail to establish and re-sowing will be necessary when seasonal conditions permit. Rainfall from May to December determines production once the pasture is established from the air. The treated area should be rested from grazing for 1 year following sowing to en-sure maximum weed control from sown pastures. As it takes 3–4 years for a newly established perennial pasture to reach full production, pasture production in years 2 and 3 following the establishment were set to be 50 and 80% of full production, respectively.
Scenario 3: Tree establishment. Vere et al. (1993)
demonstrated that it is unprofitable to control serrated tussock by pasture improvement in non-arable areas with low rainfall and low soil fertility. Campbell and Nicol (1996) proposed that the establishment of trees to control weeds would be a more sustainable option in such situations. Tree varieties that achieve this goal are Pinus radiata and various species of Eucalyptus. The objective of tree planting is solely for weed control and no financial returns, either from agroforestry or firewood, are to be expected. This means that the land is withdrawn from agricultural production. Rainfall between May and December determines the success or failure of tree establishment. If drought conditions prevail during this period then tree establishment has failed and would need to be repeated the following year. Once trees have established, moderate variations in climate do not have a significant effect upon the efficacy of serrated tussock control by trees.
The capital and annual variable costs for the sce-narios are given in Table 1. The details of the annual management decisions for the three control scenarios are given in Table 2.
3.3. Control effects
The dispersal proportion sA(i.e. dispersal from area
A) was set at 5 which, due to a lack of more objective
Table 1
Capital and variable costs associated with control strategies Capital Variable cost ($/ha) cost ($/ha) Naturalised pasture — herbicide control 100 – Maintain naturalised pasture – 15 Establish perennial pasture 286 – Maintain perennial pasture – 90
Establish trees 725 –
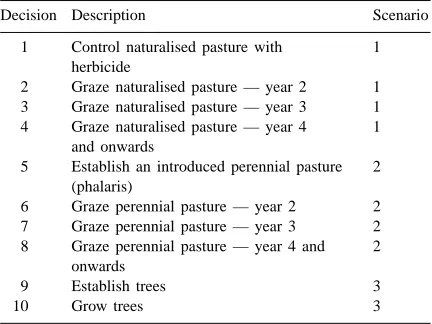
Table 2
Annual decisions associated with control strategies
Decision Description Scenario
1 Control naturalised pasture with herbicide
1 2 Graze naturalised pasture — year 2 1 3 Graze naturalised pasture — year 3 1 4 Graze naturalised pasture — year 4
and onwards
1 5 Establish an introduced perennial pasture
(phalaris)
2 6 Graze perennial pasture — year 2 2 7 Graze perennial pasture — year 3 2 8 Graze perennial pasture — year 4 and
onwards
2
9 Establish trees 3
10 Grow trees 3
information, was obtained from anecdotal evidence. For Scenario 3 it was assumed that trees reduced seed dispersal by 95% from a combination of the tree cover and increased competition from other plant species that establish once serrated tussock and livestock are removed from the system. The number of years un-til full infestation, T, was set at 15, 30 and 100 for scenarios 1, 2 and 3, respectively. The effect of the different control methods was to reduce the level of infestation in the year of treatment. The new level of infestation following control was 3% (i.e. PA,n= 3, a
97% weed kill) for each control decision. The initial weed infestations were set in the model at PA,0= 80 and PB ,0= 0.
3.4. Climatic effects
Table 3
Rainfall probability distributions
Rainfall Distribution Mean Standard
period type deviation
Annual Lognormal 480.86 142.33 June to August Lognormal 83.42 48.44 September to November Lognormal 125.90 67.75 May to December Normal 289.26 90.85 conditions in the region — drought, dry, median and favourable. Monthly rainfall data for the township of Dalgety between 1896 and 1994 was used to construct each climatic scenario and determine the associated probabilities of occurrence.
Four rainfall periods were derived; annual, June to August, September to November, and May to Decem-ber. Annual rainfall was used to estimate production of native pastures. The two rainfall periods June to August and September to November were used to esti-mate the success or failure of establishing a perennial pasture. The period May to December was used to es-timate the production of an established perennial pas-ture and the success or failure of tree establishment.
The appropriate probability distribution for rainfall is expected to be either a normal distribution or a log-normal distribution to account for any possible skew-ness in the data. For the four rainfall periods various probability distributions were tested for goodness of fit and the distributions and parameters chosen are given in Table 3.
3.5. Pasture production
The production of naturalised and perennial pas-tures was based on the daily pasture growth curves for poor, average and good growing conditions, rep-resented by the 25th, 50th and 75th percentiles (Mc-Donald, 1995). These descriptions corresponded with the dry, median and favourable descriptions used in this analysis and McDonald’s seasonal trends were used for both naturalised and perennial pastures, with a drought category included and calculated at the 10th percentile of pasture dry matter production (Table 4). An ‘expert’ panel approach was used to estimate the production differences in the monthly growth curves for different soil fertility and rainfall conditions.
The livestock enterprise considered was a Merino wether system producing 21mm wool. The potential
Table 4
Climatic effects on pasture production by seasonal growing con-dition (kg DM/ha)
Growing conditions
Drought Dry Median Favourable High fertility
Perennial pasture 2421 4841 9630 16416 Good native pasture 1159 2318 4725 9486 Poor native pasture 587 1174 2490 4847 Medium fertility
Perennial pasture 1936 3873 7701 13133 Good native pasture 927 1854 3780 7589 Poor native pasture 470 939 1992 3878 Low fertility
Perennial pasture 1452 2905 5778 9850 Good native pasture 695 1391 2835 5691 Poor native pasture 352 704 1494 2908
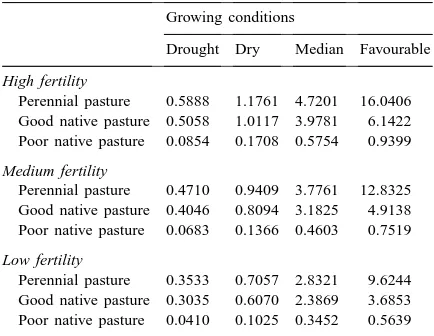
Table 5
Climatic effects on stocking rate by seasonal growing condition (DSE/ha)
Growing conditions
Drought Dry Median Favourable High fertility
Perennial pasture 0.5888 1.1761 4.7201 16.0406 Good native pasture 0.5058 1.0117 3.9781 6.1422 Poor native pasture 0.0854 0.1708 0.5754 0.9399 Medium fertility
Perennial pasture 0.4710 0.9409 3.7761 12.8325 Good native pasture 0.4046 0.8094 3.1825 4.9138 Poor native pasture 0.0683 0.1366 0.4603 0.7519 Low fertility
Perennial pasture 0.3533 0.7057 2.8321 9.6244 Good native pasture 0.3035 0.6070 2.3869 3.6853 Poor native pasture 0.0410 0.1025 0.3452 0.5639
livestock carrying capacity2for each soil fertility, pas-ture type and climatic scenario were determined from a linear programming model of southern New South Wales (Table 5) which incorporated the seasonality of pasture supply and livestock feed demands (Jones and Vere, 1998).
3.6. Weed effects
Following the approach of Denne (1988) and Jones and Vere (1998) it was assumed that there is a linear relationship between weed density and pasture yield loss. Thus, if a serrated tussock infestation is 40% of an area, there is expected to be a 40% reduction in pasture production.
Cousens (1985) has argued that the appropriate yield loss function for annual crops is a rectangular hyperbola because at low densities weeds are most competitive to crops and hence cause a maximum marginal reduction in yield. The effect of an increase in weed numbers at low densities is additive. How-ever, when the density is high increased intra-specific weed competition tends to reduce the marginal yield loss. The function that Cousens derived was;
YL=
I D
1+(I D/A) (5)
where YL is percentage yield lost because of weed competition, D is weed density (plants per square me-tre), I is the percentage yield loss per unit weed density as weed density approaches zero, and A is an estimate of the maximum yield loss of a weedy crop relative to the yield of a weed free crop.
This hyperbolic yield-loss function has been vali-dated (Cousens et al., 1984; Martin et al., 1987) for annual crops where weeds are measured in terms of some land unit, such as plants per square metre. There have been few attempts in pasture systems to either validate the hyperbolic function or estimate the most appropriate functional form for yield loss when weed infestations are reported on a percentage infestation. As a result, in the absence of any better information the simpler linear yield loss relationship has been adopted here.
3.7. Economic effects
The economic performance measure used in this analysis is the NPV of annual profit over a 25 year simulation period. NPVs were calculated separately for area A, area B and the combined total of the two areas. The annual profit function for both area A and area B was calculated as follows;
πi,n=Hi
1−Pi,n 100
SRs,k,nGM−ACn−Kn
(6)
whereπi,nis the profit of the ith region in year n, H
is the area (hectares) of the ith region, Pi ,nis the level
of infestation on the ith area in year n, SRs,k,n is the
stocking rate of the kth pasture type in the sth season in year n (Table 5), GM is the annual sheep enterprise gross margin ($15.40 per DSE), AC are annual oper-ating costs and K are capital costs (Table 1). The pa-rameter i can take values of A for area A, B for area B and T for the total area whereπT ,n=πA,n+πB ,n. For
scenario 3, SR was set to zero so πA,0=−725,000 (i.e. –$725×1000 ha) and zero thereafter. The dis-count rate used was 5%.
4. Results
4.1. Level of serrated tussock infestation
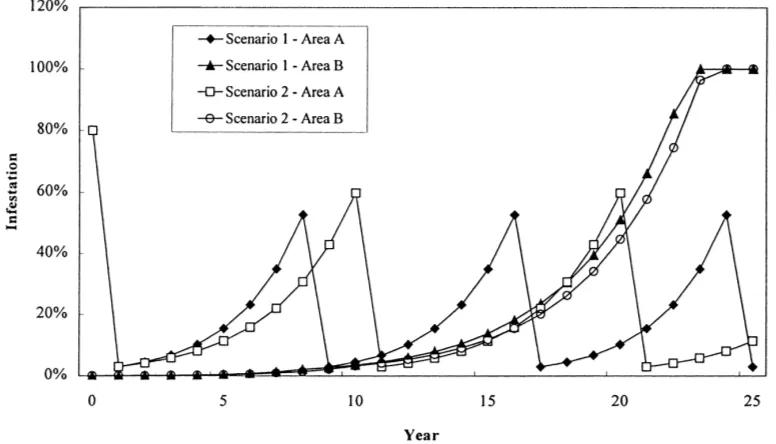
The expected level of serrated tussock infestation of both area A and area B for each control scenario (Fig. 3) was derived from a deterministic version of the model. Application of control scenario 3 resulted in infestation levels close to zero in both areas and was not plotted. Implementation of scenarios 1 and 2 both reduced the level of infestation on area A, however, within a 7–10-year period significant re-infestation had occurred and control was again necessary. Re-liance upon either scenario 1 or 2 to control serrated tussock infestations in area A resulted in a significant level of infestation in the previously unaffected area
B within 20 years.
4.2. Benefits of the control options
The ‘no control’ scenario for area A was run in ad-dition to the three control scenarios to compare the economic benefits of each scenario for area A, area B and the total area. Reported in Table 6 are the mini-mum, maximini-mum, mean and standard deviation of NPV for each scenario.
Area A: The ‘no control’ scenario resulted in a mean
Fig. 3. Infestation of serrated tussock on areas A and B for scenarios 1 and 2. Table 6
Simulation model NPV results ($)
Minimum Maximum Mean Standard deviation
No control
Area A −211409 −211409 −211409 0
Area B 164901 2454092 1377136 334035
Total −46508 2242683 1165727 334035
Scenario 1
Area A −368935 −347031 −358047 3298
Area B 4439285 7562788 6051184 482760
Total 4070786 7215757 5693137 485597
Scenario 2
Area A −186775 776226 314642 154602
Area B 4675246 8305960 6323640 519017
Total 5016550 8276932 6638282 505698
Scenario 3
Area A −1348073 −690476 −693326 43194
Area B 5648109 9450052 7724302 523733
Total 4957632 8759576 7030976 524939
of high control costs and low stocking rates. Tree establishment has high capital costs and no annual income, consequently the mean NPV of scenario 3 (−$693,326) was the lowest of all the scenarios.
Area B: The ‘no control’ scenario resulted in the
lowest mean NPV ($1,377,136). Scenario 3 resulted in the highest mean NPV ($7,724,302) followed by
NPV for scenarios 1, 2 and 3, respectively. On the basis of these results, adoption of scenario 3 to con-trol serrated tussock in area A would be preferred by landholders in area B as it resulted in the minimum external cost being imposed upon them.
The total area: An economic trade-off is involved in
protecting production in area B by establishing trees in area A. The opportunity cost to area A ($1,007,968 mean NPV) is represented by the difference in mean NPV between scenarios 2 and 3. Therefore, the combined result from areas A and B are required to determine the socially preferable scenario. Scenario 3 resulted in the greatest mean NPV for the total area ($7,030,976), which was significantly greater than scenario 1 ($5,693,137 mean NPV) and scenario 2 ($6,638,282 mean NPV).
4.3. Risk aversion and stochastic dominance
Ranking the results on the basis of mean NPV im-plies risk neutrality by an individual decision maker. There is evidence that most Australian farmers are risk averse (Bardsley and Harris, 1987) and consequently if risk attitudes are taken into account the rankings of the scenarios may change. For example, for the total area the standard deviation of NPV for scenario 3 was greater than the standard deviation of scenarios 1 and 2, implying a greater degree of income variability and risk.
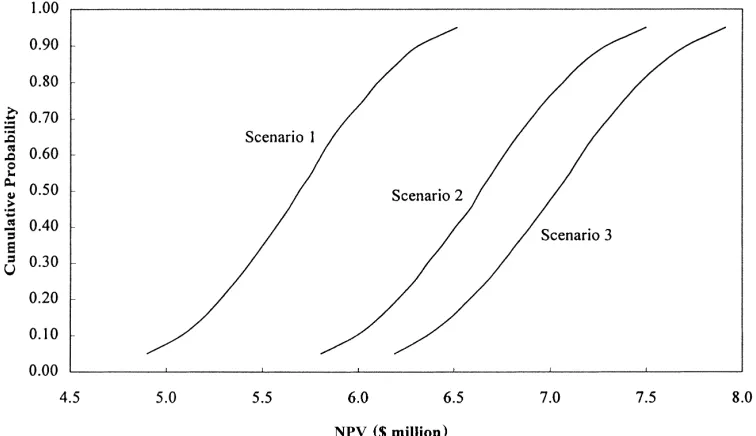
Testing strategies for stochastic dominance is a means of ranking alternative strategies when risk preferences are unknown (Anderson et al., 1977). Stochastic efficiency rules are applied by undertaking pairwise comparisons of the cumulative distribution functions (CDFs) of the scenarios (Fig. 4). On the basis of this analysis scenario 3 was preferred. As sce-nario 3 exhibited first-degree stochastic dominance no further testing, such as for stochastic dominance with respect to a function (Meyer, 1977a, b) was required.
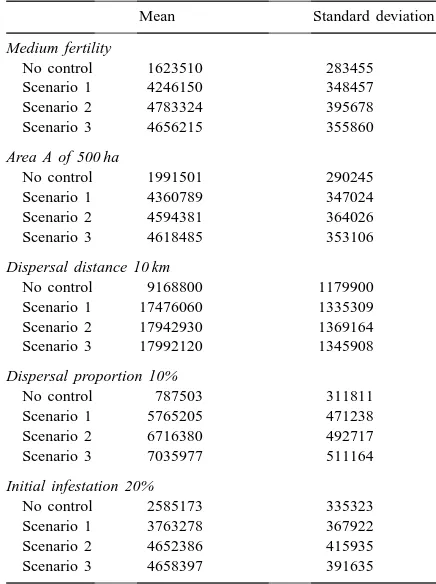
4.4. Sensitivity analyses
Sensitivity analyses were applied to a number of parameters that were considered variable. These were a higher level of soil fertility for area A, different sizes of infestation, a greater dispersal distance, the popula-tion dispersal proporpopula-tion and a lower initial infestapopula-tion
Table 7
Sensitivity analysis on soil fertility, size of area A, dispersal dis-tance and initial infestation ($ NPV)
Mean Standard deviation
Medium fertility
No control 1623510 283455
Scenario 1 4246150 348457
Scenario 2 4783324 395678
Scenario 3 4656215 355860
Area A of 500 ha
No control 1991501 290245
Scenario 1 4360789 347024
Scenario 2 4594381 364026
Scenario 3 4618485 353106
Dispersal distance 10 km
No control 9168800 1179900
Scenario 1 17476060 1335309
Scenario 2 17942930 1369164
Scenario 3 17992120 1345908
Dispersal proportion 10%
No control 787503 311811
Scenario 1 5765205 471238
Scenario 2 6716380 492717
Scenario 3 7035977 511164
Initial infestation 20%
No control 2585173 335323
Scenario 1 3763278 367922
Scenario 2 4652386 415935
Scenario 3 4658397 391635
on area A. Reported in Table 7 are the results from the sensitivity analysis in terms of mean and standard deviation of NPV for the total area.
Effect of alternative soil fertility: The analysis was
repeated for the case where the soil fertility of area
A was medium instead of low. Higher soil fertilities
have greater potential pasture production and stocking rates and thus, greater opportunity costs from their removal from agriculture. Consequently, the optimal solution for controlling weed spread may differ under alternative soil fertility conditions. Adopting a higher soil fertility for area A resulted in scenario 2 being the preferred control option as it had the (marginally) highest mean NPV.
Alternative size in infested area: The size of many
motherload areas in the Monaro region may be smaller than the assumed 1000 ha. Reducing the size of area
A to 500 ha tested the effect of the size of the infested
Fig. 4. Cumulative distribution functions for the alternative scenarios.
change in the optimal solution with scenario 3 remain-ing the preferred control option, although it was only marginally superior to scenario 2.
Seed dispersal distance: The analysis purposely
used a conservative estimate of the dispersal distance,
d. Given the uncertainty of the distance with which
new infestations can occur from the original source, parameter d was increased from 5 to 10 km. The ef-fect of this change was to increase the size of area
B from 9906 to 36,271 ha. Despite the size of the
external cost increasing with the increase in dispersal distance, there was no change in the relative rankings of the scenarios.
Population dispersal proportion: The population
dispersal proportion parameter, s, was obtained from anecdotal evidence. The effect of variations in the parameter was tested arbitrarily by increasing the pa-rameter value from 5 to 10%. This only had a marginal effect on the mean NPV for the three scenarios and did not change the preferred ranking.
Initial level of infestation: The analysis was repeated
for a significantly lower level of initial infestation of serrated tussock. At an initial infestation of 20% there was little difference between scenarios 2 and 3. The larger standard deviation associated with scenario 2 suggests that scenario 3 would remain the preferred
control option even for lower levels of initial infesta-tion on area A.
5. Summary and discussion
An important cost associated with weeds is the ex-ternal cost due to weed spread beyond farm bound-aries. A stochastic simulation model was developed to determine the size of the external cost from the pasture weed serrated tussock in south-eastern Australia and to evaluate the benefits of alternative control scenarios. The model measured the rate of spread both within an area already infested with serrated tussock and an ad-joining area, not previously infested, which was sus-ceptible to weed spread from wind-borne seeds. Both areas were assumed to be in a low rainfall region and the infested area was of low soil fertility.
trees, a result that held for risk attitudes ranging from risk-neutral to risk-averse. This scenario minimised the external cost from serrated tussock spreading to the adjoining area. The scenario that maximised re-turns to the private landholder within the infested area was control with a herbicide followed by establish-ment of an introduced perennial pasture. The com-monly adopted control option of periodic herbicide use in a naturalised pasture system gave negative returns. The reasons for the adoption of this scenario are com-pulsion by legislation, and severe budget constraints combined with the high capital costs of establishing an introduced perennial pasture. Sensitivity analyses on the results indicated that they were robust for a range in variation in key parameters. The ranking of the op-tions changed when the infested area was assumed to be of medium instead of low fertility, in which case the perennial pasture control scenario became socially optimal.
This analysis indicates that there is a clear di-vergence between the socially optimal form of ser-rated tussock control, re-vegetation with trees, and that which is privately optimal to an individual decision-maker on the infested area, introduced peren-nial pasture. Pursuing the privately optimal form of control will result in continued and significant exter-nal costs to neighbouring landholders. This represents an example of market failure, a necessary condition before any form of government intervention can be justified.
The policy implications of these results mainly re-late to the issues of justifying some form of interven-tion in weed control and to the more difficult policy of acquiring marginal agricultural and environmentally sensitive land from private landholders. The first issue is more readily addressed where the external costs and market failure aspects of the problem have been estab-lished. The second issue is more difficult because of the often politically sensitive nature of land retirement. The community’s acceptance of a land acquisition and rehabilitation policy is expected to be mixed. Some individuals, particularly those affected by the external costs, will support this policy while others will resist moves to retire their land from agriculture. There are few Australian precedents for such a policy and the political acceptance is unknown. An alternative and perhaps more efficient option to direct government in-tervention may be for landholders affected by weed
spread to instigate some form of collective action at a regional or catchment level, such as purchasing or re-habilitating these marginal lands. This represents mar-ket driven policy response to the problem rather than reliance upon government intervention.
The estimated benefits for scenario 3 are consid-ered conservative as they only consider the agricul-tural benefits from a reduction in the external costs of weed spread. There are a range of environmental amenity values attached to native ecosystems which are likely to be improved by the re-vegetation of agri-cultural lands, particularly if it involves native species. In addition, there may be benefits also associated with tree planting in terms of reduced soil loss and stream turbidity, a reduction in hydraulic loading with con-sequent improved dryland salinity effects, and the en-couragement of a greater natural bio-diversity. Envi-ronmental benefits may also be derived from retiring marginal agricultural land and revegetation with trees due to the cessation of periodic chemical use to con-trol serrated tussock.
The results indicate that care needs to be taken when designing an economic analysis of weed spread. Proper consideration must be given to adjoining land that is negatively impacted upon by spread from in-fested areas. If an analysis focuses on the benefits and costs of control solely within the infested area, then the derived preferred strategies are unlikely to closely correlate with those that are socially optimal.
References
Anderson, J.R., Dillon, J.L., Hardaker, J.B., 1977. Agricultural Decision Analysis. Iowa State University Press, Ames. Anon., 1998. Proc. of Workshop on Recovering the Monaro.
Cooma.
Auld, B.A., Coote, B.G., 1980. A model of a spreading plant population. Oikos 34, 287–292.
Auld, B.A., Coote, B.G., 1981. Prediction of pasture invasion by Nassella trichotoma (gramineae) in south east Australia. Prot. Ecol. 3, 271–277.
Auld, B.A., Menz, K., Tisdell, C., 1987. Weed Control Economics. Academic Press, London.
Bardsley, P., Harris, M., 1987. An approach to the econometric estimation of attitudes to risk in agriculture. Aust. J. Agric. Econ. 31 (2), 112–126.
Campbell, M.H., Nicol, H.I., 1996. Establishing trees on non-arable land to control weeds. In: Proc. 11th Australian Weeds Conference, Melbourne, pp. 493–496.
Cousens, R., 1985. A simple model relating yield loss to weed density. Ann. App. Biol. 107, 239–252.
Cousens, R., Peters, N.C.B., Marshall, C.J., 1984. Models of yield loss — weed density relationships. In: Proc. 7th International Symposium on Weed Biology, Ecology and Systematics, Paris, pp. 367–374.
Denne, T., 1988. Economics of nassella tussock (Nassella trichotoma) control in New Zealand. Agric. Ecosystems and Environ. 20, 259–278.
Edwards, G.W., Freebairn, J.W., 1982. The social benefits from an increase in productivity in a part of an industry. Rev. Mktg Agric. Econ. 50 (2), 193–210.
Harper, J.L., 1977. Population Biology of Plants. Academic Press, London.
Jones, R.E., Vere, D.T., 1998. The economics of serrated tussock in New South Wales. Plant Prot. Quart. 13 (2), 70–76.
McDonald, W., 1995. Matching pasture production to livestock enterprise requirements for Tableland and Slopes districts of NSW. NSW Agriculture, unpublished mimeo.
Martin, R.J., Cullis, B.R., McNamara, D.W., 1987. Prediction of wheat yield loss due to competition by wild oats (Avena spp.). Aust. J. Agric. Res. 38, 487–499.
Meyer, J., 1977a. Choice among distributions. J. Econ. Theory 14 (2), 326–336.
Meyer, J., 1977b. Second-degree stochastic dominance with respect to a function. Int. Econ. Rev. 18 (2), 477–487.
Pannell, D., 1994. Economic justifications for government involvement in weed management: a catalogue of market failures. Plant Prot. Quart. 9, 131–137.
Vere, D.T., Sinden, J.A., Campbell, M.H., 1980. Social benefits of serrated tussock control in New South Wales. Rev. Mktg. Agric. Econ. 48 (3), 123–138.