Surface/atmosphere exchange and chemical interaction of gases
and aerosols over oilseed rape
Eiko Nemitz
a,b,∗, Mark A. Sutton
a, G. Paul Wyers
c, René P. Otjes
c,
Jan K. Schjoerring
d, Martin W. Gallagher
b, Judith Parrington
e, David Fowler
a,
Thomas W. Choularton
baCentre for Ecology and Hydrology (CEH), Edinburgh Research Station, Bush Estate, Penicuik, Midlothian, Scotland EH26 0QB, UK bDepartment of Physics, UMIST, Sackville Street, PO Box 88, Manchester M60 1QD, UK
cNetherlands Energy Foundation (ECN), Petten ZG1755, Netherlands
dThe Royal Veterinary and Agricultural University (RVAU), Plant Nutrition Laboratory and Centre for Ecology and Environment,
Thorvaldsensvej 40, 1871 Frederiksberg C, Copenhagen, Denmark
eCentre for Ecology and Hydrology (CEH), Merlewood Research Station, Grange-over-Sands, Cumbria LA11 6JU, UK
Received 1 February 1999; received in revised form 19 May 2000; accepted 20 June 2000
Abstract
Measurements of NH3, HCl, HNO3and HNO2gas as well as NH4+, NO3−, Cl−and SO42−aerosol are used to investigate
their surface exchange fluxes and the potential for gas–particle interactions at a clean coastal Scottish site. Mean concentrations of HNO3and HCl were small at 0.68 and 0.32mg m−3, respectively. At relative humidities(h) <85% measured gas
concen-tration products (Km) were smaller than the predicted dissociation constants (Ke), suggesting potential for aerosol evaporation,
but at high h, Keof NH4Cl was exceeded at the mean canopy height. Above the canopy, small aerosol concentrations resulted
in estimated chemical time-scales of >3 min. Thus, chemical reactions should not have affected NH3flux measurements by
aerodynamic gradient methods (AGMs), except for very low turbulence when AGM is not applicable. Within the canopy, however, the diffusive transport provided enough time for NH4Cl to be generated. This was substantiated by measurements
of NH4+emission and high Cl−aerosol concentrations within the canopy.
Micrometeorological measurements above the canopy indicated that gaseous Cl compounds were emitted for most of the time, and this was supported by the source/sink distributions of gaseous and aerosol Cl compounds calculated from in-canopy profiles as well as high apoplastic Cl−concentrations. Although emission of CH3Cl has been reported for other Brassica
species, an unrealistically large emission would be necessary to cause the observed above-canopy gradients. Emission of HCl liberated from unidentified water pools of high Cl−or leaf surface reactions is a more likely source of gaseous Cl compounds. © 2000 Elsevier Science B.V. All rights reserved.
Keywords: Gas-to-particle conversion; Ammonia; Ammonium; Brassica napus; Aerosol deposition; Chloromethane; Inverse Lagrangian
technique; HCl emission
∗Corresponding author. Tel.:+44-131-445-4343;
fax:+44-131-445-3943.
E-mail address: [email protected] (E. Nemitz).
1. Introduction
Since the deposition of atmospheric ammo-nia (NH3) can potentially contribute to ecosystem 0168-1923/00/$ – see front matter © 2000 Elsevier Science B.V. All rights reserved.
eutrophication and soil acidification, many studies have been undertaken to quantify and parameterize the net surface/atmosphere exchange (e.g. Sutton et al., 1993a, 1997). The construction of fast response sensors for NH3, which would allow the flux to be derived directly by eddy-correlation, is difficult, and their application is generally limited to high air con-centrations. Relaxed eddy accumulation systems for NH3are currently under development (e.g. Zhu et al., 2000), and these may soon enable slow response mon-itors to be applied to measure the vertical NH3flux at a single height. In the meantime, NH3fluxes can only be inferred from vertical gradients (e.g. aerodynamic gradient method, AGM). These gradients can be mea-sured with automated slow response monitors, such as continuous wet denuders (e.g. AMANDA, Wyers et al., 1993) or batch sampling methods, including filter-packs (e.g. Allen et al., 1989) and dry denuders (e.g. Ferm, 1979).
The AGM is only applicable if the measured flux is constant over the height range of the measure-ments, a pre-requisite that is violated as soon as chemical conversion processes occur. As the major gaseous base in the atmosphere, NH3 takes part in a variety of neutralization reactions and in particu-lar it reacts with sulphuric acid (H2SO4), nitric acid (HNO3) and hydrochloric acid (HCl) to form the associated ammonium (NH4+) aerosols. While the surface vapour pressures over ammonium sulphates are negligible, NH4NO3and NH4Cl may re-evaporate once the vapour phase concentrations drop below the value in equilibrium with the aerosol phase. Whereas the particle formation process is known as gas-to-particle conversion (GTPC), the evaporation of volatile NH4+ aerosol is here termed particle-to-gas conversion (PTGC), and both processes together are referred to as gas–particle interconversion (GPIC). Owing to differences in the exchange rates of the different species, these reactions can result in devi-ation from normal log-linear concentrdevi-ation profiles and lead to fluxes that change with height. Several models have been developed for the implementation of ’modified gradient techniques’ to infer the sur-face flux of chemically reactive species from profile measurements (e.g. Brost et al., 1988; Kramm and Dlugi, 1994; Nemitz et al., 1996; Van Oss et al., 1998). Due to large uncertainties in the reaction rate coefficients (Kramm and Dlugi, 1994) or
chemi-cal time-schemi-cales (Wexler and Seinfeld, 1990), these models are not yet applicable on a routine basis. In addition, model results have rarely been compared with measurements. Nevertheless, initial modelling results have shown that reactions could theoretically change NH3 fluxes by as much as 40% (Kramm and Dlugi, 1994) or even lead to flux reversal (Van Oss et al., 1998). Measurements of NH3 fluxes should therefore be accompanied by investigations into the potential for effects of reactions on the gradients.
A field campaign carried out in June 1995 as part of the EC ‘EXAMINE’ project (Sutton et al., 2000a) near North Berwick, Scotland, was focused on in-vestigations into the processes governing the NH3 exchange with oilseed rape. At the same time the fluxes of atmospheric acids and aerosols were mea-sured, with the idea to provide a dataset for rigorous assessment of new and existing models for ‘modi-fied gradient techniques’. However, the clean Scottish measurement site and the advection of clean polar air resulted in low concentrations close to the de-tection limits and restricts the applicability of these data for detailed model validations. Nevertheless, the data provide information of the exchange of HCl, HNO3 and aerosols and permit general con-clusions on the importance of GTPC/PTGC at clean measurement sites. The objectives of this paper are to
1. calculate concentrations and, where available, fluxes of acidic gases (HCl, HNO3and HNO2) and aerosol species (NH4+, NO3−, Cl− and SO42−), with emphasis on the interpretation of the emis-sions of gaseous Cl compounds observed at this site;
2. calculate source/sink distributions of Cl− and NH4+ aerosol from within-canopy concentration profiles using the inverse Lagrangian technique by Raupach (1989);
3. investigate the potential of gas–particle intercon-version by assessing the gas–aerosol equilibria NH3–HNO3–NH4NO3 and NH3–HCl–NH4Cl, and by estimating time-scales for chemical inter-conversions;
2. Method and theory
2.1. Measurement techniques
The concentration gradients of NH3were continu-ously monitored over a 3 weeks period by two contin-uous ‘AMANDA’ denuder systems (ECN Petten, NL; Wyers et al., 1993), each with inlets at three heights. The concentrations of HNO3, HONO and HCl were continuously measured by individual automated an-nular wet batch denuders (ECN, Petten, NL; Keuken et al., 1988), also at three heights. These systems com-prise the same rotating annular denuder inlets as the AMANDA system, but absorption is provided by ca. 15 ml of 1 mM K2CO3solution. This solution remains in the denuder for a 1 h cycle before it is pumped into a test tube for subsequent laboratory analysis. The sam-ples were analysed at ECN by suppression anion chro-matography using a Dionex AS12A column (4 mm). Given financial constraints, the analysis was limited to a 5-day period (15–21 June 1995).
Ammonium aerosol gradients (NH4+) were mea-sured continuously, employing for the first time in the field the recently developed ‘Steam Jet Aerosol Collector’ (‘SJAC’, ECN, Petten, NL; Khlystov et al., 1995) with an improved detection limit of 0.05mm−3. The air stream passing through a denuder inlet of the type used for the AMANDA is mixed with steam that causes NH4+ containing hygroscopic aerosol parti-cles to grow to a size at which they are impacted in a cyclone. The collected solution is analysed by the same conductivity technique used for the AMANDA (Wyers et al., 1993). In the AMANDA system the sam-ples from the different heights are taken at the same time and stored in the liquid phase in delay loops for subsequent analysis. In this way errors due to sequen-tial sampling are eliminated. In contrast, the use of only one SJAC system made it necessary to alternately sample the air from the denuder inlets at two heights, and sequential sampling errors caused by temporal concentration changes had to be corrected by linear interpolation (Sutton et al., 1993b).
A high volume seven-stage cascade impactor (Model 230 with inlet 235, Andersen Samplers, At-lanta, USA) was run for 18 periods of 5–25 h to quantify the size distribution of particulate NH4+, NO3−, Cl−and SO42−in the size range 0.25–6.2mm, plus backup filter. Ammonia, acid and particle
concentration measurements were supported by profile measurements with up to 10 three-stage filter-packs (Ø=90 mm), containing a 1mm PTFE particle filter (Micro Filtration Systems, US) as well as a NaF im-pregnated (Whatman 41) and a H3PO4 impregnated (Whatman 42) paper filter (Allen et al., 1989). These filter-packs were operated for 29 2-h runs at flow rates of about 12 1 min−1, both above and within the oilseed rape canopy. Gaseous atmospheric Cl com-pounds measured with filter-packs and denuders sys-tems are usually expected to represent HCl, although Allen et al. (1989) noted some positive interference with low efficiency collection of methyl chloride (CH3Cl) and methyl tetrachloride (CCl4), which is here re-examined in the light of emission gradients of gaseous Cl compounds.
The filters of the impactor and filter-packs were analysed for NH4+at CEH Edinburgh, with a flow in-jection analysis system (‘AMFIA’, ECN Petten, NL), employing the same type of conductivity detector as the AMANDA analyser. Analysis for NO3−, NO2−, Cl− and SO42− was carried out on a HPLC anion chromatography at CEH Merlewood (Dionex DX-100 system with a Dionex Ionpac AS4A 10-32, 4 mm× 250 mm column and a self-regenerating suppressor ASAR-1). Low concentrations of the filter-pack ex-tracts necessitated an improvement in the standard HPLC system by the use of a concentrator column (Dionex AS4A 10-32, 4 mm×50 mm). The measure-ments of micrometeorological parameters were out-lined by Sutton et al. (2000b), while within-canopy turbulence was measured as described by Nemitz et al. (2000a).
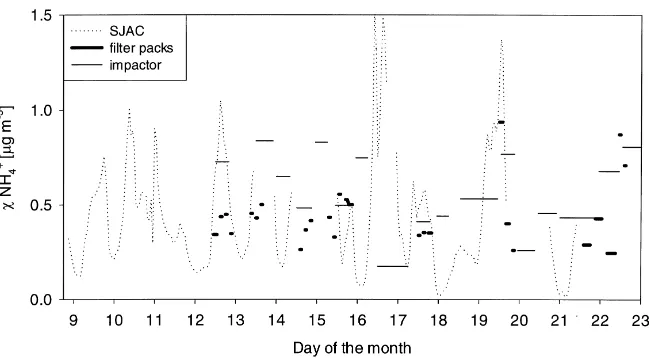
Fig. 1. NH4+concentration interpolated to 1 m as measured by SJAC, filter-packs and cascade impactor during the period 8–23 June 1995.
the need to correct the data of the SJAC for a reduced capture efficiency of 80%.
2.2. Calculation of surface exchange fluxes
Concentrations (χ) of the gases and NH4+aerosol were measured at 1.56 (±0.11) m, 1.95 (not NH4+) m and 3.28 (±0.04) m within the 1.38 m tall oilseed rape canopy. From the concentration gradients fluxes (Fx) were calculated using the AGM outlined by Sutton et al. (2000b)
Fχ = −u∗k
∂χ
∂{ln(z−d)−ψH[(z−d)/L]}
(1)
Here u∗is the friction velocity, k the von Kármán con-stant (0.41), andψH the integrated stability function which changes with height (z) above the zero-plane displacement (d = 1.11 m) and atmospheric stabil-ity, parameterized by the Monin–Obukhov length (L). From the measured flux and the concentration at a ref-erence height (e.g.z−d =1 m), the concentration of the tracer at the mean height of the canopy exchange (z′0) may be derived according to
χ (z′0)=χ (1 m)+Fχ[Ra(1 m)+Rb] (2) where Ra and Rb are the aerodynamic and bound-ary layer resistance, respectively (Garland, 1977). Similarly, gradients in temperature (T), water vapour pressure (ew) and relative humidity (h) may be
extrapolated to the canopy from measurements of the sensible and latent heat fluxes.
2.3. Application of the inverse Lagrangian technique for calculating source/sink distributions within plant canopies
The inverse Lagrangian technique (ILT) by Raupach (1989) derives the source/sink distributions of a scalar in plant canopies from in-canopy measure-ments of concentration profiles and the turbulence structure. Nemitz et al. (2000a) applied the ILT to derive sources and sinks of NH3 within the oilseed rape canopy at North Berwick, and the results are ex-tended here to consideration of within-canopy anion concentrations.
2.4. Estimation of the effect of gas–particle interactions on ammonia flux measurements
measurement artefacts caused by GPIC within the air (Huebert et al., 1988; Sutton et al., 1993a; Zhang et al., 1995) or chemical interactions on the leaf surface (Neftel et al., 1996). Aerosols are expected to deposit at much slower rates, and deviations such as appar-ent emission of aerosols (e.g. Gallagher et al., 1997a) can be used, together with numerical models, to quan-tify the effect of GPIC (e.g. Nemitz et al., 1996). Un-fortunately, during the North Berwick field campaign, background concentrations of atmospheric acids and aerosols were too small to measure all concentration gradients with the accuracy required for reliable flux estimates. Other authors have suggested that the ef-fect of GPIC on NH3 fluxes may be assessed by the log-linearity of the NH3profiles (Harrison et al., 1989; Yamulki et al., 1996). Looking at modelled concen-tration profiles, however, it becomes apparent that the curvature of the profiles is not distinguishable from the scatter of typical measurement data, even if the flux difference between measurement height and surface is as large as 40%, (e.g. Van Oss et al., 1998).
In the present case the effects of GPIC on the mea-sured gradients cannot be derived from the compari-son of measured with expected fluxes, and the inves-tigations are limited to the potential for chemical in-teractions. Since chemical interactions are driven by deviations from equilibrium, it is useful to assess the degree of (dis-)equilibrium between the species and to estimate the kinetic constraint on relaxation. In this study three different approaches are applied.
2.5. Comparison of measured vapour phase concentration products with the values predicted by thermodynamic equilibrium considerations
The measured concentration products of NH3with the acids (Km), i.e. [NH3]×[HNO3] and [NH3]×[HCl] can be compared with the theoretical value of the par-tial pressure product in equilibrium with the aerosol phase (Ke). Potential for aerosol formation would be expected for Km/Ke > 1 and for aerosol evapora-tion forKm/Ke <1, which would result in an over-and an under-estimation of the NH3surface deposition by gradient techniques, respectively (Van Oss et al., 1998). This analysis can provide a measure for the state of the (dis-)equilibrium and an indication for ki-netic constraints upon its attainment. Keincreases with increasing T and decreasing h. For aqueous aerosol Ke
is further reduced by the co-existence of other ions, especially SO42−, and therefore becomes a function of aerosol composition, which generally varies with particle size and type (Stelson and Seinfeld, 1982). For particles with a radius (Rp) < 0.05mm, Ke is increasingly elevated by the Kelvin effect. In the ab-sence of detailed measurements of the aerosol com-position, here formulations of Kewere used that have been derived for pure NH4Cl and NH4NO3(Pio and Harrison, 1987; Mozurkewich, 1993), and may there-fore constitute an overestimate.
2.6. Calculation of the chemical time-scale of the reaction
Wexler and Seinfeld (1992) derived a formula which relates the characteristic time (τ∞) of the achievement
of the equilibrium to the size distribution of the NH4+ aerosol the mean diffusion path length in air (0.065mm) and ρpthe particle density. The most uncertain constant in Eq. (3) is the accommodation coefficient (α) that is as-sumed to be in the range 0.001–1 and was set to 0.1 by Wexler and Seinfeld (1990, 1992). Chemical conver-sion processes are assumed to affect the flux measure-ment if the chemical time-scale (τ∞) is shorter or of
similar magnitude as the turbulent diffusive time-scale (τd) (Kramm and Dlugi, 1994).τdmay be calculated asτd=kz/(1.75u∗), where k is the von Kármán con-stant, z the height and u∗ the friction velocity (Brost
et al., 1988). The application of Eq. (3) withα =1 yields a lower limit forτ∞, and the effect of
chemi-cal reactions is small for values of u∗below a critical value (u∗crit), at whichτd=0.1τ∞ (α=1)
u∗crit= 10kz 1.75τ∞ (α=1)
(4)
2.7. Calculation of the coincidence factor of the size distribution of NH4+with those of NO3−and SO42− aerosols
coincidence factor (Ci) between NH4+ and an an-ionic species (i) as a measure of the degree to which the two species are found in the same size range
Ci =1−0.5 Z ∞
0
mNH4+(Rp)
mtot NH4+
−mi(Rp) mtoti
dRp (5)
m(Rp) denotes the mass distribution function and mtot the total mass of the species (NH4+ or i). Values of Ci range from 1 (total coincidence) down to 0 (no
co-incidence). Since equilibrium theoretically only holds if the NH4+is present as nitrate and sulphate, the au-thors suggest the restriction of the integration to size classes in which the chloride equivalent concentration is small (<0.1 [NH4+]) compared with the ammo-nium equivalent concentration.
3. Results
3.1. Air concentrations of acids and aerosols
The analysis period of the batch denuder sam-ples was selected due to the occurrence of southerly to westerly flow, which could be expected to result in good fetch conditions and higher concentrations than onshore winds. Nevertheless, the concentrations
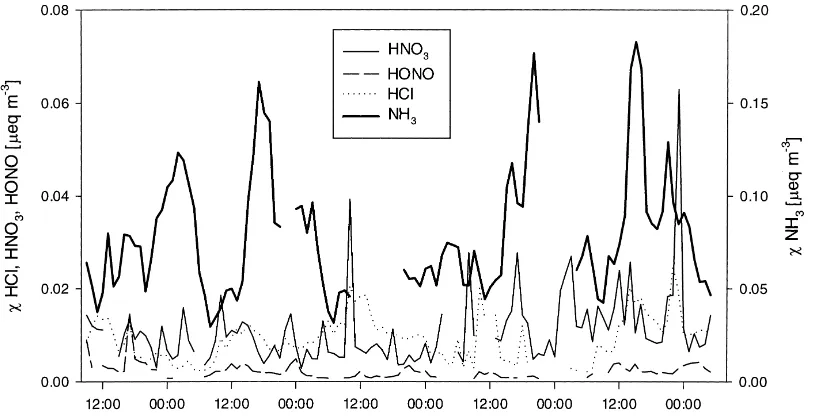
Fig. 2. Concentration (χ) of NH3, HNO3, HNO2 and HCl interpolated for 1 m above then zero plane displacement as measured with the
CEH AMANDA and batch denuders for 16–21 June 1995.
were small with median concentrations of 10 neq m−3 (0.63mg m−3) for HNO3,<4 neq m−3(<0.2mg m−3) for HNO2 and 8.8 neq m−3 (0.32mg m−3) for HCl. Although concentrations in mg m−3 are most com-monly used, Fig. 2 shows the time course of these concentrations in meq m−3 for intercomparison be-tween several species. Gaps in the data are partly due to malfunctioning of the samplers, but mainly due to concentrations below the detection limit of ca. 0.2mg m−3 (HNO3, HNO2 or HCl). There was no clear relation between concentrations and wind direc-tions or time of day, with the exception of HCl, which showed largest air concentrations during the day.
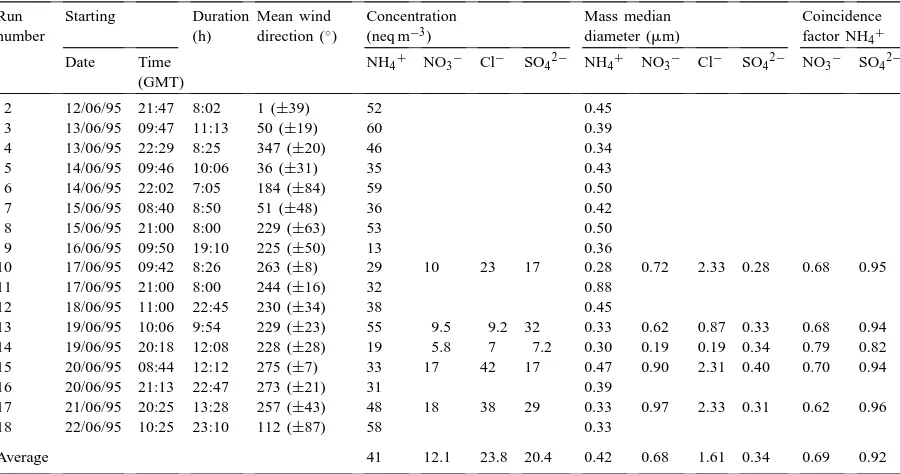
Table 1
Aerosol concentration, mass median diameter (MMD) and coincidence factors as measured with the cascade impactora
Run number
Starting Duration (h)
Mean wind direction (◦)
Concentration (neq m−3)
Mass median diameter (mm)
Coincidence factor NH4+
Date Time (GMT)
NH4+ NO3− Cl− SO42− NH4+ NO3− Cl− SO42− NO3− SO42−
2 12/06/95 21:47 8:02 1 (±39) 52 0.45
3 13/06/95 09:47 11:13 50 (±19) 60 0.39
4 13/06/95 22:29 8:25 347 (±20) 46 0.34
5 14/06/95 09:46 10:06 36 (±31) 35 0.43
6 14/06/95 22:02 7:05 184 (±84) 59 0.50
7 15/06/95 08:40 8:50 51 (±48) 36 0.42
8 15/06/95 21:00 8:00 229 (±63) 53 0.50
9 16/06/95 09:50 19:10 225 (±50) 13 0.36
10 17/06/95 09:42 8:26 263 (±8) 29 10 23 17 0.28 0.72 2.33 0.28 0.68 0.95
11 17/06/95 21:00 8:00 244 (±16) 32 0.88
12 18/06/95 11:00 22:45 230 (±34) 38 0.45
13 19/06/95 10:06 9:54 229 (±23) 55 9.5 9.2 32 0.33 0.62 0.87 0.33 0.68 0.94 14 19/06/95 20:18 12:08 228 (±28) 19 5.8 7 7.2 0.30 0.19 0.19 0.34 0.79 0.82 15 20/06/95 08:44 12:12 275 (±7) 33 17 42 17 0.47 0.90 2.31 0.40 0.70 0.94
16 20/06/95 21:13 22:47 273 (±21) 31 0.39
17 21/06/95 20:25 13:28 257 (±43) 48 18 38 29 0.33 0.97 2.33 0.31 0.62 0.96
18 22/06/95 10:25 23:10 112 (±87) 58 0.33
Average 41 12.1 23.8 20.4 0.42 0.68 1.61 0.34 0.69 0.92
aFewer runs were analysed for anions than for NH
4+. The wind direction is a vector average stated in degrees from North, with the
standard deviation of 10 min values in parentheses. The MMD was calculated by linear interpolation from the plot of the accumulated mass on the impactor stages vs. 50% cut-off diameter (e.g. Hinds, 1982).
of NH4+ and shows maximum values for northerly wind directions (Runs 10, 15 and 17). On these oc-casions NH4+ is more than balanced by the sum of the measured anions, and chloride must be expected to represent mainly marine NaCl, which is typically found in larger size ranges than non-marine NH4+ salts.
3.2. Surface exchange flux of acids and aerosols
Since the concentrations of HNO3 and HNO2 were close to the detection limit, their measurements showed too much scatter for fluxes to be calculated reliably. Although still rather uncertain, the HCl data were more consistent and fluxes could be calculated using the AGM (Section 2.2). Concentrations at 1 m (x) as well as the fluxes (F) are shown in Fig. 3. Both
xand F show a diurnal pattern and interestingly HCl appears to be emitted for most of the time, with larger emission during daytime than during night-time. As this daily variation could be an apparent effect of changes in the friction velocity (u∗), the scaling
pa-rameter(χ∗= −F /u∗), which essentially represents the slope of the log-linear concentration profile of HCl, is shown in Fig. 3 for comparison. The fact that χ∗ also showed larger values during daytime indi-cates that the detected gradient did change over the day, supporting the estimates of the calculated FHCl. In addition, large values of FHCl are positively cor-related with elevated air concentrations (χHCl(1 m)). For a tracer that originates from distant sources and is mainly deposited the magnitude of the (deposition) flux is governed by the air concentration: an increase inχHCl (1 m) should therefore have promoted depo-sition and reduced emission. The fact that at North Berwick emission was linked to high HCl concentra-tions suggests that at this site the elevated concen-trations are a result of the HCl emission from the oilseed rape canopy itself. An analogous conclusion was drawn for NH3(Sutton et al., 2000b). This cor-relation, therefore, strongly supports the occurrence of significant HCl emission.
Fig. 3. HCl results measured with the automated batch denuder systems at three heights during the period 16–21 June. The concentration at 1 m (χHCl), the flux (FHCl) and the scaling parameter (χHCl∗ ) are shown with a 4-h running mean of hourly values, and the error bars
represent the standard error of this running mean.
filter-packs. The fluxes were filtered for low wind speeds (u (1 m) < 1 m s−1), insufficient fetch con-ditions (by footprint analysis as described by Sutton et al., 2000b) and highly stable situations (L−1 > 0.5 m−1). From the remaining values the deposition velocities (Vd) were calculated as
Vd (1 m)= − Fχ
χ (1 m) (6)
The medians of the results are presented in Table 2, where the results of the SJAC measurements are di-vided into three classes of u∗. The median values of Vd for NH4+ increased with u∗, whereas the arith-metic mean of all SJAC data points and in
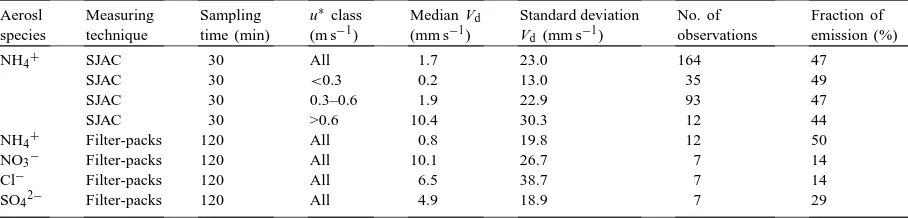
particu-Table 2
Median deposition velocities (Vd) for aerosols as measured at North Berwick with SJAC and filter-packs
Aerosl species
Measuring technique
Sampling time (min)
u∗class (m s−1)
Median Vd
(mm s−1)
Standard deviation
Vd (mm s−1)
No. of observations
Fraction of emission (%)
NH4+ SJAC 30 All 1.7 23.0 164 47
SJAC 30 <0.3 0.2 13.0 35 49
SJAC 30 0.3–0.6 1.9 22.9 93 47
SJAC 30 >0.6 10.4 30.3 12 44
NH4+ Filter-packs 120 All 0.8 19.8 12 50
NO3− Filter-packs 120 All 10.1 26.7 7 14
Cl− Filter-packs 120 All 6.5 38.7 7 14
SO42− Filter-packs 120 All 4.9 18.9 7 29
lar for 0.3 < u∗ < 0.06 m s−1 was negative. Up-ward gradients of NH4+ were measured for half of the time with both SJAC and filter-packs, independent of u∗. However, owing to the low concentrations, all filter-pack NH4+emission gradients turned out not to be significant atP =0.05, although many only just failed this criterion. The mean aerosol deposition ve-locities measured by filter-packs increased in the or-der NH4+, SO42−, NO3−, Cl−, which is consis-tent with the increase in the mass median diameter (Table 1).
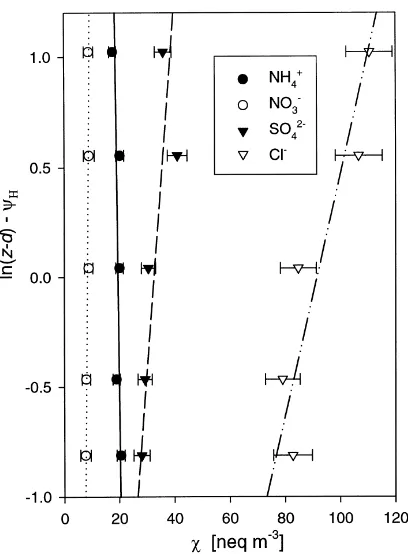
Fig. 4. Example above canopy profiles of NH4+, NO3−, SO42−
and Cl− aerosol as measured with filter-packs on 17 June 1995, 16:00–18:30 GMT. The error bars are the sum of the error due to analytical procedures (ca. 6%) and the standard error in the blanks (N = 4). The corresponding fluxes (±standard er-ror of the regression) were 0.35±0.29 neq m−2s−1 for NH
4+, −0.23±0.07 neq m−2s−1for NO
3−,−1.9±0.78 neq m−2s−1for
SO42−and−5.8±1.4 neq m−2s−1for Cl−, where negative values
represent deposition.
lines when plotted versus ln(z–d)–ψH, where z is the height, d the zero plane displacement andΨHthe inte-grated stability correction function for heat and other scalars (e.g. Sutton et al., 2000b). During this pe-riod NO3− and SO42− showed slow deposition, Cl− was deposited rapidly whereas NH4+ was probably emitted. If the NH4+emission is real, it probably rep-resented NH4Cl. From the equivalent concentrations it is clear that Cl− was dominated by species other than NH4Cl. Consistent with the MMD values from Table 1, a fraction of these were contained in larger and therefore more rapidly depositing particles. A small emission gradient of NH4Cl would easily have been masked by the deposition of non-ammonium Cl−.
3.3. Within-canopy profiles and source/sink analysis
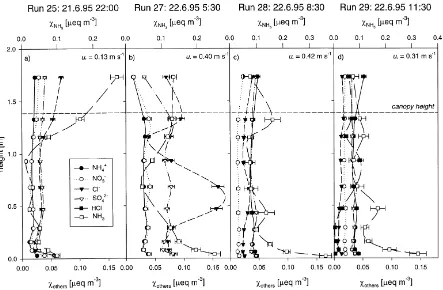
Nemitz et al. (2000a) reported measurements of in-canopy profiles of NH3for the oilseed rape and cal-culated the associated vertical distribution of sources and sinks together with the height-dependent flux. In this section, the same procedure is applied to gradients of aerosols as well as HCl. Fig. 5 shows in-canopy profiles of NH4+, NO3−, Cl− and SO42−aerosols as well as gaseous NH3and HCl inmeq m−3for four runs covering the period from 21 June 22:00 GMT to 22 June 13:30 GMT. The source/sink profiles for Cl− and NH4+as calculated with the ILT for the same runs are presented in Fig. 6.
The NH3 flux above the canopy changed from strong deposition on the evening of 21 June to small deposition during the night and then to emission in the morning of 22 June. During Runs 25 and 27 the NH4+ concentration appeared to be balanced by NO3− whereas later on, the NH4+ exceeded the NO3− concentration, indicating that at least a part of the NH4+ was present as SO42− or Cl− (Fig. 5). During the late evening (Run 25) all species were deposited to the canopy (Fig. 5a) and the sink distri-butions of both Cl− and NH
Fig. 5. Example within-canopy profiles of aerosols, NH3 as well as HCl (for run 29 only) measured with filter-packs during the period
21–22 June. The error bars are sum of the error due to analytical procedures (ca. 6%) and the standard error in the blanks (N=4). The values of u∗are presented to indicate the magnitude of turbulence within the canopy.
Fig. 6. Example distributions of the source/sink density (S) in the oilseed rape canopy for Cl−and NH4+aerosol as well as HCl (Run 29
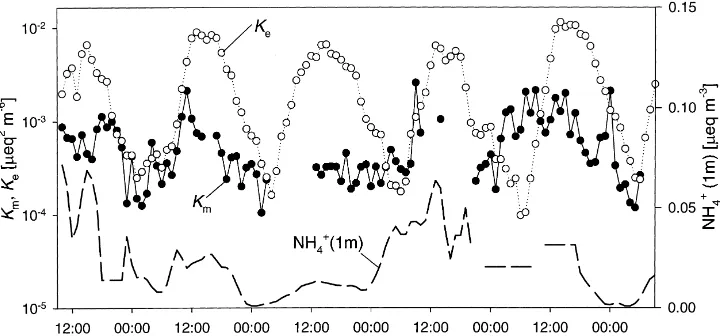
Fig. 7. Time course of measured (Km) and equilibrium (Ke) concentration products between HNO3 and NH3 for 16–21 June. The
concentrations of NH4+(1 m) as measured with SJAC is shown for comparison. Some gaps in the SJAC time-series have been filled with
data from the filter-packs and cascade impactor.
small concentration the source/sink analysis for Cl− aerosol did not reveal a clear structure, while NH4+ was clearly deposited to the top canopy and HCl ap-peared to be released at mid-canopy. A general feature of all within-canopy profiles was the concentration increase near the ground.
3.4. Concentration products
The time courses of the NH4+ concentration and the measured concentration product [NH3]×[HNO3] (Km) are shown in Fig. 7, together with the theoretical equilibrium product for pure NH4+ salts (Ke). Since Ke is a function of T and h, it follows a clear diurnal pattern. Although Kmwas often larger during the day-time than at night, it only exceeded Keon the morning of 20 June. Consequently, during this period forma-tion of NH4NO3aerosol could be expected, whereas at other times, NH4NO3ought to have evaporated. Dur-ing some mornDur-ings (17 and 19 June) the increase in Kmfollowed Keclosely. This could either indicate that during this time the concentrations adjusted to equilib-rium or that Kmincreased due to daytime emission of NH3. Bearing in mind that NH4+ aerosol represents not only NH4NO3 and NH4Cl but also (NH4)2SO4, it seems nevertheless likely that Km did not gener-ally adjust to Ke despite the presence of considerable amounts of volatile NH4+. The h and T dependence
of the measured concentration product with HNO3at 1 m (Fig. 8a) shows that Kmwas smaller than Ke ex-cept for h > 90%. In contradiction to theory, con-centration products were smaller for h < 70% than >70%. In the case of HCl (Fig. 8b), measured concen-tration products appeared to be independent of h, but purely governed by T, attaining values which would be expected forh=95%. Using the measured fluxes of HCl as well as sensible (H) and latent heat (λE) presented by Sutton et al. (2000b), Kmcan be calcu-lated for the notional height of the mean canopy ex-changez0′ according to Eq. (2). These values (Fig. 8c) show a different picture altogether: Km tended to ex-ceed Ke at canopy height forh > 95%, whereas for low h (<60%)Km ≪Ke was found. Hence, at high h there was potential for aerosol production or growth within the canopy at the same time as NH4Cl above the canopy should have evaporated.
3.5. Chemical time-scales
Fig. 8. Comparison of measured concentration products for different temperatures (T) and classes of relative humidity (h) with values predicted from thermodynamic theory for specified relative humidities (lines). (a) According to the products of [HNO3]×[NH3] at 1 m,
aerosol evaporation is expected forh <95%. (b) The product [HCl]×[NH3] at 1 m continuously stays below the equilibrium value,
whereas (c) the product [HCl]×[NH3] extrapolated to the surface (z0′) exceeds Keforh >90%. Data points represent hourly values.
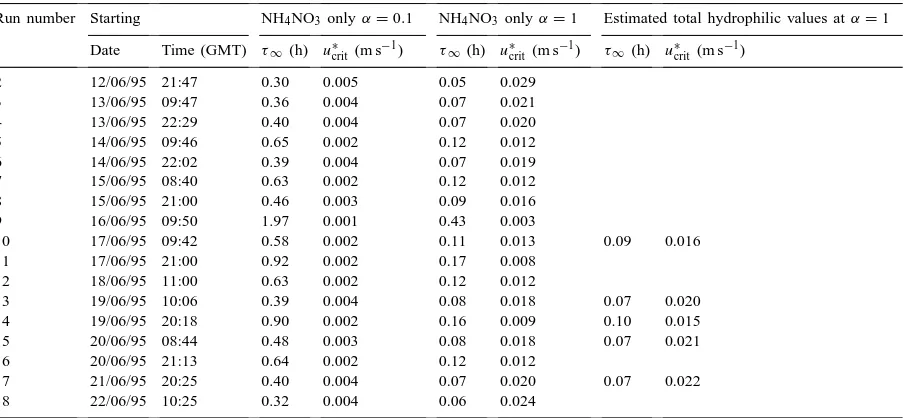
Table 3
Chemical time-scales (τ∞) for two different values of the accommodation coefficient (α) as calculated from the NH4+size spectra assuming
NH4NO3only, as well as from the estimated size spectrum of the total mass of hydrophilic aerosola
Run number Starting NH4NO3 onlyα=0.1 NH4NO3 onlyα=1 Estimated total hydrophilic values atα=1
Date Time (GMT) τ∞ (h) u∗
crit (m s−1) τ∞ (h) u∗crit (m s−1) τ∞(h) u∗crit(m s−1)
2 12/06/95 21:47 0.30 0.005 0.05 0.029
3 13/06/95 09:47 0.36 0.004 0.07 0.021
4 13/06/95 22:29 0.40 0.004 0.07 0.020
5 14/06/95 09:46 0.65 0.002 0.12 0.012
6 14/06/95 22:02 0.39 0.004 0.07 0.019
7 15/06/95 08:40 0.63 0.002 0.12 0.012
8 15/06/95 21:00 0.46 0.003 0.09 0.016
9 16/06/95 09:50 1.97 0.001 0.43 0.003
10 17/06/95 09:42 0.58 0.002 0.11 0.013 0.09 0.016
11 17/06/95 21:00 0.92 0.002 0.17 0.008
12 18/06/95 11:00 0.63 0.002 0.12 0.012
13 19/06/95 10:06 0.39 0.004 0.08 0.018 0.07 0.020
14 19/06/95 20:18 0.90 0.002 0.16 0.009 0.10 0.015
15 20/06/95 08:44 0.48 0.003 0.08 0.018 0.07 0.021
16 20/06/95 21:13 0.64 0.002 0.12 0.012
17 21/06/95 20:25 0.40 0.004 0.07 0.020 0.07 0.022
18 22/06/95 10:25 0.32 0.004 0.06 0.024
aAlso shown are the critical values ofu∗
crit, above which the profile measurements of NH3 can be expected to be unaffected by
can be ruled out, calculated according to Eq. (4). Since condensation is expected to take place to any hydrophilic aerosol (Wexler and Seinfeld, 1992), the limitation to NH4+aerosol may overestimateτ∞. The
aerosol was only analysed for NH4+, Cl−, NO3− and SO42− but not, for instance, for Na+, Ca2+ or Mg2+. Thus, a best estimate of the mass of total hy-drophilic aerosol was obtained as follows: if NH4+ was more than balanced by the sum of the measured anions, any Cl− in excess was thought to represent
NaCl. By contrast, excess NH4+ was interpreted as resulting from an uncertainty in the NO3− measure-ment. Although, the concentration of additional Cl− (interpreted as NaCl) was high during some runs, it only contributed a minor fraction to the total aerosol surface owing to its large MMD (Table 1). Hence, the net effect was only marginally smaller values of τ∞(largeru∗crit) (Table 3). For comparison, measured values of u∗ ranged from 0.004 to 1.0 m s−1. Values ofu∗<0.03 m s−1, the largest values ofu∗crit derived here, were found for less than 2% of the time. How-ever, the applicability of the aerodynamic gradient technique is restricted at such low turbulence and fluxes are very small.
4. Discussion
4.1. Exchange of aerosol
The aerosol Vdmeasured at North Berwick showed considerable variability (Table 2). In other studies Vd has been shown to change with particle size, fric-tion velocity, atmospheric stability and boundary layer height (e.g. Wesley et al., 1985), and a certain range of values is therefore to be expected. Possible arte-facts include gas–particle interactions on the pre-filter of filter-packs (Andersen and Hovmand, 1994) and errors due to sequential sampling at different heights during non-linear concentration changes (Sutton et al., 1993b). The latter problem could explain why the SJAC detected NH4+aerosol emission for 50% of the time (Table 2). However, the filter-pack measurements, though often not significant atP =0.05, showed the same feature. Aerosol emission has been reported in several other studies (Katen and Hubbe, 1985; Gal-lagher et al., 1997a) and it could well be real, espe-cially considering the possibility of aerosol sources
within the canopy. As an average over all emission sit-uations, NH4+contributes 25% to the emission of total reduced nitrogen(NH4++NH3), which constitutes an upper limit of the effect of gas-to-particle conversion at this site. In agreement with theory, the median Vd of NH4+measured with the SJAC increased with u∗, whereas substantial emission periods cause the over-all arithmetic mean to be negative. The mean Vd mea-sured with filter-packs increased with the particle size of the different species (cf. Tables 1 and 3), although the values are not significantly different from each other, due to their large standard deviation. The val-ues of Vdfor NO3−and Cl−are large compared with other measurements (Duyzer, 1994; Gallagher et al., 1997b).
4.2. Emission of HCl
Due to small HCl concentrations the calculated flux is somewhat uncertain. However, the diurnal pattern in the scaling parameterχ∗of HCl and the coincidence of emission with periods of high HCl air concentra-tions, strengthen the confidence in the measurements, indicating that the emissions are a real phenomenon. The HCl emission was on average 20 ng m−2s−1, with peaks of up to 120 ng m−2s−1(Fig. 3), and HCl emission was also indicated by the in-canopy profiles (Figs. 5d and 6d). Due to the scatter in the gradients measured above the canopy and the limited number of filter-pack runs within the canopy, each observation on its own is rather uncertain. However, combined, they make a strong case for the occurrence of HCl emission from the oilseed rape canopy. To this may be added the measurement of high Cl−concentrations of 12.7 mM in the apoplastic liquid of the oilseed rape leaves (Husted et al., 2000). The average Cl−aerosol concentration measured with the cascade impactor at this coastal site was 1.1mg m−3, but this average does not cover maritime wind directions, during which the canopy should be expected to receive a much larger Cl−loading.
and (iii) at usually small u (1.4–2.2 m s−1) there was no efficient mechanism by which particles could have been released from the canopy. By contrast, potential sources of gaseous HCl emission or apparent emission include.
(a) Emission of HCl through the leaf stomata. Even using a high T (25◦C) and the lowest measured pH (4.5) the large apoplastic Cl− concentration would have resulted in χs (HCl) < 4 ng m−3 (Brimble-combe and Clegg, 1990), two orders of magnitude smaller than χ (HCl) at which emission was ob-served. Stomatal emission of HCl from live leaves can therefore be ruled out as the cause of the emission of Cl compounds observed, unless there were localized sites at which the Cl−concentration was much larger or the pH smaller.
(b) Evaporation of HCl from the leaf cuticle, leaf surface chemistry. Unpublished field data obtained by the authors indicate that emission peaks of HCl and HNO3 due to cuticular desorption can occur when concentrations rise in evaporating water-layers, al-though this process should be expected to be limited to the morning hours (Sutton et al., 1997). Neftel et al. (1996) attributed HNO3 emission gradients to the re-evaporation of NH4NO3 from leaf cuticles when leaves heat up in the morning. Another source of HCl could be reactions on leaf surfaces, e.g. Cl− in de-posited sea salt could be replaced by HNO3or H2SO4; both substitution reactions have been shown to be ef-ficient (Rossi et al., 1995; Clegg and Brimblecombe, 1985). However, since the HNO3 concentration was of the same order of magnitude as HCl (Fig. 2), all deposited HNO3would have had to be converted into HCl to yield the emission flux observed.
(c) Emission of CH3Cl. Rather than representing HCl, the gaseous Cl detected could have represented organic Cl compounds: Saini et al. (1995) reported biogenic emissions of halomethanes from 87 plant species and showed that Brassica oleracea has one of the highest activities of the methyl-transferase in-volved in the production of halomethanes. High emis-sions of CH3Cl have also been found to originate from wood-rotting fungi (Harper, 1985) and many oilseed rape leaves showed significant fungal decomposition. However, here the maximum collection efficiency of the batch denuder for CH3Cl was estimated to be 12%, based on kinetic data for the hydrolysis of CH3Cl at T =100◦C (Fells and Moelwyn-Hughes, 1959), and
it is probably much (by a factor of 10–100) less at ambient T. Other biogenic chlorinated hydrocarbons appear to be even less water soluble. The CH3Cl emis-sion flux would have had to be by a factor of 10–100 larger than the HCl flux, derived for Fig. 3 under the assumption of perfect adsorption, to mask a HCl depo-sition flux efficiently. From CH3Cl production rates of Brassica oleracea plants (Saini et al., 1995), emission densities of up to 2 ng Cl m−2s−1may be estimated. Therefore, CH3Cl fluxes of 200–2000 ng Cl m−2s−1 required to cause the measured emission gradients are highly improbable, and the Cl emission fluxes almost certainly represented HCl.
(d) Liberation of gaseous Cl compounds during decomposition. In the oilseed rape canopy the Cl con-centration was largest at the height of the attached senescing leaves. It is possible that part of the Cl− contained in the leaves was released during the decom-position. This could explain why the concentrations increased close to the ground surface, as this was cov-ered with leaf litter that also emitted large quantities of NH3(Nemitz et al., 2000a).
(e) Counter-gradient fluxes close to the ground. The concentration increase close to the ground could have purely physical reasons. Here turbulent diffusion might become a less important transport mechanism than near field effects which have been shown to al-low for counter-gradient transport (Raupach, 1989). The application of the ILT (Fig. 6), in which near field effects are accounted for, shows that for the chosen division of the canopy into source/sink heights, the lowest level did not act as a net source, despite the con-centration increase close to the ground (Nemitz et al., 2000a).
While the exact mechanism of the emission of gaseous Cl compounds could not be identified, it al-most certainly represented HCl, probably originating from senescing/decomposing leaf material or from leaf surface reactions.
4.3. Sources and sinks within the canopy
29) was available for gaseous HCl. However, it also showed the highest concentration in the middle of the canopy. Filter-packs, in particular for NH3 and NH4+, are liable to contamination and this might well be the reason why some single point high con-centrations of NH3 and NH4+ were found during these measurements. In contrast, the in-canopy peaks of Cl− aerosol and HCl gas were indicated by more than one filter-pack and occurred in several sequential runs. Since the humid conditions at night-time within the canopy favour the aerosol phase, it is probable that the Cl−aerosol captured by the filter-packs was generated from emitted gaseous Cl compounds in the canopy air by GTPC or on the surface of the particle filter. Unlike Cl−, NH4+ was measured to be con-tinuously deposited to the canopy during these runs. The ion balance shows that during the concentration build-up, NH4+ could balance only a fraction of the Cl−aerosol and seemed to represent mainly NH4NO3 or (NH4)2SO4. Therefore, a part of the captured Cl− aerosol was not formed by reaction with gaseous NH3.
4.4. Attainment of phase equilibrium at North Berwick
Concentrations of acidic gases were small at this coastal Scottish site, with average values of 10 neq m−3HNO3and 8.8 neq m−3HCl (Fig. 2). The comparison of measured concentration products (Km) with those predicted for thermodynamic equilibrium (Figs. 7 and 8) shows that, at a height of 1 m, gas phase concentrations were generally not in equilib-rium with the aerosol phase. Many comparisons of Km with Ke have been presented, with contradicting results. Harrison and Pio (1983) reported that thermo-dynamic equilibrium was best attained for conditions of low T and high h, while most authors, such as Allen et al. (1989), stated that under these condi-tions dis-equilibrium was most marked. As with the measurements by Erisman et al. (1988) and Zhang et al. (1995), those studies indicated positive depar-tures from equilibrium, reflecting the relatively high pollution at their measurement sites in England and the Netherlands. By contrast, Matsumoto and Tanaka (1996) found Km < Ke for an urban environment without major local sources, which is similar to the present study.
For aqueous aerosol, the coexistence of SO42−can considerably reduce Ke of these species compared with pure solutions (Stelson and Seinfeld, 1982; Matsumoto and Tanaka, 1996). As information about the full aerosol composition, necessary for the ap-plication of thermodynamic aerosol models, was not available, Kehad to be calculated for pure NH4Cl and NH4NO3 and might therefore be overestimated for h above the deliquescence point. The formulations of Ke applied here are, nevertheless, applicable to solid aerosol, which is usually found forh < 60%, even for mixed aerosols (Stelson and Seinfeld, 1982). The fact that low values of h coincided with some of the smallest values of Km(Fig. 8a,b), indicates that mod-ification of the thermodynamic equilibrium by SO42− cannot be the only reason for the observation ofKm< Ke. ForT >10◦C, Km (NH4NO3) increased with h, in contradiction to theory. One possible explanation is that, in the absence of local sources of NH4NO3, advected aerosol became increasingly depleted when the potential for volatilization was high (Ke large). The potential for NH4NO3 formation was limited to periods ofh >85%, in agreement with measurements at another Scottish site (Flechard and Fowler, 1998). Equilibrium was most closely attained forT <10◦C
supporting the conclusions of Harrison and Pio (1983). The surface exchange of the participating species is known to perturb the thermodynamic equilibrium. At 1 m Km for HCl was consistently below Ke. Be-cause of the emission of both HCl (Fig. 3) and NH3 (Sutton et al., 2000b), however, Kmfor NH4Cl tended to exceed Ke atz′0for h >85%, especially at higher T. Again bearing in mind the reducing effect of SO42− on Ke, there is even stronger indication that (at high h) NH4Cl was potentially produced within the canopy, whereas it ought to have evaporated above the canopy. As a consequence of the low acid gas concen-trations, the phase partitioning of total NHx was
shifted towards the gas phase, with median NH3 gas and NH4+ aerosol concentrations of 0.85 and 0.32mg N m−3, respectively. Coincidence factors (Ta-ble 1) were similar to those obtained by Wexler and Seinfeld (1992), with higher values of CSO
pH of the aerosol drops, the sulphate remains fixed by the smaller particles whereas the nitrate is forced to condense, together with NH3, onto bigger parti-cles or to react with sea salt (NaCl) also contained in larger particles (Matsumo and Tanaka, 1996). This process is more efficient at small τ∞. Consistently,
the coincidence of NH4+with SO42−increased with decreasing τ∞ (R = −0.93, N = 5, P < 0.05),
whileCNO3−was positively correlated withτ∞ (R=
−0.89, N = 5, P < 0.05), although the latter is in contradiction to the observations by Wexler and Seinfeld (1992). Clearly, at North Berwick τ∞
ac-cording to Eq. (3) was indeed a governing parameter for the ageing process of the aerosol and is likely to have controlled the formation of secondary aerosol.
Having established that at North Berwick depar-ture from equilibrium was often sufficiently large to drive GPIC, the magnitude of the effect on surface exchange fluxes depends critically on the time-scales at which they would have occurred. Because of the height-dependence of Km, it is necessary to discuss the potential of GPIC above and within the canopy separately.
4.5. Estimate of the potential effect of gas–particle interconversions on NH3flux measurements
As equilibrium was usually not attained above the canopy, kinetic constraints must have prevented the outgassing from the aerosol. The main kinetic constraint on both aerosol evaporation and vapour condensation was certainly imposed by the small con-centrations of particles and the resulting small surface area on which chemical interactions could take place. The characteristic times of the chemical conversion were estimated here to be ≫ 3 min, much longer than that of vertical transfer (Table 3). Gas–particle interactions are therefore unlikely to have affected the above-canopy gradient measurements of NH3 except for periods of very low friction velocities (u∗ < 0.03 m s−1), but during these conditions the application of the AGM is also very uncertain for other reasons. Because of the low turbulence, fluxes during these periods are small so that even large rela-tive errors have little effect on the long-term estimate of the net exchange. In contrast, Seidl et al. (1996) frequently found values forτ∞of about 1.5 min at a
heavily polluted site near Leipzig, Germany. At their
siteτ∞ was therefore often similar to the
character-istic time of the vertical transport, and the constant flux assumption was violated (Kins et al., 1996).
At North Berwick NH3 concentrations were large compared with concentrations of acid gases and aerosols. Consequently, GPIC would have had a rel-atively small effect on the NH3 flux, even if it had occurred. During the evaporation of NH4Cl, e.g. the amount of volatilized NH3 would have equalled that of HCl. A maximum of 25% of the observed NH3 emission flux would have been produced by this aerosol evaporation mechanism, assuming that (i) all HCl emission was caused by NH4Cl evaporation and (ii) at the surface HCl was deposited at Vmax. 4.6. Gas–particle interaction within the oilseed rape canopy
It can be concluded that at North Berwick the aero-dynamic gradient technique was applicable to mea-sure NH3surface fluxes as chemical time-scales were long compared with diffusive time-scales. However, if chemical transformations had taken place within the canopy air space, the measured flux, though valid, would not have represented the direct exchange with the canopy and ground, but would also have included these chemical transformations.
1 m. Thus, some condensation of NH4Cl might have occurred within the canopy, and the resulting emis-sion would explain the upward gradients of NH4+ (Table 2), whilst the Cl− emission would have been masked by the dominating sea salt deposition (cf. Section 3.2).
The Cl− aerosol at North Berwick showed a bi-modal distribution (not shown); the coarse mode typi-cally represents sea salt, while the fine mode represents NH4Cl. If this NH4Cl was formed within the canopy, the fine mode Cl− concentration (Rp < 0.23mm) should increase at high h whenKm> Ke. Indeed, de-spite the limited number of data points, a highly sig-nificant positive correlation was found between fine Cl− and h (R = 0.99, N = 5, P < 0.01) sup-porting the concept of NH4Cl formation within the canopy. Furthermore, the source/sink analysis showed the canopy to be a source of Cl− aerosol, probably originating from precursor gases, although it cannot represent NH4Cl alone (Section 4.3).
5. Conclusions
Despite difficulties associated with small air con-centrations a number of conclusions can be drawn re-garding the interactions of ammonia, acidic gases and aerosol species at North Berwick.
1. The concentration product of NH3and HNO3was in general below its thermodynamic value, espe-cially for low humidities, suggesting kinetic con-straints for aerosol evaporation and the absence of local sources of NH4NO3 and HNO3; the coexis-tence of SO42−appears to have a thermodynamic effect.
2. Gaseous Cl compounds were almost certainly emit-ted by the oilseed rape canopy for most of the time. Because of the low collection efficiency of the de-nuders, the production of CH3Cl, although reported to be high for Brassica species, can only explain the estimated emission if the emission was as large as 200–2000 ng Cl m−2s−1. The observed flux is therefore likely to have represented mainly HCl, which originated from decomposing leaves or from surface reactions.
3. As a result of the HCl emission, the dissociation constant of NH4Cl was exceeded within the canopy for high relative humidities leading to the potential
of aerosol formation. In contrast, it is predicted that above the canopy there was potential for NH4Cl evaporation.
4. The calculated particle deposition velocities were very variable but lay in the range of former measurements. The extended periods of NH4+ emission observed can be explained by particle formation within the canopy.
5. The small aerosol concentrations resulted in chem-ical time-scales for the evaporation or formation of NH4NO3 and NH4Cl that were much longer than those of diffusive transport above the canopy. Gas–particle interactions are therefore unlikely to have affected above-canopy gradient measurements of NH3. The findings indicate that the AGM is suf-ficiently applicable to NH3 flux measurements in environments with low particle concentrations such as Scotland without the need to correct for the ef-fects of GTPC/PTGC, even though gas concentra-tions might be poorly adjusted to their equilibrium values.
6. However, there is ample indication for formation of NH4Cl within the canopy, where the turbulence was low and residence times long. Hence, at North Berwick gradient techniques could correctly be ap-plied to calculate the fluxes of NH3, HCl, HNO3 and NH4+above the canopy, but the derived fluxes might include the chemical production or deple-tion within the canopy space in addideple-tion to foliar exchange.
7. More research is needed to address and quantify the effect of GTPC/PTGC within canopies, which is further complicated by complex turbulent struc-tures, effects of non-turbulent transport and the possibility of HCl emission.
8. For studies of phase equilibria the findings stress the importance to take into account both the full aerosol composition and the surface interactions of the different species.
Acknowledgements
Regions (contracts EPG 1/3/28 and 1/3/94) and the Dutch Ministry of Housing, Spatial Planning and the Environment. Thanks go to Mr. J. Grant-Suttie who provided access to the measuring site and to C. Milford and F. Harvey for their help in the field. Some of the filter-packs were kindly provided by the University of Nottingham, UK.
References
Allen, A.G., Harrison, R.M., Erisman, J.W., 1989. Field measurements of the dissociation of ammonium nitrate and ammonium chloride aerosols. Atmos. Environ. 23, 1591–1599. Andersen, H.V., Hovmand, M.F., 1994. Measurements of ammonia and ammonium by denuder and filter-pack. Atmos. Environ. 28, 2495–3512.
Brimblecombe, P., Clegg, S.L., 1990. Equilibrium partial pressures of strong acids over concentrated solutions. III. The temperature variation of HNO3 solubility. Atmos. Environ. A 24, 1945–
1955.
Brost, R.A., Delany, A.C., Huebert, B.J., 1988. Numerical modeling of concentrations and fluxes of HNO3, NH3 and
NH4NO3near the surface. J. Geophys. Res. 93, 7137–7152.
Clegg, S.L., Brimblecombe, P., 1985. Potential degassing of hydrogen chloride from acidified sodium chloride droplets. Atmos. Environ. 19, 465–470.
Dollard, G.J., Atkins, D.H.F., Davies, T.D., Healy, C., 1987. Concentrations and dry deposition velocities of nitric acid. Nature 326, 481–483.
Duyzer, J.H., 1994. Dry deposition of ammonia and ammonium aerosols over heathland. J. Geophys. Res. 99, 18757–18763. Erisman,
J.W., Vermetten, A.W.M., Asman, W.A.H., Waijers-Ijeplaan, A., Slanina, J., 1988. Vertical distribution of gases and aerosols: the behaviour of ammonia and related components in the lower atmosphere. Atmos. Environ. 22, 1153–1160.
Fells, I., Moelwyn-Hughes, E.A., 1959. The kinetics of the hydrolysis of the chlorinated methanes. J. Chem. Soc. 389–409. Ferm, M., 1979. Method for determination of atmospheric
ammonia. Atmos. Environ. 13, 1385–1393.
Flechard, C.R., Fowler, D., 1998. Atmospheric ammonia at a moorland site. II. Long-term surface/atmosphere micrometeorological flux measurements. Quart. J. Roy. Met. Soc. 124, 759–791.
Gallagher, M.W., Beswick, K.M., Duyzer, J., Westrate, H., Choularton, T.W., Hummelshøj, P., 1997a. Measurements of aerosol fluxes to Speulder Forest using a micrometeorological technique. Atmos. Environ. 31, 359–373.
Gallagher, M.W., Fontan, J., Wyers, P., Ruijgrok, W., Duyzer, J., Hummelshøj, P., Pilegaard, K., Fowler, D., 1997b. Atmospheric particles and their interactions with natural surfaces. In: Slanina, J. (Ed.), Biosphere–atmosphere Exchange of Pollutants and Trace Substances, Springer, Berlin. Transp. Chem. Transform. Pollut. Tropos. 4, 45–83.
Garland, J.A., 1977. The dry deposition of sulphur dioxide to land and water surfaces. Proc. Roy. Soc. Lond. A 354, 245–268. Harper, D.B., 1985. Halomethane from halide ion — a highly
efficient fungal conversion of environmental significance. Nature 315, 55–57.
Harrison, R.M., Pio, C.A., 1983. An investigation of atmospheric HNO3–NH3–NH4NO3 equilibrium relationships in a cool,
humid climate. Tellus B 35, 155–159.
Harrison, R.M., Rapsomanikis, S., Turnbull, A., 1989. Land-surface exchange in a chemically reactive system, surface fluxes of HNO3, HCl and NH3. Atmos. Environ. 23, 1795–
1800.
Hinds, W.C., 1982. Aerosol Technology. Wiley, New York, 424 pp. Huebert, B.J., Robert, C.H., 1985. The dry deposition of nitric
acid to grass. J. Geophys. Res. 90, 2085–2090.
Huebert, B.J., Luke, W.T., Delany, A.C., Brost, R.A., 1988. Measurements of concentrations and dry surfaces fluxes of atmospheric nitrates in the presence of ammonia. J. Geophys. Res. 93, 7127–7136.
Husted, S., Schjørring, J.K., Nielsen, K.H., Nemitz, E., Sutton, M.A., 2000. Stomatal compensation points for ammonia in oilseed rape plants under field conditions. Agric. For. Meteorol. 105, 371–383.
Katen, P.C., Hubbe, J.M., 1985. An evaluation of optical particle counter measurements of the dry deposition of atmospheric aerosol particles. J. Geophys. Res. 90, 2145–2160.
Keuken, M.P., Schoonebeek, C.A.M., Van Wensveen-Louter, A., Slanina, J., 1988. Simultaneous sampling of NH3, HNO3, HCl,
SO2and H2O2in ambient air by a wet annular denuder system.
Atmos. Environ. 22, 2541–2548.
Khlystov, A., Wyers, G.P., Slanina, J., 1995. The steam-jet aerosol collector. Atmos. Environ. 29 (17), 2229–2234.
Kins, L., Seidl, W., Schween, J., Dlugi, R., 1996. The chemical behaviour and deposition of ammonia, ammonium nitrate and nitric acid. In: Sutton, M.A., Lee, D.S., Dollard, G.J., Fowler, D. (Eds.), Poster Proceedings of Atmospheric Ammonia: Emission, Deposition and Environmental Impacts, Oxford, 1995. Kramm, G., Dlugi, R., 1994. Modelling of the vertical fluxes of
nitric acid, ammonia and ammonium nitrate. J. Atmos. Chem. 18, 319–357.
Matsumoto, K., Tanaka, H., 1996. Formation and dissociation of atmospheric particulate nitrate and chloride: an approach based on phase equilibrium. Atmos. Environ. 30, 639–648. Meng, Z., Seinfeld, J.H., 1996. Time scales to achieve atmospheric
gas–aerosol equilibrium for volatile species. Atmos. Environ. 30, 2889–2900.
Mozurkewich, M., 1993. The dissociation constant of ammonium nitrate and its dependence on temperature, relative humidity and particle size. Atmos. Environ. A 27, 261–270.
Müller, H., Kramm, G., Meixner, F.X., Dollard, G.J., Fowler, D., Possanzini, M., 1993. Determination of HNO3 dry deposition
by modified Bowen ratio and aerodynamic profile techniques. Tellus B 45, 346–367.
Neftel, A., Blatter, A., Hesterberg, R., Staffelbach, T., 1996. Measurements of concentration gradients of HNO2 and HNO3
measurement data. In: Sutton, M.A., Lee, D.S., Dollard, G.J., Fowler, D. (Eds.), Poster Proceedings of Atmospheric Ammonia: Emission, Deposition and Environmental Impacts, Oxford, 1995.
Nemitz, E., Sutton, M.A., Gut, A., San José, R., Husted, S., Schjoerring, J.K., 2000a. Sources and sinks of ammonia within an oilseed rape canopy. Agric. For. Meteorol. 105, 385–404. Nemitz, E., Sutton, M.A., Schjoerring, J.K., Husted, S., Wyers,
G.P., 2000b. Resistance modelling of ammonia exchange above oilseed rape. Agric. For. Meteorol. 105, 405–425.
Pio, C.A., Harrison, R.M., 1987. Vapour pressure of ammonium chloride aerosol: effect of temperature and humidity. Atmos. Environ. 21, 2711–2715.
Raupach, M.R., 1989. Applying Lagrangian fluid mechanics to infer scalar source distributions from concentration profiles in plant canopies. Agric. For. Meteorol. 47, 85–108.
Rossi, M.J., Fenter, F.F., Tabor, K., Caloz, F., Gutzwiller, L., 1995. Heterogeneous reactions of nitrogen oxides, NO2, N2O5,
HNO3, ClONO2 with surfaces representative of atmospheric
aerosol. In: Warneck, P. (Ed.), Transport and Chemical Transformation of Pollutants in the Troposphere: Heterogeneous and Liquid-phase Processes. Springer, Berlin, 254 pp. Saini, H.S., Attieh, J.M., Hanson, A.D., 1995. Biosynthesis of
halomethanes and methanethiol by higher plants via a novel methyltransferase reaction. Plant Cell Environ. 18, 1027–1033. Seidl, W., Brunnemann, G., Kins, L., Köhler, E., Reusswig, K., Dlugi, R., 1996. On the ionic composition of aerosol particles and related gas phase species at two sites during the SANA 2 campaign. Meteorol. Z., N.F. 5, 257–268.
Stelson, A.W., Seinfeld, J.H., 1982. Thermodynamic prediction of the water activity, NH4NO3 dissociation constant, density and
refractive index for the NH4NO3–(NH4)2SO4–H2O system at
25◦C. Atmos. Environ. 16, 2507–2514.
Sutton, M.A., Pitcairn, C.E.R., Fowler, D., 1993a. The exchange of ammonia between the atmosphere and plant communities. Adv. Ecol. Res. 24, 301–398.
Sutton, M.A., Fowler, D., Hargreaves, K.J., Storeton-West, R.L., 1993b. Interactions of NH3 and SO2 exchange inferred from
simultaneous flux measurements over a wheat canopy. In: Slanina, J., Angeletti, G., Beilke, S. (Eds.), General Assessment of Biogenic Emissions and Deposition of Nitrogen Compounds, Sulphur Compounds and Oxidants in Europe, Proceedings of the Joint EC/BIATEX Workshop, Aveiro, May 1993. Air Pollution Research Report, EC, Brussles, Vol. 45, pp. 165–182.
Sutton, M.A., Wyers, G.P., Meixner, F.X., Schjørring, J.K., Kesselmeier, J., Kramm, G., Duyzer, J.H., 1997. Biosphere-atmosphere exchange of ammonia. In: Slanina, S. (Ed.), Transport Chemical Transform, Springer, Heidelberg. Pollut. Tropos. 4, 15–44.
Sutton, M.A., Nemitz, E., Fowler, D., Wyers, G.P., Otjes, R.P., Schjoerring, J.K., Husted, S., Nielsen, K.H., San José, R., Moreno, J., Gallagher, M.W., Gut, A., 2000a. Fluxes of ammonia over oilseed rape: overview of the EXAMINE experiment. Agric. For. Meteorol., 105, 327–349.
Sutton, M.A., Nemitz, E., Milford, C., Fowler, D., Moreno, J., San Jose, R., Wyers, G.P., Otjes, R.P., Harrison, R., Husted, S., Schjoerring, J.K., 2000b. Micrometeorological measurements of net ammonia fluxes over oilseed rape during two vegetation periods. Agric. For. Meteorol. 105, 351–369.
Van Oss, R., Duyzer, J., Wyers, P., 1998. The influence of gas to particle conversions on measurements of ammonia deposition. Atmos. Environ. 32, 465–471.
Wesley, M.L., Cook, D.R., Hart, R.L., Speer, R.E., 1985. Measurements and parameterization of particulate sulfur dry deposition over grass. J. Geophys. Res. 90, 2131–2143. Wexler, A.S., Seinfeld, J.H., 1990. The distribution of ammonium
salts among a size and composition dispersed aerosol. Atmos. Environ. A 24, 1231–1246.
Wexler, A.S., Seinfeld, J.H., 1992. Analysis of aerosol ammonium nitrate departures from equilibrium during SCAQS. Atmos. Environ. A 26, 579–591.
Wyers, G.P., Otjes, R.P., Slanina, J., 1993. A continuous-flow denuder for the measurement of ambient concentrations and surface-exchange fluxes of ammonia. Atmos. Environ. A 27 (13), 2085–2090.
Yamulki, S., Harrison, R.M., Goulding, K.W.T., 1996. Ammonia surface-exchange above an agricultural field in southeast England. Atmos. Environ. 30, 109–118.
Zhang, Y., Ten Brink, H., Slanina, S., Wyers, P., 1995. The influence of ammonium nitrate equilibrium on the measurement of exchange fluxes of ammonia and nitric acid. In: Heij, G.J., Erismann, J.-W. (Eds.), Acid Rain Research: Do We Have Enough Answers? Elsevier, Amsterdam, NL.