APPLICATION OF REMOTE SENSING AND GIS IN LAND USE/LAND COVER
MAPPING AND CHANGE DETECTION IN SHASHA FOREST RESERVE, NIGERIA
O.S. Olokeoguna, *, O.F. Iyiolab, K. Iyiolac a
Federal College of Forestry, Forestry Technology Department, Nigeria –[email protected] b
Federal School of Surveying, Surveying and Geoinformatics Department, Nigeria c
Sustainabilities Limited, Nigeria- [email protected]
Commission VIII, WG VI/4
KEY WORDS: Remote sensing, GIS techniques, LULC, change detection, forest ecosystem
ABSTRACT:
Mapping of LULC and change detection using remote sensing and GIS techniques is a cost effective method of obtaining a clear understanding of the land cover alteration processes due to land use change and their consequences. This research focused on assessing landscape transformation in Shasha Forest Reserve, over an 18 year period. LANDSAT Satellite imageries (of 30m resolution) covering the area at two epochs were characterized into five classes (Water Body, Forest Reserve, Built up Area, Vegetation, and Farmland) and classification performs with maximum likelihood algorithm, which resulted in the classes of each land use.
The result of the comparison of the two classified images showed that vegetation (degraded forest) has increased by 30.96%, farmland cover increased by 22.82% and built up area by 3.09%. Forest reserve however, has decreased significantly by 46.12% during the period.
This research highlights the increasing rate of modification of forest ecosystem by anthropogebic activities and the need to apprehend the situation to ensure sustainable forest management.
1. INTRODUCTION
Land use/land cover change is a key driver of global change (Vitousek, 1992) and has significant implications for many international policy issues (Nunes and Auge, 1999). In particular, land use/land cover (LULC) changes in the tropical regions are of major concern due to the widespread and rapid changes in the distribution and characteristics of tropical forests (Myers, 1993) and (Houghton, 1994). Changes in land cover and in the way people use the land has become recognized over the last 15 years as important global environmental changes in their own right (Turner, 2002).
Forest clearing has been identified as one of the most significant causes of deforestation in different parts of the world. Detailed scientific studies illustrate the apparent effect of farming activities resulting in modification of the original vegetation. The rate of deforestation is alarming in West Africa due to rapid population growth and land use (Myers, 1988). For example, recent estimates indicate that over 350,000ha of forest and natural vegetation are being lost annually due to farming (NEST, 1991).
Ola Adams (1996) also lamented over 11,300 hectares of forest being cleared annually in Omo Forest Reserve in Nigeria for the establishment of monoculture plantation of indigenous and exotic tree species. These evidences present a significant and direct role of forest clearing for farming in forest loss. It has been established that the highest rates of forest modification have occurred in areas with heavy dependence on forest land for subsistence and shifting agriculture largely found in developing countries. (Allen and Barnes, 1985a).
To understand how LULC change affects and interact with global earth systems, information is needed on what changes occur, where and when they occur, the rate at which they occur, and the social and physical forces that drive those changes (Lambin, 1997a). The information needs for such a synthesis are diverse. Remote sensing has an important contribution to making and documenting the actual change in land use/land cover in regional and global scales.
In Nigeria, despite ongoing research efforts on LULC patterns; there remains a need for development of basic datasets providing quantitative and spatial land use/land cover information. In many states of Nigeria, relatively little natural vegetation remains untouched by human hands. Rates of forest loss are accelerating due to subsistence agriculture and shifting cultivation. Already forest plantation establishment, bush burning, shifting cultivation and other development features have occurred in the reserve resulting in loss of biodiversity. The global drive towards sustainable environments provides critical need for studies on land use/land cover change within forest vegetation to provide useful information to planners and resource managers.
Moreover, there appears to be a gap in the available information and national decision-making process and rational planning. Therefore this paper seek to investigate (i.e. map out), identify and quantify the changes in LULC over the years within Shasha Forest Reserve in Osun State, Nigeria using remote sensing and GIS technologies thus ascertaining the deriving factors behind these changes and to model/predict possible future changes.
Geographic Information System (GIS) is an information technology that has been used in public policy-making for environmental and forest planning and decision-making over
The International Archives of the Photogrammetry, Remote Sensing and Spatial Information Sciences, Volume XL-8, 2014 ISPRS Technical Commission VIII Symposium, 09 – 12 December 2014, Hyderabad, India
This contribution has been peer-reviewed.
the past two decades (Bassole et al, 2001). GIS and related technologies provide foresters with powerful tools for record keeping, analysis and decision making.
2. METHODOLOGY
2.1 The study area
Shasha Forest Reserve is located in Ife South Local Government Area of Osun State, Nigeria and occupies a total land area of 31, 541Ha. The forest is situated between latitude 60 50N to 70 80N and longitude 40 10E to 40 45E. The reserve was first gazette in 1925 as part of the old Shasha Forest Reserve under an agreement with the Ijebu Native Authority. The reserve shares boundaries with Omo Forest Reserve on the west. The northern and eastern boundaries are with Ife Forest Reserve and Oluwa Forest Reserve in Osun state and Ondo state respectively. The reserve is subdivided into two major Areas 4 and 5. There are about forty communities within and around the forest reserve. The population of these communities range from 200 to 2000 inhabitants.
Shasha Forest Reserve is in the lowland rain forest of South-Western Nigeria. The annual rainfall ranges from 890mm to 2200mm. The rainy season in Shasha Forest Reserve commences from March/April and lasts till November. The average relative humidity is 70% while the mean monthly temperature is 280C. There are two main seasons in the year, a dry season with dry northeast trade wind-harmattan predominantly from November to March, and a rainy season characterized by the South-west monsoon wind bringing rains from April to October.
The topography of the study area is generally undulating, lying at altitude between 90m and 140m above sea level. The vegetation is mainly a high forest type. The soil of the area were formed from rocks of pre-cambrian basement complex formation particularly granites, gneisses, quartz-schist, biotite gneisses and schist. They were formed under moist semi-deciduous forest cover and belong to the major soil group called ferruginous tropical soil.
Figure 1. Location of the Study Area
2.2 Data Source
Secondary data source were used and these includes;
A boundary map of Shasha Forest Reserve with scale 1:350, 000, sourced from FORMECU, Ibadan. The LANDSAT 1986 and 2004 satellite images of the
study area at 30m resolution sourced from Aerial View Solutions Limited, Ibadan.
2.3 Data Conversion
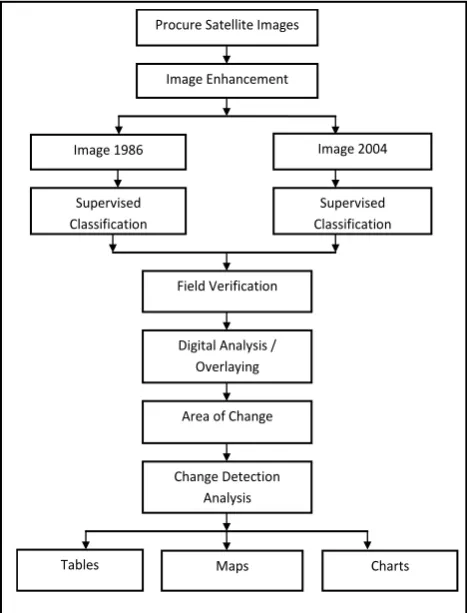
The satellite image of the study area was classified using ERDAS Imagine. The existing analogue boundary map was converted into digital format through digitizing using ArcGIS 9.3 application software. The step by step approach (methodology) taken to achieve the stated objectives of this project are the following;
Figure 2. Flow Chart of the Research Methodology
2.4 Database Creation
The database was created using ArcGIS 9.3 software, the data set acquired (spatial and non-spatial attributes) were used in creating the database.
3. SPATIAL ANALYSIS AND INFORMATION PRESENTATION
3.1 Land Use Mapping and Distribution
A supervised (full Gaussian) maximum likelihood classification was implemented for the two images and the final classification products provide an overview of the major land use / land cover features of Shasha Forest Reserve for the years 1986 and 2004. Five categories of land use / land cover (LULC) were identified; these are:
NIGERIA OSUN STATE
SHASHA FR IFE SOUTH L.G
Procure Satellite Images
Image Enhancement
Image 1986 Image 2004
Supervised Classification
Supervised Classification
Field Verification
Digital Analysis / Overlaying
Area of Change
Change Detection Analysis
Tables Maps Charts
The International Archives of the Photogrammetry, Remote Sensing and Spatial Information Sciences, Volume XL-8, 2014 ISPRS Technical Commission VIII Symposium, 09 – 12 December 2014, Hyderabad, India
This contribution has been peer-reviewed.
Water Body Forest Reserve Built up Area Vegetation and Farmland
Figures 3 and 4 illustrate the land use / land cover maps of Shasha Forest Reserve for the year 1986 and 2004.
Figure 3. LULC Classification of Shasha FR (1986)
Figure 4. LULC Classification of Shasha FR (2004)
The 1986 and 2004 land use /land cover practice in the depleting Shasha Forest Reserve were determined in order to ascertain the causes of deforestation. Five major classes were identified and classified as the land use/cover of all the five images as follows: water body, forest reserve, built up area, vegetation and farmland.
However, amongst these five major classes, three classes were identified as land use practices that are heavily depleting the reserve; they are farmland, built up area (i.e. settlements) and degraded forest which is called vegetation in this study. Figures 3-4 illustrate this respectively.
1986 2004
Land Cover Type
Area (Ha)
Area (%)
Area (Ha)
Area (%) Water Body 6733.55 11.04 111.87 0.18 Forest
Reserve
38644.5 63.36 10507.3 17.24
Built up Area 1664.38 2.73 3548.43 5.82 Vegetation 13336.7 21.87 32200.3 52.83 Farmland 611.381 1.00 14577.3 23.82
Table 1. LULC Distribution 1986, 2004
Table 1 shows the spatial extent of the land cover in hectares and in percentages. Water body area with the largest land cover of 6733.55 Ha (in 1986) and was observed to have reduced to 111.87 Ha in the year 2004. Also Forest reserved area which covers 38644.5 Ha in 1986, reduced to 10507.3 Ha in the year 2004. Built up area (with 1664.38 Ha), Vegetation (with 13336.7 Ha) and Farmland (with 611.381 Ha) in 1986 increased to 3548.43 Ha, 32200.3 Ha and 14577.3 Ha respectively.
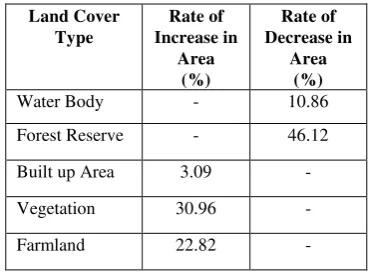
Land Cover Type
Rate of Increase in
Area (%)
Rate of Decrease in
Area (%)
Water Body - 10.86
Forest Reserve - 46.12 Built up Area 3.09 - Vegetation 30.96 -
Farmland 22.82 -
Table 2. Rate of Increase/Decrease of LULC Changes (1986-2004)
Table 2 shows the percentage range of land cover, 1986 – 2004. It was observed that there was a large decrease in size of both water body and forest reserve area by 10.86% and 46.12% respectively. While Built up area, Vegetation area and Farmland area tremendously increase by 3.09%, 30.96% and 22.82% respectively. So many buildings were constructed in the reserve; at the same period of time, farming activities was on the increase and vegetation size also increases as well.
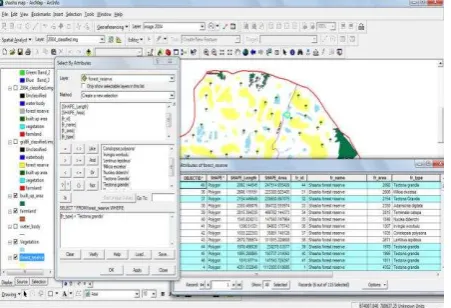
3.2 Database Query
Decision making requires information generated from spatial search and necessary operations performed. The database and graphics were manipulated and processed to generate information about the entities (spatial features) for GIS analysis. Data were retrieved from the database i.e. graphics and tabular data using ArcGIS 9.2. GIS analysis helps to ascertain the fitness of the database.
Figure 5. Query for Built-up Area.
The International Archives of the Photogrammetry, Remote Sensing and Spatial Information Sciences, Volume XL-8, 2014 ISPRS Technical Commission VIII Symposium, 09 – 12 December 2014, Hyderabad, India
This contribution has been peer-reviewed.
Figure 6. Query for Farmlands with Maize Cultivation
Figure 7. Query for Forest Type (Tectona grandis) in Shasha F.R
4. CONCLUSION AND RECOMMENDATION
4.1 Conclusion
The application of Remote Sensing and Geographic Information System in forest resource management through the identification, classification, assessment and interpretation of different land use and land cover classes has been amply demonstrated.
The study has revealed that remotely sensed data (imageries) are important and extremely useful in mapping and monitoring the dynamics of land use / land cover in tropical rain forest. GIS analysis has shown the capabilities of GIS to solving spatial problems and to providing information that aid decision making.
4.2 Recommendation
Settlement expansion, subsistence farming and illegal logging are the major factors behind the land use / land cover changes observed in the area. This finding highlights the need for comprehensive assessment of human activities and adaptation of sustainable forest management practices such as close supervision of forest reserves and making more arable lands available through restoration of already degraded and impoverished lands.
Also, the source of data is costly for individuals and academic institutions. I will recommend complete adoption of data sharing in line with Open Geospatial Consortium (OGC) resolution. It will be immensely valuable if government institutions that are privileged to possess both digital and hardcopy image to share with academic and research institutions for non-profit research purposes.
REFERENCES
Allen, J. C., Barnes, D. F., 1985a. The Causes of Deforestation in Developing Countries, Annals of Association of American Geographers, 75, 163-184.
Bassole, A., Brunner, J., and Tunstall, D., 2001: “GIS: Supporting Environmental Planning and Management in West Africa.” World Resources Institute, London. Houghton, R.A., 1994. The Worldwide Extent of Land Use
Change. BioScience 44: 305 – 313.
Lambin, E. F., 1997a. Modelling and Monitoring Land-Cover Change Processes in Tropical Regions. Progress in Physical Geography. 21, 375-393.
Meyer, W. B., 1993. Past and Present Use and Land-Cover in the U.S.A: Consequences pp. 24-33. Myers, N., 1988a. Tropical Deforestation and Remote Sensing,
Forest Ecology and Management, 23, 215-225. Nigerian Environmental Study/Action Team, (NEST) 1991. The
challenges of Sustainable Development in Nigeria, T. Nest Ibadan, 1, 6-12.
Nunes, C., Auge J.I., 1999. Land-Use and Land-Cover Implementation Strategy (Stockholm: IGBP). Ola Adams, B. A., 1996. Conservation and Management of
Biodiversity, In: Biosphere Reserves for Biodiversity Conservation and Sustainable Development in Anglophone Africa (BRAAF): Assessment and Monitoring Techniques in Nigeria, Ola-Adams B. A, L. O. (eds).
Vitousek, P.M., 1992. Global Environmental Change: An introduction. Ann. Rev. Ecol. Syst. 23: 1-14.
The International Archives of the Photogrammetry, Remote Sensing and Spatial Information Sciences, Volume XL-8, 2014 ISPRS Technical Commission VIII Symposium, 09 – 12 December 2014, Hyderabad, India
This contribution has been peer-reviewed.