EVALUATING FINANCIAL PERFORMANCE OF PT. PLAZA
INDONESIA REALTY TBK
MENGEVALUASI KINERJA KEUANGAN PADA PT. PLAZA INDONESIA REALTY
TBK
I Dewa Ayu Raka Sriratna
International Business Administration (IBA), Management Program,
Faculty of Economics and Business, Sam Ratulangi University, Manado 95115, Indonesia Email: [email protected]
ABSTRACK
The financial performance of company can be seen by the financial statements. By the financial statement of company, it can be the informationand helped the investor to analyze the company financial position and also for the top management of the company to make a business decision. This research aims to find out the financial performance of PT. Plaza Indonesia Realty Tbk by using financial ratio and DuPont analysis. The type of this research is quantitative descriptive research and the data were gathered from financial statements of PT. Plaza Indonesia Realty Tbk from 2011 to 2015. Based on the result of data analyzed, PT. Plaza Indonesia Realty Tbk has good financial performance. It can be seen by the ratio that above than the standard ratio. Based on the value of the ratio, PT. Plaza Indonesia Realty Tbk reached its best financial performance in 2014. It can be seen from the value of all financial ratios from 2011 - 2015.
Keywords: Financial Ratio, DuPont Analysis, Financial Performance
ABSTRAK
Kinerja keuangan perusahaan dapat dilihat dari laporan keuangan. Dengan adanya laporan keuangan perusahaan, itu akan menjadi sebuah informasi dan membantu investor untuk menganalisa kondisi keuangan perusahaan dan juga berguna untuk manajemen perusahaan dalam mengambil keputusan. Penelitian ini bertujuan untuk mengetahui kinerja keuangan dari PT. Plaza Indonesia Realty Tbk berdasarkan rasio keuangan dan analisa DuPont. Jenis penelitian ini adalah penelitian deskriptif kuantitatif dan data di kumpulkan dari laporan keuangan PT. Plaza Indonesia Realty Tbk dari tahun 2011 sampai 2015. Berdasdarkan hasil dari data analisis, PT. Plaza Indonesia Realty Tbk memiliki kinerja keuangan yang baik. Hal ini dapat dilihat dari hasil rasio yang berada di atas standar rasio. Berdasarkan nilai rasio, PT. Plaza Indonesia Realty Tbk mencapai kinerja keuangan terbaik pada tahun 2014. Hal ini dapat dilihat dari nilai semua rasio keuangan.
1. INTRODUCTION
Research Background
The rivalry in business environment among the competing firms makes company becomes better to retain and develop its business life. One of the important parts of company is the financial section and companies that have a competitive advantage that can survive.
Finance is an important field of company in a large or small scale company will have a very big attention in finance, especially in the development of the business world that is increasingly going forward. It leads a firm competition between companies more strictly and demanding company to make company be more efficient in its operation and can improve the ability of competing continuously for the survival company.
Company should examine and analyze the performance of company in order to keep survive. It may continuously analysis its financial performance which reflected in its financial statements. The analysis of the financial statement of a company because the company want to know the level of profitability, the level of risk and the level of health of a company. The analysis of the financial statements is also important to know the strengths and weaknesses of a company.
Financial ratio is used to compare the financial performance from year to year which assists in predicting the future. Analysis of financial performance mainly by using financial ratios is to assist companies in the development of policy or make decisions for the future to create a result of the improved financial performance of company.
Because of the conducive economic conditions and strong market confidence, Indonesia’s retail sector in 2011 showed encouraging growth, and this led to the growing need for retail space. Any shopping mall embracing retailers with a lifestyle and entertainment concept is increasingly attractive, naturally suiting those people who make shopping in the mall a pleasurable recreational activity. For example is PT Plaza Indonesia Realty Tbk, this company formerly known as PT Bimantara Eka Santosa, is an Indonesian property and real estate company that is primarily engaged in hotel business, shopping center rental, office space and apartments. PT. Plaza Indonesia Realty Tbk recorded a good achievement in financial section and it can be seen by the financial statement of company. Table 1.1 showed the total assets, revenue and net income of PT. Plaza Indonesia Realty Tbk from 2011 to 2015.
Table 1
Total Assets, Revenue, and Operating Income of PT. Plaza Indonesia Realty Tbk from 2011 -2015
Year Total Assets Revenue Operating Income
2011 4.232.841.288 909.589.677 188.828.860
2012 3.950.266.763 1.709.975.626 447.320.747
2013 4.126.804.890 1.393.191.548 416.833.742
2014 4.544.932.176 1.521.681.297 503.221.362
2015 4.671.089.985 1.644.546.338 549.076.830
Source: financial statements of PT. Plaza Indonesia Realty Tbk
Research Objective
To know the financial performance of PT. Plaza Indonesia Realty Tbk measured by financial ratio and DuPont analysis.
Theoretical Framework
Financial Management
According to Keown, Marthin, Petty, & Scott Jr (2005;p4), financial management is concerned with the maintenance and creation of economics value or wealth. Financial management means the management and control of money and money-related operations within a business (Lasher, 2010:6)
Financial Performance
Financial performance is related to firm’s ability to generate profit or income.It is often used as a general measure of business results; how well company doing its business activities. It can also be used to compare among companies within an industry. There is a wide range of financial performance measures. However, financial performance is basically divided into three general categories: investor returns, accounting returns and perceptual (Cochran &Wood, 1984; Orlitzky, Schmidt, &Rynes, 2003).
Financial Statement
According to Keown, Marthin, Petty, & Scott Jr (2005; p.38), financial Statement are the primary of information used by investor and creditors for making investment decision.
Financial Ratio Analysis
Financial ratio analysis is defined by Lasher (2010:80) as a general technique based on some relatively standard methods used to analyze information, and developed by people who make judgments about businesses by reading their financial statement.
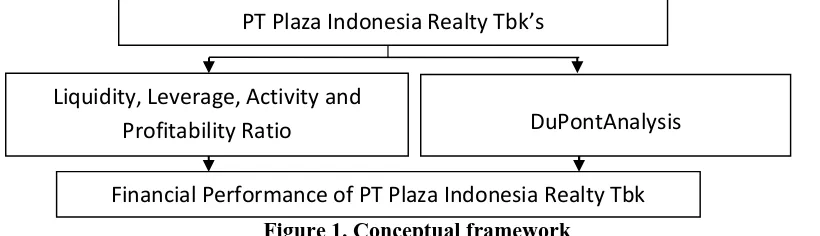
Conceptual Framework
The conceptual framework which the researcher needs to collect the financial statements of PT. Plaza Indonesia Realty Tbk year 2011-2015 and then using the financial ratio and DuPont system to measure the financial performance of PT. Plaza Indonesia Realty Tbk.
Figure 1. Conceptual framework Source: Previous research, 2016
Financial Performance of PT Plaza Indonesia Realty Tbk
Year 2011-2015
DuPontAnalysis
Liquidity, Leverage, Activity and
Profitability Ratio
2. RESEARCH METHOD
Types of research
This research uses descriptive type of research.
Place and Time
The research conducted in Manado from June to September 2016.
Research Procedure
The data will be analyzed with financial ratios and DuPont analysis. Based on the explanation, can further be describe as follow
Population and Sample
The population of this research is the financial statements of PT. Plaza Indonesia Realty Tbk. The sample of this research is consisting of last 5 years financial statements of PT. Plaza Indonesia Realty Tbk from 2011 to 2015. The sampling method is purposive sampling. The purposive sampling was applied in this research regarding to obtain information according to criteria.
Data Analysis Method 1. Liquidity Ratio
These ratios are used to indicate the ability of the company to meets its financialobligations as they fall due. There are 2 formulas of liquidity ratio as follow:
a. Current ratio used to evaluate the liquidity, or ability to meet short term debts.
=
b. Quick (acid-test) ratio is used to indicate the firm’s liquidity, as measured by its liquid assets excluding inventories, relatives to its current liabilities.
=
2. Leverage Ratio
These ratios used to determine about the companies' financing methods, or the ability to meet the obligations. There are 2 formulas of leverage ratio such as:
a. Debt to total equity ratio is the percentage of debt relative to the amount of equity of the firm.
=
b. Debt to total assets ratio is the ratio indicating the percentage of total assets of the company financed from debt.
=
3. Activity Ratio
These are ratios that measure the extent to whichcompany’s resources and assets have been efficiently managed. This ratio is helpful to understand the performance of the business concern. There are two formulas in activity ratio such as:
171%
119% 110%
186% 167% 169%
117% 108%
184% 165%
2011 2012 2013 2014 2015
Current Ratio Quick Ratio
=
b. Total Asset Turnover ratio is an asset management ratio that measures how efficiently a company can use its assets to generate sales.
=
4. Profitability ratio
This ratio measured the indicate how well a firm is performing in terms of its ability to generate profit. There are 3 formulas of profitability ratio such as:
a. Gross profit margin measures how much profits remains out of each sales rupiah after the cost of goods sold is subtracted.
=
b. Operating profit margin measures the comparison between the company operating profit compared with the sale of the company. It represents the pure profit earned.
=
c. Net profit margin is the ratio or comparison of net income that has been achieved in the period.
=
5. DuPont Analysis
The DuPont system analysis is used to dissect the firm’s financial statement and to assess its financial condition. There are 2 formulas that will be used which are:
a. Return on asset measures the overall effectiveness of management in generating profits with available assets.
=
b. Return on equity is the ratio between net income and equity. It measures the return earned on the owner’s investment in the firm.
=
3. RESULT AND DISCUSSION
1.
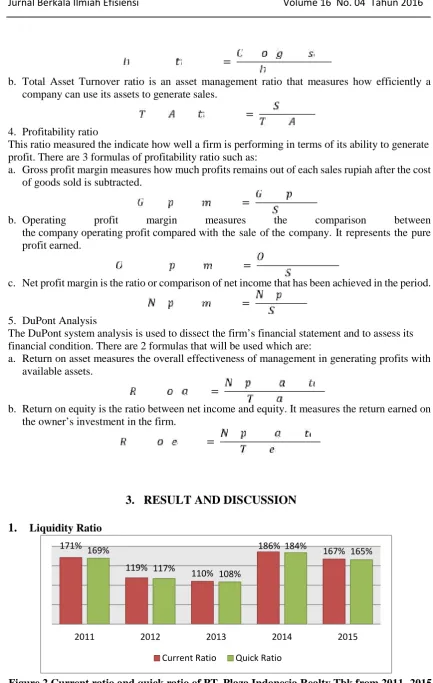
Liquidity RatioFigure 2.Current ratio and quick ratio of PT. Plaza Indonesia Realty Tbk from 2011- 2015 Source: Data Processed, 2016
20% 24% 26% 27% 26% 37% 43%
50% 52% 51%
0% 20% 40% 60%
2011 2012 2013 2014 2015 Debt to Total Asset Debt to Total Equity
Figure 2 shows the current ratio of PT. Plaza Indonesia Realty Tbk for five years from 2011 until 2015. In 2012, 2013, and 2015 the current ratio decreased because the current liabilities are increased. The increasing of current liabilities because company has a long-term bank debt due within one year. For year 2011 and 2014, the current ratio of PT. Plaza Indonesia Realty Tbk is increased because the current liabilities decreased.
b. Quick Ratio
Figure 2 shows the quick ratio of PT. Plaza Indonesia Realty Tbk for last five years. In year 2012, 2013, and 2015 the ratio experienced a decreasing. This ratio decreased because the total of current liabilities is increased. In 2014 become the highest quick ratio of PT. Plaza Indonesia Realty Tbk which means the ability of company to pay the current liabilities increased.
2. Leverage Ratio
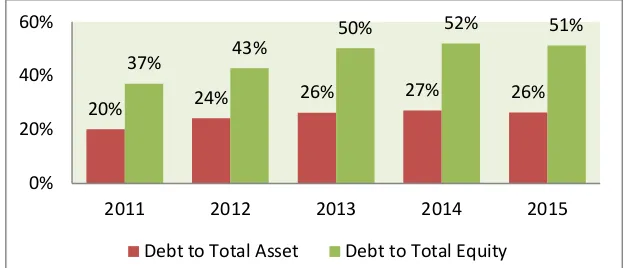
These ratios used to determine about the companies' financing methods, or the ability to meet the obligations. Figures 2 show the total of two ratios which is debt to total assets and debt to total equity.
Figure 3. Debt to Total Equity and Debt to Total Assets of PT. Plaza Indonesia from 2011– 2015
Source: Data Processed, 2016
a. Debt to Total Equity
Figure 3 shows the graphic of debt to total equity of PT. Plaza Indonesia Realty Tbk from 2011 to 2015. From year 2011 to 2014, the ratio is increasing because the total debt of company is increased per each year. In 2015, the ratio is decreased by 1% because the total debt of company decreased. For the last five years of PT. Plaza Indonesia Realty Tbk shows the highest of total ratio is in year 2014.
b. Debt to Total Asset
Based on figure 3, it shows the total of debt to total asset ratio of PT. Plaza Indonesia Realty Tbk from 2011 to 2015. The total of debt to total assets ratio in 2011 to 2014 is keep increasing because the total debt is increased. In year 2015, the ratio decreased 1% because the total debt of company is decreased.
64.16
94.15
52.27 44.60 43.61
0.21 0.43 0.34 0.33 0.35
0.00 20.00 40.00 60.00 80.00 100.00
2011 2012 2013 2014 2015
Inventory Turnover Total Assets Turnover
54% 47% 59% 62% 63%
21%9% 26%14% 30% 33% 33%
2% 24% 17%
2011 2012 2013 2014 2015
Gross Profit Margin Operating Profit Margin Net Profit Margin
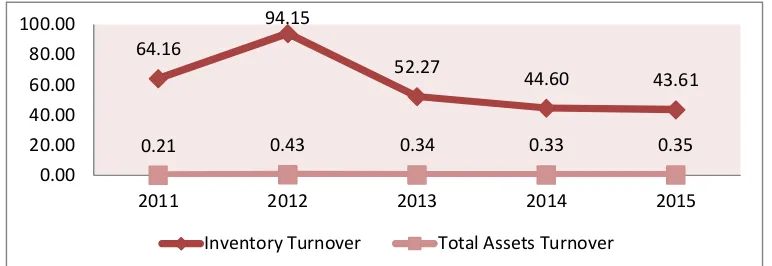
These are ratios that measure the extent to which company’s resources and assets have been efficiently managed. This ratio is helpful to understand the performance of the business concern. We can see the growth of activity ratio based on figures inventory turnover and total assets turnover below. Figure 3 shows the inventory turnover and total assets turnover of PT. Plaza Indonesia Realty Tbk from 2011 to 2015.
Figure 4. Inventory Turnover and Total Assets Turnover of PT. Plaza Indonesia Realty Tbk from 2011–2015
Source: Data Processed, 2016 a. Inventory Turnover
Figure 4 shows the total of inventory turnover of PT. Plaza Indonesia Realty Tbk from 2011 to 2015. From 2011 to 2012, the ratio is increase more than 30% because the inventory turnover is fast and sales increased. In 2013 to 2015, the inventory turnover is decline per each year. The decline occurred because inventory turnover is low.
b. Total Asset Turnover
Figure 4 shows the total asset turnover of PT. Plaza Indonesia Realty Tbk from 2011 to 2015. In 2011 to 2012, the total asset turnover is increased because the total sales increased. From year 2013 to 2014 the ratio decreased because the total sales are decreased and total assets increased. In 2015, the ratio is increased because the total sales and total assets are increased.
4. Profitability Ratio
Profitability ratio is used to indicate how well a firm is performing in terms of its ability to generate profit or measure the income of an enterprise for a given period of the time.
Figure 5. Gross Profit Margin, Operating Profit Margin, Net Profit Margin of PT. Plaza Indonesia Realty Tbk from 2011–2015
2% 6% 1%
Return On Asset Return On Equity a. Gross Profit Margin
Figure 5 shows the gross profit margin of PT. Plaza Indonesia Realty Tbk from 2011 until 2015. From 2011 to 2012, the gross profit margin is decreased because the total sales is increased and it make the company ability to gain gross profit is decreased. Although the total sales increased from 2013 to 2015, it does not make PT. Plaza Indonesia Realty Tbk’s ability to generate the gross profit decreased.
b. Operating Profit Margin
Figure 5 shows the total of operating profit margin of PT. Plaza Indonesia Realty Tbk from 2011 to 2015. The ratio from 2011 to 2014 is increased because the total of operating income and total sales are increased. In 2015, the ratio is still at 33% because the increasing of total sales and operating income are not really significant.
c. Net Profit Margin
Figure 5 shows the net profit margin of PT. Plaza Indonesia Realty Tbk from 2011 to 2015. In 2011 to 2012 the net profit margin increased because the net profit and total sales are increased. From 2012 to 2013 the total of net profit margin decreased because the net profit and total sales decreased. In year 2014, the total net profit margin of PT. Plaza Indonesia Realty Tbk’s increased significantly because the net income of company increased. In year 2015, the net profit margin decreased because the company’s netincome decreased and the total sales increased.
5. DuPont Analysis
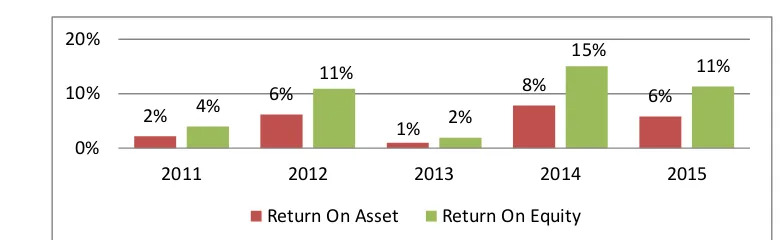
Figure 6. Return on Assets and Return on Equity of PT. Plaza Indonesia Realty Tbk from 2011–2015
Source: Data Processed
1. Return On Assets
Figure 6shows the PT. Plaza Indonesia Realty Tbk’s return on assets from 2011 to 2015. In year 2013 and 2015, the return on assets decreased because the total of net income decreased and total assets increased. The increasing of net profit margin in 2014 because the total of net income and total assets increased. It means PT. Plaza Indonesia Realty Tbk’s ability is increased to generate net profit from total asssets.
2. Return On Equity
Discussion Current ratio
In 2012 and 2013 the current ratio decreased because the total liabilities increased. The increase in current liabilities is mainly due to company’s current maturity of long-term bank loans amounting to Rp 393.59 billion in 2013, compared to Rp 236.67 billion in 2012. If the current liabilities of company increased then the current ratio will be decreased. Basically, the higher current ratio means more liquid the company. For the recent five years the current ratio of PT. Plaza Indonesia Realty Tbk is almost 2 and it means PT. Plaza Indonesia Realty Tbk has good financial performance. It can be seen by the total of current ratio from 2011 to 2015 that showed on figure 3.
Quick ratio
In 2012 to 2013, the quick ratio decreased because the current liabilities of company increased. The increasing of current liabilities because company has a long-term bank debt due within one year. If the quick ratio is below than 100% means the company does not has good financial performance. In fact, PT. Plaza Indonesia Realty Tbk has good financial performance because the total of quick ratio in last five years is above than 100%. In terms of current and quick ratio, PT. Plaza Indonesia Realty Tbk can be categorized as the one liquid company to pay the current liabilities.
Debt to total equity ratio
The ratio is increased from 2011 to 2014 because the total debt and total equity increased. If the ratio is keep increasing, it means company ability to pay off the debts decreased. Different in 2015, the ratio decreased 1% from the previous year and it means company could pay off the debt in its year. The standard of this ratio based on Kasmir (2008:287) is 90% and based on the result of debt to total equity from PT. Plaza Indonesia Realty Tbk for recent five years is below than the standard. It means PT. Plaza Indonesia realty Tbk’s has good financial performance to manage the debt. If the debt to total equity is higher, it indicates that PT. Plaza Indonesia Realty Tbk may not be able to generate enough cash to pay off the debts.
Debt to total assets ratio
In year 2011 to 2014, the debt to total assets ratio of PT. Plaza Indonesia Realty Tbk is increased per each year. The increasing of this ratio caused the total debt and total assets of company is increased. in 2015, the ratio decreased 1% because the total debt and total assets of company increased and it means the total assets of PT. Plaza Indonesia Realty Tbk can ensure the total debt. Companies with high debt are said to be highly leveraged. The higher the ratio, the greater risk will be associated with the firm's operation. In addition, high debt to assets ratio may indicate low borrowing capacity of a firm, which in turn will lower the firm's financial flexibility.
Inventory turnover
inventory turnover below than the standard it means the company has not good financial performance. The decreasing ratio in 2013 to 2015 does not mean PT. Plaza Indonesia Realty Tbk has not good financial performance. If the acquired turnover higher, it means the management more effective in managing the inventory.
Total assets turnover
The standard for this ratio based on (Kasmir, 2008:187) is 2 times. The total asset turnover of PT. Plaza Indonesia Realty Tbk is below than the standard and it means the company’s ability was decrease. It can be seen the total asset turnover of PT. Plaza Indonesia Realty Tbk in recent five year does not meet the standard ratio and it means PT. Plaza Indonesia Realty Tbk’s performance was decrease. The decreasing of this ratio because the total asset increased so the sales decreased.
Gross profit margin
In 2011 to 2012 the gross profit margin of company decreased. This decreasing occurred because the cost of goods sold is increased although the sales are increased. So, PT. Plaza Indonesia Realty Tbk could not generate the gross profit well. In 2013 to 2015, the ratio is increasing and it means the ability of company to generate the gross profit margin is good. The higher gross profit margin of company means the condition of company operation is also good. It causes the cost of goods sold are relative lower than sales. Based on Lukviarman (2006:36) the standard for gross profit margin ratio is 24,90% and PT. Plaza Indonesia Realty Tbk can be said as the company that has good financial performance for last five year.
Operating profit margin
The ratio shows the increasing in operating profit margin from 2011 to 2015. This ratio increased because company could increase the operating profit from the total sales. The operating profit also increased because the gross profit of the company is increased. Based on Lukviarman (2006:36) the standard for operating profit margin ratio is 10,80%. So, PT. Plaza Indonesia Realty Tbk can be said as one company that has good financial performance because the total of operating profit margin for recent five years is above the standard. It can be seen from the total number of operating profit margin from 2011 until 2015 that start from 21% to 33%.
Net profit margin
The decrease in net income was mainly contributed from increase in foreign exchange losses of Rp 122.45 billion during 2015 offset with the increase in gross profit generated in 2014 amounting to Rp 93.79 billion compared to 2014. For year 2012 and 2014 the net profit margin increased because the net income of company is also increased. The increase of net profit in 2014 was due to an increase in revenue of Rp128.49 billion and also due to a decrease in foreign exchange losses of Rp187.45 billion during 2014. Furthermore, the financial cost was also decreased from Rp78.43 in 2013 to Rp59.22 billion in 2014. Based on Lukviarman (2006:36), the standard of net profit margin is 3,92%. The result of net profit margin from PT. Plaza Indonesia Realty Tbk is above than the standard and it means the company has good financial performance.
Return on assets
increase in revenue of Rp128.49 billion and also due to a decrease in foreign exchange losses of Rp187.45 billion during 2014. Based on Lukviarman (2006:36) the standard of return on assets is 5,98%. So, PT. Plaza Indonesia Realty Tbk can be categorized as one company that has good financial performance whether the company got decreasing 2 times in 2011 and 2013.
Return on equity
The return on equity of PT. Plaza Indonesia Realty Tbk in 2013 is the lowest because the net income of company decreased. The decrease in net income was largely derived from the decrease in gains on sale of apartment units and an increase in foreign exchange losses in 2013. In 2014 is the highest ratio of the year. The ratio increased because the net income of company also increased. The increase of net profit in 2014 was due to an increase in revenue of Rp128.49 billion and also due to a decrease in foreign exchange losses of Rp187.45 billion during 2014. According to Lukviarman (2006:36), the standard of return on equity is 8.32%. So, PT. Plaza Indonesia Realty Tbk can be categorized as company that has good financial performance. Higher the return on equity, more good the financial performance of the company and it shows the ability of the company was good to produce the profit.
4. CONCLUSION AND RECOMMENDATION
Conclusion
Based on the discussion the result are:
1. From the liquidity ratio analysis, PT. Plaza Indonesia Realty Tbk is capable of paying the debts and can meet its short term obligation as they fall due. Then, PT. Plaza Indonesia Realty Tbk has good financial performance.
2. From the leverage ratio PT. Plaza Indonesia Realty Tbk has good financial performance from 2011 to 2015. It can be seen from the debt ratio, debt to total assets ratio and debt to total equity ratio are below than the standard and it means the company has low debt and company has good management to manage the company’sdebt.
3. The activity ratio of PT. Plaza Indonesia Realty Tbk shows a good performance in inventory turnover for recent five years. It can be seen by the total of inventory turnover from 2011 to 2015 that above than the standard and it means PT. Plaza Indonesia Realty Tbk has good performance to manage the company’s inventories.
4. The profitability ratio of PT. Plaza Indonesia Realty Tbk showed company has good financial performance in gross profit margin, operating profit margin and net profit margin. It can be seen by the toal of ratio that above than standard and it means PT. Plaza Indonesia Realty Tbk to generate profits are good
5. From the DuPont system, PT. Plaza Indonesia Realty Tbk has good financial performance in return on assets and return on equity. It can be seen by the total of return on assets and return on equity that above than the standard and it means the company was able to gain many returns using their assets and equity.
6. Based on the value of ratio in 2011 to 2015, the researcher can say that PT. Plaza Indonesia Realty Tbk reached its best financial performance in 2014. It can be seen from the value of all financial ratios.
Recommendation
1. PT. Plaza Indonesia Realty Tbk should have to maintain their financial performances that already perform well, except for total assets turnover.
REFERENCES
Paper on journals
[1] Abhilasha and Kumara M. 2015. A Critical Analysis Of Financial Performance Evaluation Of An Indian Automobile Companies. International Journal of Research in Finance and Marketing. Volume 5, Issue 8 (August, 2015)
[2] Amalendu B.2010. Financial Performance of Indian Pharmaceutical Industry: A Case Study. Asian Journal of Management Research, ISSN 2229–3795.
[3] Bernhardt K. 2013. DuPont Financial Analysis Model. International Journal of Mathematics and Computer Sciences (IJMCS) ISSN:2305-7661 Vol. 19 July 2013
[4] Thomas A. 2015. Ratio Analysis As A Corporate Performance Measuring Tool. Multidisciplinary International Journal (MIJ) 2015, Vol. No. 1,Jan-Dec
[5]
Kimiagari, A. M., & Farhad, F. (2007). Developments of a model to measure,
evaluate, and rank the financialperformance of urban water and drainage
companies. Journal of Financial Research, 21, 113
Books
[6] Boone, L. & D. Kurtz, 1992. Management.2nd Edn. McGraw-Hill, Inc., New York, USA. [7] David, F.R. 2012. Strategic Management Concept and Cases.Fourteenth Edition.Pearson
Education. London
[8] Horngren, Barrison, Bamber (2002) Accounting – International Edition, 5th Edition, New Jersey: Prentice Hall.