e-Journal of English Language Teaching Society (ELTS) Vol. 1 No. 2 2013 – ISSN 2331-1841 1
INCREASING VOCABULARY MASTERY OF THE SEVENTH
GRADE STUDENTS THROUGH SNOWBALL THROWING
Rahmat Wirawan L1, Ferry Rita2, Abd.Waris3
Abstract
The purpose of conducting this research was to prove whether the students’ vocabulary mastery can be increased by using snowball throwing technique or not. This research was true-experimental research design. The population of this research was the seventh grade students of SMP Negeri 1 Ampibabo. The researcher took the students in seventh grade by using random sampling technique. The data were collected by using pre-test and post-test. The pre-test was conducted to measure the students’ vocabulary mastery before treatment, while the post-test was conducted to measure the students’ vocabulary after treatment. The data obtained from the test were analyzed statistically. The result of the data analysis showed that there was a significant difference between the result of experimental group and control group. It is proved that the result of t-counted (2.30) is higher than t-table (2.034). It means that the alternative hypothesis (Ha) was accepted and the null hypothesis (Ho) was rejected. Hence, the use of Snowball throwing technique can increase vocabulary mastery of the seventh grade students at SMPN 1 Ampibabo.
Keywords: Snowball Throwing Technique; Vocabulary Mastery.
INTRODUCTION
Language is a mean of communication that people used to convey their ideas,
opinions, thoughts, and feelings to each other. English is the first foreign language in
Indonesia which is important to transfer and gain knowledge, science and technology, art
and culture, and establish international relationships.
English has been learned by students of junior high schools for many years. They
have learned language skills: reading, writing, speaking and listening. In addition, they also
have learnt language components: vocabulary, pronunciation, and grammar to help them
develop their language skills. For example, by having vocabulary and knowing tenses, it is
easy for the students to comprehend reading or to write paragraphs. In the field of
education, the goals of teaching English in Indonesia can be seen in the following:
1
Email: [email protected] 2
Email: [email protected] 3
e-Journal of English Language Teaching Society (ELTS) Vol. 1 No. 2 2013 – ISSN 2331-1841 2 1. Memiliki kemampuan mengembangkan kompetensi berkomunikasi dalam bentuk
lisan secara terbatas untuk mengiringi tindakan (language accompanying action) dalam konteks sekolah.
2. Memiliki kesadaran tentang hakikat dan pentingnya bahasa Inggris untuk meningkatkan daya saing bangsa dalam masyarakat global.
3. Mengembangkan pemahaman peserta didik tentang keterkaitan dengan budaya. (Kepmendiknas, 2006:22)
There are four language skills that students have to be acquired: listening, speaking,
reading, and writing. To achieve these skills, the students have to master the language
components: grammar, vocabulary, and pronunciation. In other words, these language
components must go hand in hand to successfully achieve the language skills.
The lack mastery of one component can affect the students’ performance of the language skills. For example, if the students have limited English words or vocabularies, for
instance, the students will find a serious problem when speaking English. He/she cannot
speak fluently because they do not have a lot of words. The more words or vocabularies he
or she has the easier she minds, ideas, opinions or intentions through speaking or writing.
Vocabulary is one of the language components that have an important role to support
the four basics language skills. Vocabulary is very important in order to make people easier
to express their opinions and ideas in their communication with other people. Having
limited vocabulary, the students will find many difficulties in mastering language skills.
Napa (1991:1) states,” The fact that vocabulary is the component of language and there is no language exists without words. Words are signs or symbols for ideas. They are
the means by which people exchange their language. The more words we can learn, the
more ideas we should have, so we can communicate the ideas more effectively”.
Harmer (1991:153) states,” We must have something to say, we have meaning that we
wish to express and need to have stock of word that can describe how you feel at this
moment, you have to be able to find a word which reflects the complexity of your feeling”.
Birley and Lubis (1988:7) state” Effective communication is not about how many words
you use, but about which words you select to use. You can only select the best words for the
best occasions if you have a large vocabulary to draw from.” Both states mean by having
large vocabulary in the students’ mind, they can choose which words they will use in their
communication or in their ideas with various ways.
In fact, students in seventh grade at Junior High School have lack of vocabulary.
e-Journal of English Language Teaching Society (ELTS) Vol. 1 No. 2 2013 – ISSN 2331-1841 3 of English to solve their problem. The teacher is required to have an appropriate technique
of teaching.
Snowball Throwing Learning Model is one technique of cooperative learning. This
learning technique to trains students to be more responsive to receive messages from other
students in the form of snowballs made of paper, and conveys the message to his friend in a
group. According to Bayor (2010 in Deni 2011:2) states, ’’Snowball Throwing is one of the
active learning model which in practice involves a lot of students.” The teacher's role here is
only as giving guidance on the topic of early learning and subsequent demolition of the
course of learning.
Snowball throwing is one of the techniques in cooperative learning. Because
cooperative learning can be applied to almost any assignment in any curriculum for any
learner, it means that we can apply snowball throwing for teaching vocabulary. Suprijono (1999) states,” learning environment and management system of cooperative learning for
snowball throwing are provide opportunities for learning democracy, enhance the
appreciation of students on academic learning and changing norms related to achievement,
prepare students to learn about collaboration and social skills through active participation of
learners in small groups, provide opportunities for active participation in the process of
learning and learners in an interactive dialogue.” Johnson (1989) States, “As an interaction
model, cooperative learning endorses this general approach after receiving instruction from
the facilitator, classes are organized into small group and given clear direction regarding
expectations about outcomes and suggestions about group processes. The small group than
work through the assignment until all group members successfully understand and complete
it.” Those states above explained how important and how effective the applying of
cooperative learning in teaching English.
METHODOLOGY
In this research, the researcher usedthe true experimental research. There were two
groups, control group and experimental group. Both groups got pre test and post test. The
design that used is based on Best (1981:70) as follow:
Where :
R1 : experimental group R2 : control group O1O3 : pre-test X : treatment O2O4 : post-test
R1 O1 X O2
e-Journal of English Language Teaching Society (ELTS) Vol. 1 No. 2 2013 – ISSN 2331-1841 4 Every research has population and sample. Best (1981:8) defines “Population is any
group of individuals that have one or more characteristics in common that are of interest to
the researchers”. The population of this research was the seventh grade students of SMP Negeri 1 Ampibabo. It consists of 6parallel classes. Each class consists of 28-35 students.
The total number of the population was 178.
The result of students’ score in pre test and post test were analyzed statically. To analyze the individual’s standard in pre-test and post test, the researcher used formula which is designed by Purwanto (1991:102) as follows:
��=
�x 100 Where:
Np = individual score
R = raw score
SM = maximum score
Then, the researcher computed the mean score of experimental group and
control group by using Arikunto’s formula (2006)
M =
N x
Where:
M = mean score
X
= number of students N = total scoreAfter conducting the mean of pre test and post test, the researcher computed the
mean score of the deviation the researcher used a formula proposed by Arikunto (2006):
) (
2 2
2
N X X
X
) (
2 2
2
N Y Y
Y
Where:
2X
= the sum of deviation in experimental group
2Y
= the sum of deviation control groupN = number of students
e-Journal of English Language Teaching Society (ELTS) Vol. 1 No. 2 2013 – ISSN 2331-1841 5 )
1 1 ( ) 2 (
2 2
Y X Y
X
Y X
N N N
N
Y X
M M t
Where:
MX = mean score of experimental class
My = mean score of control class
X = sum of deviation in experimental class
y = sum of deviation in control class
Nx = number of students in experimental class
Ny = number of students in control class
The researcher knew the result of the hypothesis based on the analysis above. The
researcher compared the result of tcountand ttable. If thetcountwas higher than ttable, the
researcher hypothesis accepted. It means that Snowball Throwing Technique can increase
vocabulary of the seventh grade students in SMPN 1 Ampibabo. If the tcountwas lower than
ttablehypothesis of the research rejected. It means that Snowball Throwing Technique was
not effective to increase students’ vocabulary.
RESULT
The researcher conducted pre-test in experimental class on May 14th. and in the
control class on May 16th.It was intended to know the Students Ability before treatment.
e-Journal of English Language Teaching Society (ELTS) Vol. 1 No. 2 2013 – ISSN 2331-1841 6
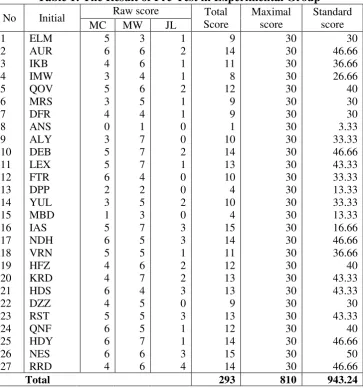
Table 1: The Result of Pre-Test in Experimental Group
No Initial Raw score Total Score
Maximal score
Standard score MC MW JL
1 ELM 5 3 1 9 30 30 2 AUR 6 6 2 14 30 46.66 3 IKB 4 6 1 11 30 36.66 4 IMW 3 4 1 8 30 26.66 5 QOV 5 6 2 12 30 40 6 MRS 3 5 1 9 30 30 7 DFR 4 4 1 9 30 30 8 ANS 0 1 0 1 30 3.33 9 ALY 3 7 0 10 30 33.33 10 DEB 5 7 2 14 30 46.66 11 LEX 5 7 1 13 30 43.33 12 FTR 6 4 0 10 30 33.33 13 DPP 2 2 0 4 30 13.33 14 YUL 3 5 2 10 30 33.33 15 MBD 1 3 0 4 30 13.33 16 IAS 5 7 3 15 30 16.66 17 NDH 6 5 3 14 30 46.66 18 VRN 5 5 1 11 30 36.66 19 HFZ 4 6 2 12 30 40 20 KRD 4 7 2 13 30 43.33 21 HDS 6 4 3 13 30 43.33 22 DZZ 4 5 0 9 30 30 23 RST 5 5 3 13 30 43.33 24 QNF 6 5 1 12 30 40 25 HDY 6 7 1 14 30 46.66 26 NES 6 6 3 15 30 50 27 RRD 4 6 4 14 30 46.66
e-Journal of English Language Teaching Society (ELTS) Vol. 1 No. 2 2013 – ISSN 2331-1841 7
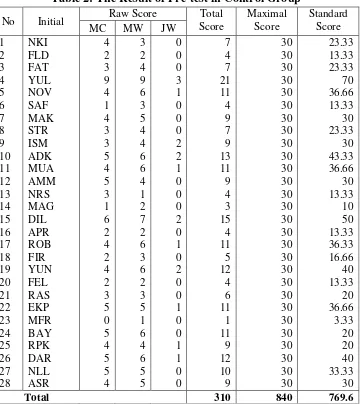
Table 2: The Result of Pre-test in Control Group
No Initial Raw Score Score Total Maximal Score Standard Score MC MW JW
1 NKI 4 3 0 7 30 23.33 2 FLD 2 2 0 4 30 13.33 3 FAT 3 4 0 7 30 23.33 4 YUL 9 9 3 21 30 70 5 NOV 4 6 1 11 30 36.66 6 SAF 1 3 0 4 30 13.33 7 MAK 4 5 0 9 30 30 8 STR 3 4 0 7 30 23.33 9 ISM 3 4 2 9 30 30 10 ADK 5 6 2 13 30 43.33 11 MUA 4 6 1 11 30 36.66 12 AMM 5 4 0 9 30 30 13 NRS 3 1 0 4 30 13.33 14 MAG 1 2 0 3 30 10 15 DIL 6 7 2 15 30 50 16 APR 2 2 0 4 30 13.33 17 ROB 4 6 1 11 30 36.33 18 FIR 2 3 0 5 30 16.66 19 YUN 4 6 2 12 30 40 20 FEL 2 2 0 4 30 13.33 21 RAS 3 3 0 6 30 20 22 EKP 5 5 1 11 30 36.66 23 MFR 0 1 0 1 30 3.33 24 BAY 5 6 0 11 30 20 25 RPK 4 4 1 9 30 20 26 DAR 5 6 1 12 30 40 27 NLL 5 5 0 10 30 33.33 28 ASR 4 5 0 9 30 30
Total 310 840 769.6
Having noted the pretest score, the researcher counted the mean score of the students
by applying the mean scores and divided with the number of the students. The mean
computation was as follow:
Mx =
N X
My =N Y
Mx = 943.24
27 My =
769.6 28
Mx = 34.93 My = 27.40
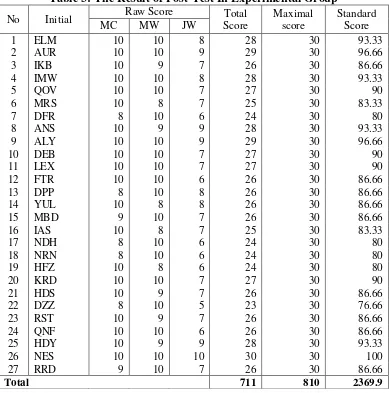
Post-test was given in experimental group on June 12th 2013 and the control group
on June 14th 2013. It was given to know the students’ ability after treatment. The result of
e-Journal of English Language Teaching Society (ELTS) Vol. 1 No. 2 2013 – ISSN 2331-1841 8
Table 3: The Result of Post-Test In Experimental Group
No Initial Raw Score Total Score
Maximal score
Standard Score MC MW JW
1 ELM 10 10 8 28 30 93.33 2 AUR 10 10 9 29 30 96.66 3 IKB 10 9 7 26 30 86.66 4 IMW 10 10 8 28 30 93.33 5 QOV 10 10 7 27 30 90 6 MRS 10 8 7 25 30 83.33 7 DFR 8 10 6 24 30 80 8 ANS 10 9 9 28 30 93.33 9 ALY 10 10 9 29 30 96.66 10 DEB 10 10 7 27 30 90 11 LEX 10 10 7 27 30 90 12 FTR 10 10 6 26 30 86.66 13 DPP 8 10 8 26 30 86.66 14 YUL 10 8 8 26 30 86.66 15 MBD 9 10 7 26 30 86.66 16 IAS 10 8 7 25 30 83.33 17 NDH 8 10 6 24 30 80 18 NRN 8 10 6 24 30 80 19 HFZ 10 8 6 24 30 80 20 KRD 10 10 7 27 30 90 21 HDS 10 9 7 26 30 86.66 22 DZZ 8 10 5 23 30 76.66 23 RST 10 9 7 26 30 86.66 24 QNF 10 10 6 26 30 86.66 25 HDY 10 9 9 28 30 93.33 26 NES 10 10 10 30 30 100 27 RRD 9 10 7 26 30 86.66
e-Journal of English Language Teaching Society (ELTS) Vol. 1 No. 2 2013 – ISSN 2331-1841 9
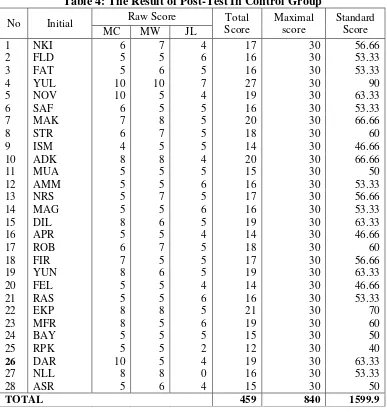
Table 4: The Result of Post-Test In Control Group
No Initial Raw Score Total Score
Maximal score
Standard Score MC MW JL
1 NKI 6 7 4 17 30 56.66 2 FLD 5 5 6 16 30 53.33 3 FAT 5 6 5 16 30 53.33 4 YUL 10 10 7 27 30 90 5 NOV 10 5 4 19 30 63.33 6 SAF 6 5 5 16 30 53.33 7 MAK 7 8 5 20 30 66.66 8 STR 6 7 5 18 30 60 9 ISM 4 5 5 14 30 46.66 10 ADK 8 8 4 20 30 66.66 11 MUA 5 5 5 15 30 50 12 AMM 5 5 6 16 30 53.33 13 NRS 5 7 5 17 30 56.66 14 MAG 5 5 6 16 30 53.33 15 DIL 8 6 5 19 30 63.33 16 APR 5 5 4 14 30 46.66 17 ROB 6 7 5 18 30 60 18 FIR 7 5 5 17 30 56.66 19 YUN 8 6 5 19 30 63.33 20 FEL 5 5 4 14 30 46.66 21 RAS 5 5 6 16 30 53.33 22 EKP 8 8 5 21 30 70 23 MFR 8 5 6 19 30 60 24 BAY 5 5 5 15 30 50 25 RPK 5 5 2 12 30 40
26 DAR 10 5 4 19 30 63.33 27 NLL 8 8 0 16 30 53.33 28 ASR 5 6 4 15 30 50
TOTAL 459 840 1599.9
After computing the students mean scores in pretest, the researcher computed the
students mean scores in posttest. The formula design used was same as in the pretest.
Mx =
N X
My =N Y
Mx =
27
23
.
2343
My =
28
9
.
1529
Mx = 86.78 My = 54.63
The result of the computation obviously showed that there were significant
differences between the students mean score in pre-test and post-test. The students mean
score in pretest 51.35 was lower than the students mean score in posttest 86.78. It proved
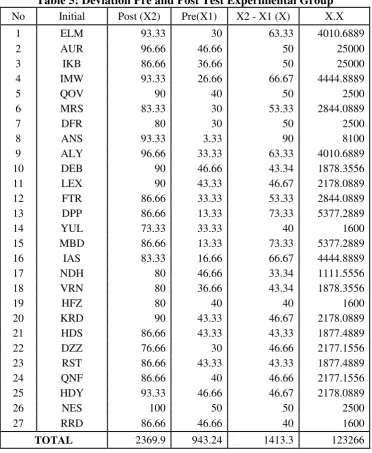
e-Journal of English Language Teaching Society (ELTS) Vol. 1 No. 2 2013 – ISSN 2331-1841 10 After calculating the mean score of the students of both pre-test and post-test, the
researcher computed the deviation and square deviation of the students’ scores in pre-test
[image:10.595.116.489.141.595.2]and post-test. The result was presented in the following table.
Table 5: Deviation Pre and Post Test Experimental Group
No Initial Post (X2) Pre(X1) X2 - X1 (X) X.X 1 ELM 93.33 30 63.33 4010.6889 2 AUR 96.66 46.66 50 25000 3 IKB 86.66 36.66 50 25000 4 IMW 93.33 26.66 66.67 4444.8889 5 QOV 90 40 50 2500 6 MRS 83.33 30 53.33 2844.0889 7 DFR 80 30 50 2500 8 ANS 93.33 3.33 90 8100 9 ALY 96.66 33.33 63.33 4010.6889 10 DEB 90 46.66 43.34 1878.3556 11 LEX 90 43.33 46.67 2178.0889 12 FTR 86.66 33.33 53.33 2844.0889 13 DPP 86.66 13.33 73.33 5377.2889 14 YUL 73.33 33.33 40 1600 15 MBD 86.66 13.33 73.33 5377.2889 16 IAS 83.33 16.66 66.67 4444.8889 17 NDH 80 46.66 33.34 1111.5556 18 VRN 80 36.66 43.34 1878.3556 19 HFZ 80 40 40 1600 20 KRD 90 43.33 46.67 2178.0889 21 HDS 86.66 43.33 43.33 1877.4889 22 DZZ 76.66 30 46.66 2177.1556 23 RST 86.66 43.33 43.33 1877.4889 24 QNF 86.66 40 46.66 2177.1556 25 HDY 93.33 46.66 46.67 2178.0889 26 NES 100 50 50 2500 27 RRD 86.66 46.66 40 1600
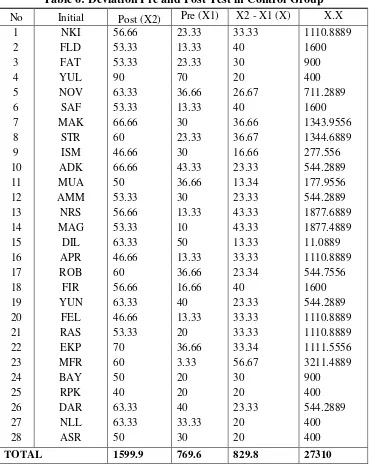
e-Journal of English Language Teaching Society (ELTS) Vol. 1 No. 2 2013 – ISSN 2331-1841 11
Table 6: Deviation Pre and Post Test in Control Group
No Initial Post (X2) Pre (X1) X2 - X1 (X) X.X 1 NKI 56.66 23.33 33.33 1110.8889 2 FLD 53.33 13.33 40 1600 3 FAT 53.33 23.33 30 900 4 YUL 90 70 20 400 5 NOV 63.33 36.66 26.67 711.2889 6 SAF 53.33 13.33 40 1600 7 MAK 66.66 30 36.66 1343.9556 8 STR 60 23.33 36.67 1344.6889 9 ISM 46.66 30 16.66 277.556 10 ADK 66.66 43.33 23.33 544.2889 11 MUA 50 36.66 13.34 177.9556 12 AMM 53.33 30 23.33 544.2889 13 NRS 56.66 13.33 43.33 1877.6889 14 MAG 53.33 10 43.33 1877.4889 15 DIL 63.33 50 13.33 11.0889 16 APR 46.66 13.33 33.33 1110.8889 17 ROB 60 36.66 23.34 544.7556 18 FIR 56.66 16.66 40 1600 19 YUN 63.33 40 23.33 544.2889 20 FEL 46.66 13.33 33.33 1110.8889 21 RAS 53.33 20 33.33 1110.8889 22 EKP 70 36.66 33.34 1111.5556 23 MFR 60 3.33 56.67 3211.4889 24 BAY 50 20 30 900 25 RPK 40 20 20 400 26 DAR 63.33 40 23.33 544.2889 27 NLL 63.33 33.33 20 400 28 ASR 50 30 20 400
TOTAL 1599.9 769.6 829.8 27310
After having the result of deviation in experimental and control group, the
researcher continued to calculate the mean deviation (Md) by using the formula as follows:
Md =
N d
Md =N d
Md = . Md = .
Md = 52.34 Md = 29.63
The mean deviation in experimental group was 52.34 and the mean deviation in
e-Journal of English Language Teaching Society (ELTS) Vol. 1 No. 2 2013 – ISSN 2331-1841 12 Before analyzing the data by using t-test formula, the researcher computed the sum
of square deviation both experimental and control groups as in the following ways:
2x =
n x x 2 2
= 123266 -
2
27 3 . 1413
= 123266 -
27
1997417
= 123266 – 73978
2x = 49288
y2=
n y y 2 2
= 27310 -
2
28 8 . 829
= 27310 -
28
688568
= 27310 – 24592
2y = 2718
As the result, the sum-squared deviation of experimental group is 49288 and the
sum-squared deviation of control group is 2718
After that, the researcher continued to find out the significant score of both groups
by using t-test formula as follows:
Ny Nx Ny Nx y x My Mx t 1 1 2 2 2 28 1 27 1 2 28 27 24592 49288 63 . 29 34 . 52 t 756 27 756 28 53 73880 71 . 22 t 756 55 53 73880 71 . 22 t
1393.96
0.07 71 . 22
e-Journal of English Language Teaching Society (ELTS) Vol. 1 No. 2 2013 – ISSN 2331-1841 13
97.57
71 . 22
t
87
.
9
71
.
22
t
30 . 2
t
Finally, after analyzing the data, it shows that the result of t-counted is 2.30.
DISCUSSION
Related to the result of students' pre-test, none of the students passed the test. The
standard score at SMP Negeri 1 Ampibabo was 75. Meanwhile, the highest score in pre-test
was 50. It shows that, there were no students who passed the test. The percentage of
students who got score lower than 75 was 100%.
Related to the result of students' pre-test, none of the students passed the test. The
standard score at SMP Negeri 1 Ampibabo was 75. The result just one students got 50. It
shows the students have serious problem in their vocabulary mastery that, there were no
students who passed the test. The percentage of students who got score lower than 75 was
100%.
In pre-test, there was 1 student who got the highest score and 1 student got the
lowest score. In doing the pre-test, the students did not understand well about the meaning
of vocabulary that always happen and exist in their real life. Not only the meaning of
vocabulary, but also they got difficult to pronounce and spell the words correctly. It was
surprising because the students have ever learnt it when they were still at elementary school.
The researcher had 6 meetings in this research, it means there were 6 treatments that
the students got. In first meeting, the students learned about how to found the new
vocabulary in their daily needs and things around them. After that, they should divide it into
verb, Adjective, or Noun. At meeting 5 and 6, They got the evaluation meeting, this meeting
was more difficult then meeting 1-4, because they should found new vocabulary and make
it into a sentence in good order.
After 6 treatments have been done, the researcher found the result of this research by
giving the students posttest. The result of pretest in experimental class showed a progress
value of the students’ mean scores from (34.93) in the pre-test was increased to (86.78) in the post-test, also, The researcher found that t-counted was 2.30. Then, to find out the
significant difference between the two groups, the writer compared the value of t-counted
(2.30) with the (2.034) value of t-table. It shows that the value of t-counted is higher than
e-Journal of English Language Teaching Society (ELTS) Vol. 1 No. 2 2013 – ISSN 2331-1841 14 accepted and the Null hypothesis of the research was rejected. In short, Snowball throwing
techniques is an effective way to increase the students’ vocabulary mastery.
CONCLUSION AND SUGGESTIONS
The result of data analysis showed that the percentage of t-counted was higher than the
t-table. By looking at the result, it can be said that there was a significant increasing in student
achievement. It means that the application of Snowball throwing technique can increase the
ability of the seventh grade students at SMP N 1 Ampibabo in vocabulary mastery. Thus, it
can be concluded that the research question or problem statement was solved because the
technique which was used by the researcher is effective.
Referring to the importance of vocabulary mastery in mastering a language, the
researcher would like to offer some suggestions as follow that might be important for the
improvement. First, students are expected to apply snowball throwing technique not only in
the school but also outside the school by using group form so that their vocabulary can
increase. Second, in class the teacher should construct a teaching learning activity which
involves the students actively. The application of snowball throwing technique is one of the
alternatives in teaching vocabulary. Snowball throwing technique is effectively and much
helpfully in increasing students’ vocabulary. Thus, the researcher recommends the English
teacher to apply this interesting technique at SMP level. Third, the school should provide a
lot of media to support the teacher in teaching English especially for vocabulary mastery.
REFERENCES
Arikunto, S. (2006). Prosedur Penelitian, suatupendekatan praktik (edisi revisi VII).
Jakarta: Rineka Cipta.
Best, J.W. (1981). Research in Education(.Third Edition) New Jersey: Engleewood, Cliffs.
Departemen Pendidikan Nasional Ditjen Manajemen Pendidikan Dasar danMenengah Direktorat Pembinaan Sekolah Menengah Pertama.Kurikulum Tingkat Satuan Pendidikan (KTSP). 2006.
Harmer, J. (1991). The Practice of English Language. New York: Longman.
Kurnianengih, D. (2011). Using Snowball Throwing Model to Increase Speaking Ability of the Second Year Students of SMPN 21 Pekanbaru Academic Journal
Napa. P.A. (1991). Vocabulary Development Skill. Yogyakarta: Kanisius.
e-Journal of English Language Teaching Society (ELTS) Vol. 1 No. 2 2013 – ISSN 2331-1841 15 Birley & Lubis, Y. (1988). Developing Communicating Proficiency in the English as a
Foreign Language (EFL class). Jakarta: Depdikbud.
Suprijono, A. (2009). Cooperative Learning. Yogyakarta: Pustaka Belajar.