Full Terms & Conditions of access and use can be found at
http://www.tandfonline.com/action/journalInformation?journalCode=vjeb20
Download by: [Universitas Maritim Raja Ali Haji] Date: 11 January 2016, At: 22:02
Journal of Education for Business
ISSN: 0883-2323 (Print) 1940-3356 (Online) Journal homepage: http://www.tandfonline.com/loi/vjeb20
The Use of Performance Control Charts in
Business Schools: A Tool for Assessing Learning
Outcomes
Michael J. Cervetti , Marla B. Royne & J. Michael Shaffer
To cite this article: Michael J. Cervetti , Marla B. Royne & J. Michael Shaffer (2012) The Use of
Performance Control Charts in Business Schools: A Tool for Assessing Learning Outcomes, Journal of Education for Business, 87:4, 247-252, DOI: 10.1080/08832323.2011.592870
To link to this article: http://dx.doi.org/10.1080/08832323.2011.592870
Published online: 29 Mar 2012.
Submit your article to this journal
Article views: 91
Copyright Taylor & Francis Group, LLC ISSN: 0883-2323 print / 1940-3356 online DOI: 10.1080/08832323.2011.592870
The Use of Performance Control Charts in Business
Schools: A Tool for Assessing Learning Outcomes
Michael J. Cervetti, Marla B. Royne, and J. Michael Shaffer
University of Memphis, Memphis, Tennessee, USAThe authors propose the use of performance control charts as a useful tool for tracking student assessments that rely upon faculty administered exams and projects as well as assessing teacher performance. This quantitative, formative evaluation process can be integrated into the classroom during an actual semester and utilized as a means to improving performance in future years.
Keywords: assurance of learning, performance control chart, quality control chart
Considerable research has assessed how and where faculty can improve the outcomes of student learning. One partic-ular issue that has been raised is the difference between what students actually learn and the skill sets of graduat-ing students upon entergraduat-ing the business workforce. Although there are several potential explanations for this academic performance–workplace performance gap, one may be re-lated to communication and collaboration between students and faculty, which may interfere with the learning process in the classroom. The purpose of this study was to propose a tool that can be integrated into the classroom during the semester and utilized as a means to improving both student and teacher performance
ASSURANCE OF STUDENT LEARNING
Benjamin (2009) utilized a rubric system to develop clear directions and drive continuous improvement, as well as to increase interaction and collaboration between students and faculty in achieving overall learning goals. Benjamin argued that instructors need to use “language that everyone understands, turning expectations into detailed performance contracts, monitoring performance regularly, and rewarding and enhancing system deployment” (p. 40). The rubric sys-tem Benjamin used was generated from quality levels where teachers were evaluated on continuous improvement on a
Correspondence should be addressed to Marla B. Royne, University of Memphis, Fogelman College of Business & Economics, Department of Marketing and Supply Chain Management, Memphis, TN 38152, USA. E-mail: [email protected]
rating scale from level 1 to level 4. Each of these ratings served as benchmarks for teachers’ steady progression to the next level. As a result of the clear expectations, results were successful. For example, one school’s participants showed a 46% achievement to level 3 in the initial year of deployment; there was also a 93% success rate in achieving level 1 or higher (Benjamin). Such results suggest that clear directions contribute to a teacher’s ability to assess and make adjust-ments on a regular basis to merit continuous improvement.
One student involved in the research stated, “I enjoy that we get to share our thoughts. We can tell if we have prob-lems or if we’re struggling, but most of all it makes me feel like I have a voice, and I control what happens with the classroom” (Benjamin, 2009, p. 44). Clearly, these are important factors for the collaboration of students and fac-ulty. When students have no voice in learning outcomes, the idea of continuous improvement on areas of concern lack the mutual direction from all parties involved. When areas of a curriculum are not fully understood, the customers—in this case, the students—provide potential corrective actions that ensure learning outcomes are exceeded.
Spruell, Hawkins, and Vicknair (2009) explored a richer learning environment that included cocurricular programs. They noted that although many universities incorporate some type of cocurricular experiences, such expenses vary from one institution to another based on the mission and goals of the institution. Spruell et al. also pointed out that cocurricular activities aim to extend the depth and richness of the student learning environment. This concept and model directly relate to a student centric environment that promotes collaboration and adds value to students’ educational learning outcomes.
Weldy and Turnipseed (2010) examined the direct and indirect learning measures based on the completion
248 M. J. CERVETTI ET AL.
of a real-world project for a required management course. Upon completion of the study, students were given a questionnaire as an indirect measure of learning based on their own perceptions; these responses were then compared with the direct measures from the teachers. This comparison revealed that a gap did indeed exist between the direct measures and the indirect measures. Specifically, the indirect measures indicated a higher perception on two of the four methods used, indicating that students’ perceptions of what they had learned were higher than what teachers perceived had actually been learned. Students also felt that when seeking management information, conducting research, and discovering trends and key issues, their abilities and capabilities were there. Overall, this study provided evidence that real-world-based projects can be used as pedagogical tools in business curriculums to advance the development and improve the learning outcomes of the students.
Drost, Hanson, Molstad, Peake, and Newman (2008) in-tegrated a portfolio approach into the course program to ad-vance the outcomes of student learning. This allowed faculty members to move away from student tests as the exclusive measure of course assessment (Drost et al., 2008). The study first developed five main learning goals that served as the basis for creating the 12 specific learning objectives that were used to evaluate the assessment of the program. For the assessment to be evaluated, professors had to assign a project that included at least four of the 12 learning objec-tives. These assignments allowed the students to express their highest academic performance and understanding of the ob-jectives chosen by the instructors. Grading for these assign-ments utilized a Likert-type scale for summative evaluation of the learning objectives. However, this form of assessment did not allow for any type of formative evaluation from the students. Hence, Drost et al. created a self-evaluation essay prepared from each individual student to address perceptions in indirect measures. Unfortunately, administration noted a portfolio storage issue, and these concerns led to the sub-mission of electronic files by students; these were held for a maximum of one year. Moreover, the administration con-cluded that this was “not one of the more administratively ‘efficient’ means for conducting outcome assessment” (Drost et al., p. 111).
From an academic quality perspective, students felt a portfolio assignment was much better than exams for content application, and faculty believed this assignment should be implemented across the board to improve the quality of the programs. In fact, most students have expressed that the assignments “were genuine learning experiences” (Drost et al., 2008, p. 111). Unfortunately, the summative evaluations of the portfolio systems revealed that some learning objec-tives were not addressed efficiently, but this did not mean they were not included in the portfolio; rather, they were not addressed to the desired measures. Results showed the summative evaluations were less useful than the indirect and
formative measures of the essay evaluations provided by the students, but these summative evaluations from the portfolio helped to ensure that the set learning objectives were being achieved.
Gardiner, Corbitt, and Adams (2010) proposed a practical, how-to model for the implementation of the assurance of learning process. The first step is to develop 6–8 learning goals and outcomes for each program. Although these goals should be owned by the faculty, they should directly support the mission of the program itself (Gardiner et al.). After the identification of these goals, specific learning objectives should be developed to measure the assessment and progress toward the specific learning goals.
The second step plans the assessment whereas the third step manages the assessment execution. The evaluators must receive the appropriate tools and rubrics for the assignment. The fourth step analyzes the assessment data to achieve ac-tionable results and generate reports that can provide specific actions to improve measures (Gardiner et al., 2010). Gardiner et al. noted that assessment systems that can track learning outcomes for individual students and student cohorts are be-coming more popular.
Identifying and agreeing on program improvements is the next step. This is critical because lack of agreement gener-ally results in lack of action, and the process of closing the loop is not accomplished. Actions should then be evaluated in terms of costs, significance, and time to reach an accept-able implementation method. Execution of these program improvements follows, and this step should include the mea-surement of the intervention, the execution performance, and reassessed post implementation. Ultimately, the end result of this step should create a higher performance on the objec-tives set and help determine what changes are appropriate for the future assessments. The final step requires recording details of the previous steps. Overall, incorporating many of these steps identified by Gardiner in the use of our proposed performance control chart (PCC) will simplify the process for assessment in teacher performance and the assurance of learning by the students.
Stivers and Phillips (2009) found that faculty involvement must include all members; attempts to speed up the process by using a small group may not meet the purpose that was set. Additionally, the involvement provides ownership and expe-rience for the members to make improvements. Departments and teams must acquire responsibility for the assessment, and members must reach agreement on the goals and outcomes because this framework is the backbone for the assessment and potential improvements in the curriculum. For the pro-cess to work appropriately, funding should be administered to adequately cover all needed assessment resources whether tests, faculty-release time, training, data collection, or out-side sources. Direct measures should be supported by the use of indirect measures, and closing the loop assessment data must be collected and used by the faculty to make changes in materials, courses, and methods.
Numerous studies have been designed and implemented to further assess and document successful strategies for im-proving student learning. However, the model that we pro-pose here not only meets the requirements listed previously, but also helps define teacher performance. There are many definitions of teacher performance and many ways to mea-sure how well a teacher performs in the classroom. Two of the most popular methods of measuring teacher performance in higher education are through student evaluation of teachers (SETs) and final class evaluations. Did the students like their teacher? How many students passed the class and how many students failed? Although such measures provide some feed-back that can be incorporated into future semesters, they are basically end-of-the-year, summative assessments that have little, if any, value in terms of professional development dur-ing the school year. Finally, annual evaluations must be done to achieve continuous improvements. Hence, we propose a model that includes most of these issues.
THE QUALITY CONTROL CHART
Formative evaluation, continuous improvement, and assur-ance of learning all examine the subject as it is being taught, not after completion of a semester. Their purpose is to pro-vide ongoing diagnosis and feedback so that teachers can modify classroom activities during the year, if necessary. The approach presented here allows the instructor that flexi-bility while building from one of the most basic of business techniques, the quality control chart, developed by Walter A. Shewhart while working for Bell Labs in the 1920’s and fur-ther refined by W. Edwards Deming. Shewhart believed that “lack of information greatly hampered the efforts of control and management processes in a production environment,” (SkyMark, 2010). Shewhart’s ideas of combining creative management with statistical analysis were noteworthy then as now. Although quality control types of quantitative tools are highly successful in the industrial and business world, Schazmann, Regan, Ross, Dermot, and Pauli (2009) noted that “quality control measures are less prevalent in teaching laboratories (classrooms) than commercial settings possibly owing to a lack of commercial incentives or teaching re-sources” (p. 1).
We propose that a modification of the quality control chart (QCC) process will imbue the teacher and students with a spirit of working together to reach a common goal: assur-ance of learning. We believe it provides “collaborative ef-fort” between teachers and students—something presently lacking in most higher education classrooms—and augment the effort where it does exist. Further, we propose that a QCC type of mechanism placed in the classroom will provide the tool needed by teachers for continuous improvement. The idea presented in this article draws its structure similar to how Shewhart envisioned the QCC working in the factory, that constant evaluation of teaching practices—via the PCC
described subsequently—are keys to the development of a successful experience for students. It is important to note, however, that the model proposed here does not seek to du-plicate the exact QCC used in factories. Rather, we utilize only the basic structure of the QCC and adapt it to a class-room environment.
Horsburgh (2010) argued that that a collaborative effort between the teacher and the student produces the best teacher with the best learning outcomes for the student. At the same time, the basic QCC process provides a means for measuring success and documenting professional development activi-ties related to the particular subject being taught during the school year—not at the end of the school year. And although the use of a QCC is quantitative and tactical in nature, it is also a philosophy of doing business, which is the approach that we propose here. Hence, within the educational envi-ronment, it is essentially an entire school system working toward a common goal of a quality curriculum and a chance for continuous professional development. Because of this, Melvin (1993) stated,
The goal is to create an educational system that is capable of constantly improving the quality of school-related processes in order to influence the quality of educational outcomes in the classroom, the school, the district, and the community. Our efforts are founded on the premise that by focusing on the improvement of customer-defined quality in both services and products, a school system will experience both increased public support and high staff and student satisfaction. (p. 74)
Hence, we propose a PCC—a modification of the QCC—as a means of assessing learning outcomes for both the instructor and the students. This allows us to focus on the aspect of quality control that helps to improve both class performance and the students’ perception of the classroom environment.
PERFORMANCE CONTROL CHARTS
Generally, quality control charts are a simple graphic that allows one to determine when a process gets out of control (Savic, 2006). Figure 1 displays a typical quality control chart; it utilizes a center line (CL), an upper control limit (UCL), and a lower control limit (LCL). The UCL and LCL are horizontal lines situated above and below the CL. The CL represents the process average when it is in a state of statistical control. Any points above the UCL or below the LCL are considered out of control. That is, if the process is out of control in the upper or lower range, then an assignable cause must be documented and removed.
However, we propose an important difference in how the control chart is implemented in a classroom. While a typical quality control chart allows an engineer to detect deviation from the process mean—the CL—and to make adjustments
250 M. J. CERVETTI ET AL.
FIGURE 1 A typical quality control chart, with upper control limit (UCL),
center line (CL), and lower control limit (LCL) (color figure available online).
to the process only when needed, the control chart presented here supports change and what might be considered out of control processes. This is an important distinction from the traditional QCC and Deming’s basic argument that changes should be implemented only when a process is out of control. Moreover, the control chart must be adapted to each individ-ual instructor and classroom based on the previous semester’s learning outcomes. For these reasons, we refer to the control chart here as a PCC. One of the overall goals of the PCC is to allow the instructor to analyze the information gleaned from the highs and lows of the graph and to make appropriate changes in the curriculum as needed. By using the PCC, an instructor can reduce two possible errors: (a) taking action when none is needed and (b) not taking action when it is needed (Savic, 2006). Although we recognize this approach is in contrast to Deming’s philosophy, we also argue that it is critical here because teaching is a service-based prod-uct whereas typical control charts are used for goods-based manufacturers. The now well-accepted differences between services and goods generally require different approaches to assessments of service quality (Parasuraman, Zeithaml, & Berry, 1985).
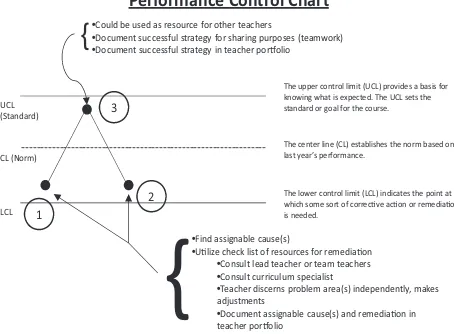
The PCC in Figure 2 illustrates the established norm for a given course based on the achievement level of the previous semester in that course. A statistical confidence interval will be the mechanism utilized to establish a PCC that will deter-mine the expected performance level based on the previous semester’s data (the CL of the confidence interval) and, at the same time, provide a higher level standard of learning for the present year (the UCL). It is important to note that the UCL is only an artificial goal; it will likely take more than one semester to reach the current UCL. Further, the UCL will change from semester to semester, depending on the previous semester’s mean and standard deviation. How-ever, if a class is at the 100% level (perfect performance), then the PCC could be used to simply monitor the future performance of that class. Finally, a PCC will track the class performance variance, or deviation from the norm, in either a positive direction (above the norm at point 3 in Figure 2) or in a negative direction (below the norm at points 1 and 2
---The upper control limit (UCL) provides a basis for knowing what is expected. The UCL sets the standard or goal for the course.
The center line (CL) establishes the norm based on last year’s performance.
The lower control limit (LCL) indicates the point at which some sort of correcƟve acƟon or remediaƟon is needed.
•Find assignable cause(s)
•UƟlize check list of resources for remediaƟon •Consult lead teacher or team teachers •Consult curriculum specialist
•Teacher discerns problem area(s) independently, makes adjustments
•Document assignable cause(s) and remediaƟon in teacher porƞolio
•Could be used as resource for other teachers
•Document successful strategy for sharing purposes (teamwork) •Document successful strategy in teacher porƞolio
Performance Control Chart
FIGURE 2 Example of a performance control chart.
in Figure 2). As noted, a PCC gives the teacher the mecha-nism necessary to discern specifically where remediation is needed.
Point 3 in Figure 2 indicates that this teacher could be used as a resource for other teachers. Successful strategies should be documented and placed in the teacher portfolio for sharing purposes with other teachers (teamwork) and/or eval-uation by administrators. Points 1 and 2 in Figure 2 indicate where modification might be needed in the course. Specifi-cally, an assignable cause should be diagnosed. A checklist of resources should be developed and utilized. After the teacher finds an assignable cause(s) and documents the remediation utilized, it should then be placed in the teacher portfolio for future reference or evaluation by administrators. As noted, the PCC is not trying to emulate Deming’s model of to-tal quality management with regard to process control. The PCC only utilizes the structural concept of the QCC to high-light the highs and lows of the course content. In fact, the PCC is a tool that is utilized to actually aid the instructor in moving the CL, which, as noted, is the opposite of Deming’s approach. Action is encouraged at points 1 and 2 in Figure 2. It is important to emphasize that a PCC is not a search-and-destroy tool, but rather one to search and remediate. As noted, the PCC helps the teacher discern where to take action when action is needed.
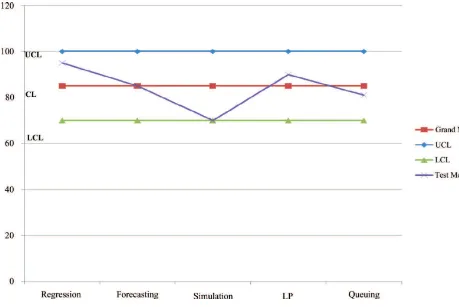
For example, a typical business statistics instructor could, using Gardiner et al.’s (2010) model discussed previously, develop a set of course-level learning objectives based on the learning goals relevant to that course. These objectives might be that students could demonstrate the required proficiency in various quantitative tools such as regression, forecast-ing, simulation modelforecast-ing, linear programmforecast-ing, and queuing. These course objectives would be evaluated through course-embedded measures that relate to specific course assignments (Association to Advance Collegiate Schools of Business In-ternational, 2007), which—in the case of the model we are proposing—could also mean class tests. Figure 3 represents
FIGURE 3 A business statistics class performance control chart (color figure available online).
an actual PCC. This PCC was developed by calculating the mean for all of the tests that were given during the previous semester. The UCL and LCL were calculated by adding and subtracting one standard deviation to the mean. As research is conducted and data are collected, these UCL and LCL can and should be adjusted and adapted to meet the instructor’s
unique needs for the class. After the UCL (mean +
stan-dard deviation), CL (overall class mean), and LCL (mean – standard deviation) is established and drawn, then means for each individual test are plotted on the chart. This PCC shows that the class, as a whole, performed well above the overall mean on the regression component of the class objectives. At the same time, the PCC also indicates that the simulation component for the class was well below the overall class mean.
This low point on the PCC, the point where the simula-tion assessment approaches the LCL, is also the point in the model where the faculty member could utilize a checklist of resources for remediation, document the remediation uti-lized, and place documentation in the teacher portfolio for future reference or evaluation by administrators. It should be remembered that students also see the PCC and share in the remediation process; it is important for the psychosocial climate of the classroom that students share in the responsi-bility of the improvement process. As Gardiner et al. (2010) noted,
any model of quality in higher education needs to produce evidence-based improvement in learning, clearly identify needed quality improvements in either the processes or the outcomes, and involve the faculty in the evaluation of learn-ing and the implementations of the improvements. (p. 140)
The PCC model does just that while also involving stu-dents in the remediation process, something recommended by several academicians (e.g., Stivers & Phillips, 2009)
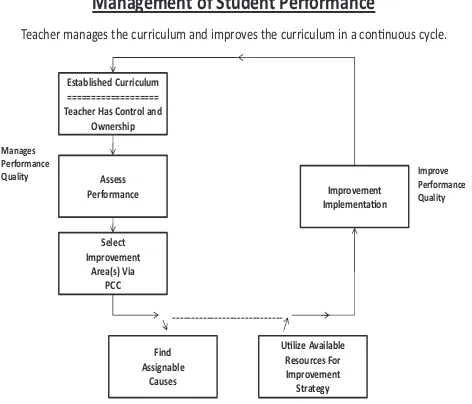
Figure 4 illustrates the flow of the course as the teacher utilizes the formative information from the PCC to make im-provements in the course during the school year. Essentially, the teacher assesses the performance of students via the PCC, assigns a diagnosis, and subsequently implements a course of action with the aid of a list of available resources and strategies. The remediation could be as simple as spending more time on the topic or as drastic as restructuring a part of the course. In such cases, some strategies might have to be implemented the following school year. The expectation is that as the teacher works consistently on the weak points of the course or curriculum, over time the norm or CL will in-crease. Each PCC should be analyzed in a longitudinal format to discern if the same weak points occur through the years for a particular teacher and to see if significant improvement is made on the CL, or class average, of the PCC from year to year.
252 M. J. CERVETTI ET AL.
Teacher manages the curriculum and improves the curriculum in a conƟnuous cycle.
FIGURE 4 Flowchart of course remediation process.
The PCC should be displayed clearly on the wall of the classroom where it is easily visible by students and teachers. The teacher should encourage the students to take ownership in the class progress and point out goals for each test. This should encourage teamwork for the class and collaboration with the teacher, and subsequently, a more favorable class-room environment. As pointed out by Dorman (2002), “with-out a consideration of the crucial role of the psychosocial environment of classrooms, educational productivity cannot be optimized” (p. 1).
Although the PCC may have some value for the Asso-ciation to Advance Collegiate Schools of Business Interna-tional accreditation process, its primary role is improvement in the classroom. For example, it can be used to encour-age self-evaluation of teacher performance by providing a mechanism to chart progress, pinpoint problem areas in the curriculum as they occur, adapt to unique school or class-room environment, provide immediate feedback as concerns student progress toward reaching established goals, focus on prevention of student failure at all stages of instruction, provide a mechanism for continuous improvement of cur-riculum, provide a data base for assessing the results of any remedial action that was taken, replace bureaucratic control and management with self-regulation and self-motivation, and promote teamwork among teachers of the same course by sharing results in a meaningful way. Moreover, the PCC provides a means of accountability, an issue that is
be-coming an increasingly critical concern in the educational environment.
In short, the PCC is a formative evaluation process that can be integrated into the classroom during an actual semester and utilized for remediation when and where the instructor deems necessary. As a result, the PCC has considerable potential for helping teachers improve their classroom skills, which should translate into enhanced learning outcomes that can benefit the student and the ultimate employer.
REFERENCES
Association to Advance Collegiate Schools of Business International. (2007). AACSB assurance of learning standards: An interpretation. Tampa, FL: AACSB International Accreditation Coordinating Committee and AACSB International Accreditation Quality Committee. Retrieved from http://www/aacsb.edu/publications/papers/accreditation/assurance-of-learning.pdf
Benjamin, S. (2009). Keeping score: Use rubrics to advance continuous improvement in schools.Quality Progress,42, 40–44.
Dorman, J. (2002). Classroom environment research: Progress and possibil-ities.Queensland Journal of Educational Research,18, 112–140. Drost, D., Hanson, L., Molstad, C., Peake, L., & Newman, E. (2008)
Out-come assessment of a management program using a portfolio approach: Lessons learned.American Journal of Business Education,1, 105–114. Gardiner, L., Corbitt, G., & Adams, S. (2010). Program assessment:
Get-ting to a practical how-to model.Journal of Education for Business,85, 139–144.
Horsburgh, D. (2010, March 20). Measuring the performance of teachers and students.Denver Post. Retrieved from http://blogs.denverpost.com/ eletters/ 2010/03/20/measuring-performance-of-teachers-and-students-2-letters/8522/
Melvin, C. (1993). Application of control charts to an educational system.
Performance Improvement Quarterly,6(3), 74–85.
Parasuraman, A., Zeithaml, V., & Berry, L (1985). A conceptual model of service quality and its implications for future research.Journal of Marketing,49(4), 41–50.
Savic, M. (2006).p-Charts in the quality control of the grading process in the high education.Panoeconomicus,53, 335–347.
Schazmann, B., Regan, F., Ross, M., Dermot, D., & Pauli, B. (2009). Intro-ducing quality control in the chemistry teaching laboratory using control charts.Journal of Chemistry Education,86, 1085–1086.
SkyMark. (2010).Walter Shewhart: The grandfather of total quality man-agement. Retrieved from http://www.skymark.com/resources/leaders/ shewart.asp
Spruell, J., Hawkins, A., & Vicknair, D. (2009). Managing learning ex-periences in an AACSB environment: Beyond the classroom.American Journal of Business Education,2, 75–77.
Stivers, B., & Phillips, J. (2009). Assessment of student learning: A fast track experience.Journal of Education for Business,85, 258–262. Weldy, T., & Turnipseed, D. (2010). Assessing and improving learning in
business schools: Direct and indirect measures of learning. Journal of Education for Business,85, 268–273.