IS THERE A TEACHER MOTIVATION CRISIS
IN TANZANIA?
PAUL BENNELL*
and
FAUSTIN MUKYANUZI**
SEPTEMBER 2005
Contents
ACKNOWLEDGEMENTS
ACRONYMS
1 INTRODUCTION
1.1 Study Objectives
1.2 Information Sources
1.3 Report Structure
2 IS THERE A TEACHER MOTIVATION CRISIS?
2.1 Job Satisfaction and Motivation Levels
2.2 Trends
3 STATUS AND VOCATIONAL COMMITMENT
3.1 Respect for Teaching
3.2 Vocational Commitment
3.3 Occupational Solidarity and Power
4 TEACHER COMPETENCE
4.1 Overall Assessment
4.2 Improvement Strategy
5 WORKING AND LIVING CONDITIONS
5.1 Overall Assessment
5.2 School Location and Infrastructure
5.3 Teacher Workload
5.4 Pupil Behaviour
5.5 Teacher Management
5.6 Living Conditions
5.7 The Impact of the AIDS Epidemic
6 PAY AND OTHER BENEFITS
6.1 Pay Levels
6.2 Pay relativities
6.3 Salary Administration
7 IMPACT ON SERVICE DELIVERY
7.1 Teacher Deployment
7.2 Teacher Postings
Tables
Table 2.1 Head teacher assessment of two main challenges facing their schools
Table 2.2 Teacher questionnaire responses to general statements, November 2004
(rounded percentages)
Table 2.4 Job satisfaction ratings among teacher interviewees, November 2004,
(rounded percentages)
Table 2.5 Head teacher ratings of teacher motivation levels (rounded percentages)
Table 2.6 Poor job satisfaction by teacher age (rounded percentages)
Table 4.1 Teacher interviewee ratings of in-service training: provision by grade
(rounded percentages)
Table 5.1 Teacher interviewee ratings of working conditions (rounded percentages)
Table 5.3 Percentage breakdown of weekly periods taught at survey schools
Table 5.4 Time allocation between teacher work activities (hours/weeks)
Table 5.5 Teacher questionnaire responses to management-related statements
(rounded percentages)
Table 5.6 Marital status of teachers at survey schools (rounded percentages)
Table 6.1 Average monthly expenditure by major item among teachers at survey schools
(T.Sh. rounded ‘000)
Table 6.2 Teacher starting pay compared with equivalent occupations in the public sector
(T.Sh. ‘000/month)
Table 7.1 Spatial distribution of diploma and Grade A primary school tezchers across district
in Tanzania, 1991-2004
Table 7.2 Regional variations in pupil-teacher ratio, 2004
Table 7.3 Variation in stream-teacher ratios across districts, 2004
Table 7.4 Rates of teacher turnover by reason during 2003 school year
Table 7.6 Breakdown of years at current school for teachers at survey primary schools
(rounded percentages)
Table 7.7 Teacher absenteeism by reason and lateness (percentages)
Table 8.1 Suggested improvements by teachers and head teachers to improve
ACKNOWLEDGEMENTS
We wish to thank everyone who assisted us in this study. Special thanks go to
ACRONYMS
PEDP Primary Education Development Programme
DFID Department for International Development
EFA Education for All
PEDP Primary Education Development Programme
MOEC Ministry of Education and Culture
EMIS Education Management Information System
TTUs Tanzania Teacher Union
NGO Non-Governmental Organisation
UPE Universal Primary Education
TSC Teacher Service Commission
SMCs School Management Committees
MoF Ministry of Finance
1. INTRODUCTION
1.1 STUDY OBJECTIVES
In Tanzania, as elsewhere, universal primary education with acceptable learning outcomes can only be attained if teachers are adequately motivated. Teachers also have a critical role to play in supporting development activities in the wider community. In short, teachers are central to the realisation of ambitious national and international education and poverty reduction goals. However, there are growing concerns that teachers in Tanzania, as in other developing countries, are increasingly de-motivated, which is reflected in deteriorating teaching performance and learning outcomes. The 1995 Education and Training Policy noted that ‘in Tanzania, teachers have experienced low and irregular salary payments, lack of proper housing, inadequate teaching facilities, low status and limited opportunities for professional development’ (p.31). Poor incentives also mean that far too few qualified and experienced teachers want to work in schools in rural areas where the large majority of the population and the poor live and where primary school enrolment and completion rates are relatively low
To what extent, then, is there teacher motivation crisis in Tanzania? This report marshals the findings from primary research as well as evidence from other sources in order to answer this question. Given the importance of ‘Education for All’, the focus is on the 120,000 teachers who work in 13,000 government-funded primary schools right across the country. After two decades of falling enrolment rates, concerted efforts are now being made to ensure that all children complete primary education (Standards 1 to 7) and acquire the basic competencies necessary to lead a rewarding and productive life. To this end, the Government of Tanzania with substantial financial backing from its international development partners is currently implementing the Primary Education Development Programme. Since the abolition of tuition and other fees in 2001, primary school enrolments have increased by over 40 percent - from 4.9 million to 7.0 million in early 2004. Nearly 40,000 classrooms were built between 2000 and 2004.1
More than ever, therefore, teachers are under tremendous pressure from politicians, parents, and communities to deliver quality primary education to all children. But how likely is it that they will respond to this challenge given their current levels of pay and the conditions in which they have to work and live?
1.2 INFORMATION SOURCES
The study draws on three main sources of information, namely action research in a small sample of primary schools, interviews with key stakeholders, and all relevant documentation and available statistics.
School survey
A representative group of 10 government-funded primary schools were surveyed in two locations- an urban district (Temeke in Dar es Salaam Region) and a rural district (Muleba in Kagera Region).3 Each school was visited for one day in late November-early December 2004. Schools participated in the survey did so on the understanding that their identities would not be revealed. The head teacher and four randomly selected teachers were individually interviewed at each school while the remaining teachers were asked to complete a questionnaire. Five from this latter group of teachers also participated in a semi-structured focus group discussion at each school. Each group was requested to discuss prepared statements that cover all key aspects of teacher motivation and then decide whether they agree, disagree or are not sure about each statement. These same statements were also included in the teacher questionnaire.
Each of these four groups of respondents were asked the same or very similar questions about the overall levels and determinants of teacher job satisfaction and motivation at the school. In this way, it was possible to compare or ‘triangulate’ their responses, especially in order to assess how consistent they were. Nearly all head teacher and teacher interviews and all the teacher focus groups were conducted in Kiswahili. The teacher questionnaire was also written in Kiswahili.
The school survey collected information from 10 head teachers, 10 teacher focus groups, 35 teacher interviewees, and 149 teacher questionnaires.
Strengths and weaknesses
The school survey was carefully well designed and pre-tested and therefore it was possible to collect good quality information. Each of the four instruments complemented each and enabled information from different sources to be compared, especially for response consistency. However, given the sensitivity of a few questions (particularly those related to parental education, secondary employment, and incomes), the quality of some information is questionable. Also, some head teachers were clearly reluctant to express negative views concerning the level of job satisfaction and motivation, in part because such views may have reflected badly on them.
Stakeholder interviews
Education and Culture, other relevant ministries, bilateral and multilateral development agencies, and education non-governmental organisations. The main purpose of these interviews was to obtain stakeholder assessments of the overall level, trends, and specific determinants of teacher motivation and job satisfaction in primary schools.
Relevant documentation and statistics
Four surveys have been undertaken on teacher motivation and incentives in Tanzania since the early 1990s. In chronological order, they are as follows:
• World Bank, 1990, Conditions of service among primary and secondary teachers in Tanzania.
• TADREG, 1991, A survey of living and working conditions of primary and secondary school teachers on mainland Tanzania by B. Cooksey, A. Ishumi, G. Malekela, and J. Galabawa. The survey was conducted in six regions and 1741 primary and secondary teachers were surveyed
• Teacher Trade Union/Haki Elimu, 2004, Study on the working conditions of teachers in Tanzania, by S. Sumra and others. This included interviews with 74 primary school teachers at 21 schools in seven districts.
• Swai, F., A. Mtavangu, and N.N.F. Shami, 2004, Study on job satisfaction and motivation in teaching in relation to quality EFA initiatives.
The TADREG, World Bank and TTU/Haki Elimu4 surveys cover both primary and secondary school teachers, whereas the Swai Survey focuses on secondary school teachers and teacher trainers only. Apart from the TTU/Haki Elimu survey, these surveys relied mainly on administering questionnaires to teachers working at relatively large samples of urban and rural schools.
Other relevant documentation was reviewed, in particular the main education and policy reviews and reports since the mid 1980s and, most recently, the comprehensive reports of the annual PEDP Review Teams. Data on teacher deployment and attrition was extracted from MOEC’s Education Management Information System since the early 1990s.
2.
IS THERE A TEACHER MOTIVATION CRISIS?
Newspaper articles and other media reports regularly highlight the plight of teachers in Tanzania.5 Numerous official documents over the last decade or so have also increasingly drawn attention to the fragility of teacher motivation in the country. For example, the Report on the Education Sector Towards 2000 notes that ‘since 1962, the different schemes of service for teachers have not reflected due recognition of the heavy demands of society upon teachers nor the crucial contribution of the latter in moulding the future citizens of society. This attitude has greatly discouraged academically able young men and women from enrolling in teacher training courses. Many dedicated teachers have gone to more caring employers’. In a similar vein, the 1990 World Bank report on teachers’ conditions of service concluded that ‘in the absence of incentives to perform better, many teachers are currently providing much less and lower quality education than they are capable of …the de-motivation of teachers is a major contributory factor to the abysmally poor learning achievements of primary and secondary students’ (World Bank, 1990, p.10).
This chapter draws on the information from the school survey, stakeholder interviews and secondary sources in order to assess the overall levels and trends in job satisfaction and motivation among primary school teacher in Tanzania.
2.1 JOB SATISFACTION AND MOTIVATION LEVELS
Getting good quality information on overall levels and trends in teacher motivation is not easy. In part, this is because of the highly subjective nature of job satisfaction but, as will be discussed below, it also depends very heavily on the way in which the information is obtained.
There are two basic teacher grades in primary schools. Grade IIIB/C teachers were first recruited during the UPE campaign in the mid 1970s. Initally, nearly all of them were primary school leavers, but during the 1980s, some were recruited after completing Form II. They attended teacher-training college for one year and completed a second year of training based in schools.
School survey
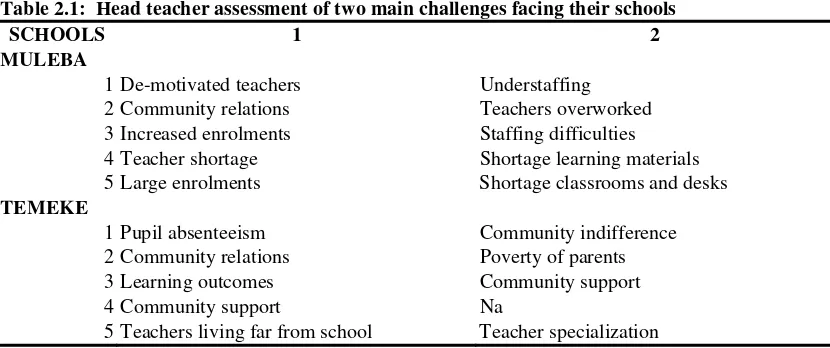
The head teacher interview began by asking, in a completely open-ended way, ‘what are the main challenges currently facing your school?’ What is interesting is that, at the urban schools in Temeke, teacher motivation and staffing issues are hardly mentioned whereas in rural schools staffing issues feature prominently (see Table 2.1).
Table 2.1: Head teacher assessment of two main challenges facing their schools
SCHOOLS 1 2
MULEBA
1 De-motivated teachers Understaffing 2 Community relations Teachers overworked 3 Increased enrolments Staffing difficulties 4 Teacher shortage Shortage learning materials 5 Large enrolments Shortage classrooms and desks
TEMEKE
1 Pupil absenteeism Community indifference 2 Community relations Poverty of parents 3 Learning outcomes Community support 4 Community support Na
5 Teachers living far from school Teacher specialization
Source: School survey
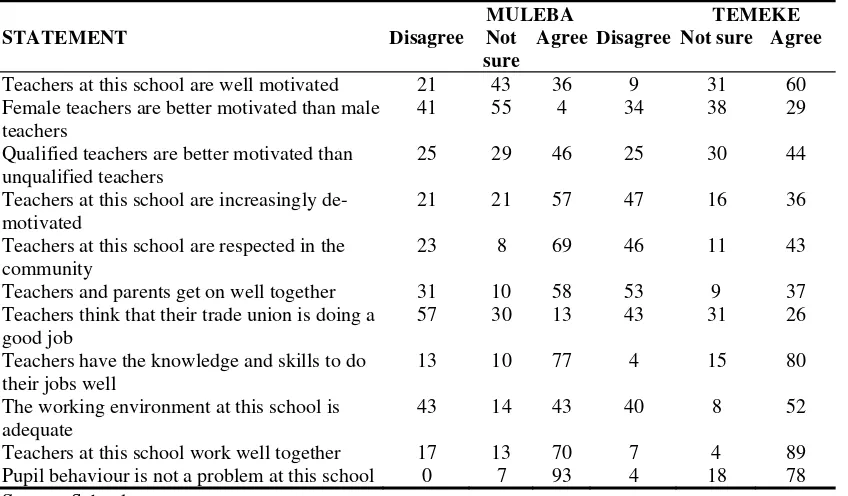
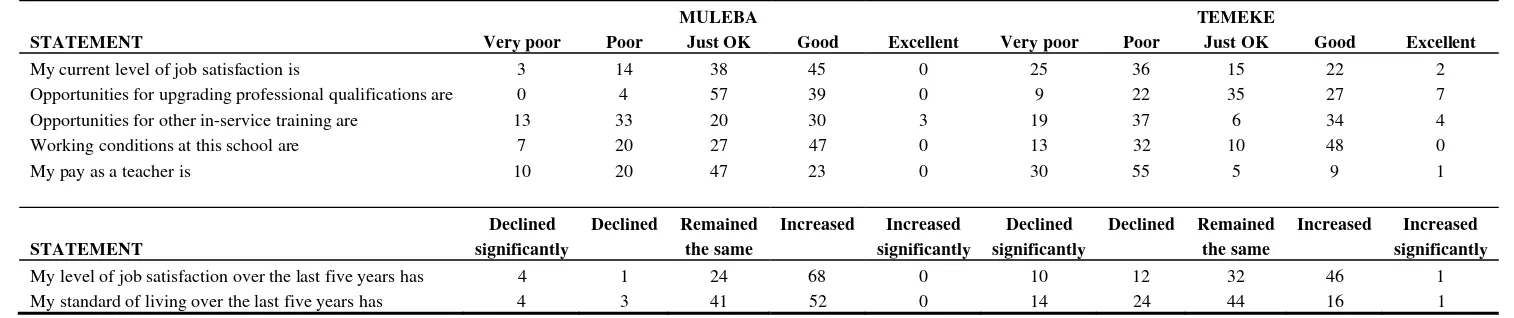
Tables 2.2 – 2.5 summarise the responses of head teachers and teachers to statements about the overall level of job satisfaction and motivation among teachers at the survey schools. Three out of the five teacher focus groups in Muleba and all five groups in Temeke agreed with the statement that ‘teachers at this school are well motivated’. Similarly, only a small minority of the teacher questionnaire respondents disagreed with this statement. However, when asked about their own levels of job satisfaction, 61 percent of these teachers in Temeke rated their level of job satisfaction as ‘poor’ or ‘very poor’ compared to only 17 percent in Muleba. A similar pattern of responses is apparent from the teacher interviews. In particular, half of the teacher interviewees in Temeke said that they are dissatisfied with their job, but only 12 percent in Muleba.
Most head teachers believe that the large majority of teachers at their schools are adequately motivated. In their opinion, only 4 percent of teachers are poorly motivated in Temeke and 24 percent in Muleba and that, given a free hand, they would dismiss only 4 percent of teachers in Temeke and 15 percent in Muleba on grounds of poor work commitment. Only two out of 10 head teachers specifically stated in their interviews that the overall level of motivation of their staff is low.
Lower levels of motivation in urban schools are apparent from teacher responses to two other key motivation indicators, namely whether they would choose to be a teacher again and their future intentions to continue working as a teacher. Whereas barely one-third of urban primary school teachers said they would make the same career choice again, over 80 percent of the rural teachers said they would. Furthermore, 60 percent of teachers in Temeke would stop teaching if they could,
Table 2.2: Teacher questionnaire responses to general statements, November 2004 (rounded percentages)
MULEBA TEMEKE
STATEMENT Disagree Not
sure
Agree Disagree Not sure Agree
Teachers at this school are well motivated 21 43 36 9 31 60 Female teachers are better motivated than male
teachers
41 55 4 34 38 29
Qualified teachers are better motivated than unqualified teachers
25 29 46 25 30 44
Teachers at this school are increasingly de-motivated
21 21 57 47 16 36
Teachers at this school are respected in the community
23 8 69 46 11 43
Teachers and parents get on well together 31 10 58 53 9 37 Teachers think that their trade union is doing a
good job
57 30 13 43 31 26
Teachers have the knowledge and skills to do their jobs well
13 10 77 4 15 80
The working environment at this school is adequate
43 14 43 40 8 52
Teachers at this school work well together 17 13 70 7 4 89 Pupil behaviour is not a problem at this school 0 7 93 4 18 78
Source: School survey
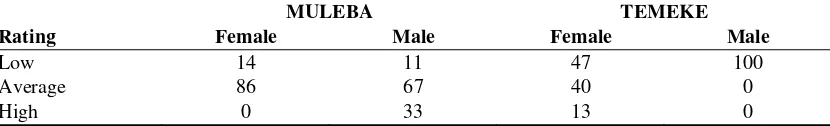
The qualification, age and gender profiles of primary school teachers could be important in explaining rural-urban variations in motivation. Table 2.6 shows that, regardless of age, overall levels of job satisfaction are low among all teachers in Temeke, but they are especially low among younger teachers. Apart from younger teachers, levels of job satisfaction are relatively high among teachers in Muleba.
Table 2.3: Teacher questionnaire responses to personal statements (rounded percentages)
MULEBA TEMEKE
STATEMENT Very poor Poor Just OK Good Excellent Very poor Poor Just OK Good Excellent
My current level of job satisfaction is 3 14 38 45 0 25 36 15 22 2
Opportunities for upgrading professional qualifications are 0 4 57 39 0 9 22 35 27 7
Opportunities for other in-service training are 13 33 20 30 3 19 37 6 34 4
Working conditions at this school are 7 20 27 47 0 13 32 10 48 0
My pay as a teacher is 10 20 47 23 0 30 55 5 9 1
Declined Declined Remained Increased Increased Declined Declined Remained Increased Increased
STATEMENT significantly the same significantly significantly the same significantly
My level of job satisfaction over the last five years has 4 1 24 68 0 10 12 32 46 1
My standard of living over the last five years has 4 3 41 52 0 14 24 44 16 1
Teacher trainees (most of whom are single) are now being mainly posted to harder-to-staff schools where it is difficult to support them as envisaged. Since they are expected to stay at these schools once they have completed their training, there is a danger that they could become quickly de-motivated.
Another key factor is the proportion of teachers who regard where they work as ‘home’. Nearly all teachers in Muleba are ‘locals’ but, in Temeke, most teachers are ‘outsiders’. Locally based teachers are more likely to have supportive extended family and social networks, be known to the community at large, and have higher levels of commitment to promoting education and development activities in the locality. In urban areas, on the other hand, the fact that most teachers are not from the immediate localities in which they teach makes it more difficult for them to establish and sustain good relations with the community and, in some instances, may lead to feelings of ‘them and us’. Urban teachers at the survey schools tend to come from better off socio-economic background than rural teachers, most of whose parents are farmers.
Table 2.4: Job satisfaction ratings among teacher interviewees, November 2004, (rounded percentages)
MULEBA TEMEKE
Rating Female Male Female Male
Low 14 11 47 100
Average 86 67 40 0
High 0 33 13 0
Source: School survey
Although gender differences in motivation levels are less apparent, around one-half of teacher questionnaire respondents in each location agreed with the statement that ‘female teachers are better motivated than male teachers’ (see Table 2.2). However, none of the teacher focus groups agreed with this statement and most head teacher interviewees stated that male teachers are better motivated! There are virtually no gender differences with respect to the teacher personal statement concerning levels of job satisfaction.
Table 2.5: Head teacher ratings of teacher motivation levels (rounded percentages)
Good Adequate Poor Would like
District to dismiss
Muleba 34 42 24 15
Temeke 57 38 4 4
Table 2.6: Poor job satisfaction by teacher age (rounded percentages)
DISTRICT <30 31-40 41-50 50>
MULEBA 75 0 17 17
TEMEKE 71 63 52 56
Source: School survey
Less than half of the teacher questionnaire respondents (Muleba 46 percent Temeke 44 percent) agreed with the statement that ‘qualified teachers are better motivated than unqualified teachers’. Only one head teacher indicated that Grade A teachers are generally better motivated than Grade B/C teachers. All but one of the five rural head teachers believes that the opposite is the case, which again is likely to be due to the older age profiles of Grade B/C teachers.
There is a broad consensus among MOEC managers and other stakeholders that most teachers are doing ‘just enough’ in class. However, poor career progression coupled with the lack of recognition and reward for superior performance is a major concern for most teachers. No action is usually taken against teachers who are performing poorly, which many teachers find de-motivating. A new appraisal system has been introduced, but there are widespread concerns that it is too complicated to be workable. The TTU’s position on the new system is that it should only be introduced once the working environment for teachers is more enabling.
Secondary school teachers
It appears that teacher job satisfaction is considerably lower among secondary teachers and that, it many ways, this does amount to a teacher motivation crisis. The 1990 World Bank survey found that, while most primary school teachers stated they had become a teacher through choice, relatively few secondary school teachers had done so. The Haki Elimu Survey reaches a similar conclusion. In the recent survey by Swai et al, only 10 percent of secondary school teachers said that they have no plans to leave and nearly half are ‘ready to leave’ straight away.
2.2 TRENDS
In the early 1990s, both the World Bank and TADGREG surveys reported that most urban and rural primary school teachers were satisfied with their jobs. If, therefore, the two school survey districts are representative of the country as a whole, it would appear that job satisfaction levels have remained high among primary school teachers in rural areas, but that they have declined quite precipitously among urban teachers.
The impact of PEDP
There are quite differing views about the impact of PEDP on teacher job satisfaction and motivation. On the hand, there are those who argue that teachers are now happier because the government is now ‘taking primary education seriously’ and that working conditions have improved appreciably during the last three years. Teacher recruitment has also expanded exponentially, which is in marked contrast to the situation in the late 1990s when the government planned to downsize significantly the overall teaching force in primary schools. More generally, PEDP has ‘identified the teacher in the classroom as the main agent for bringing about qualitative improvements in learning in primary schools’ (PEDP, 2003, p.5).
On the other hand, however, it is argued that most of the additional resources provided by PEDP have been devoted to classroom construction and textbooks and very little attention has been given to the needs of teachers. According to Professor Sumra, ‘many teachers feel demoralised. Teachers report having to shoulder much of the responsibility of the PEDP, including having to deal with enormous numbers of pupils and longer working hours, without additional compensation’ (Sumra, 2003, p.7). They also ‘complain about having little opportunity to participate in key decisions regarding plan implementation (ibid, p.3). Other leading educational experts in the country have reached similar conclusions (see, for example, Mbilinyi, 2003 and Rashad, 2003).
3.
STATUS AND VOCATIONAL COMMITMENT
Occupational status and vocational commitment are inextricably inter-related. Both are powerfully shaped by how teachers see themselves as a distinct occupational group. This identity is subject to multiple economic, social and political influences including traditional values, religious beliefs, political ideology, managerial approaches and educational philosophies and policies.
It is frequently argued that the status and vocational commitment of primary school teachers in most developing countries was high in the late colonial and early post-Independence periods, but that both have fallen significantly since then. Similar views are regularly expressed by teachers, teacher leaders, and in the media in Tanzania. Teachers during the 1970s ‘used to be revered as special, enjoying gifts from peasants excited at seeing their children read’ (Barrett, 2003, p.mm). Government attached top priority to UPE and the dual roles of ‘mwalimu’ in educating children and the development of communities were universally held in high esteem. Teachers themselves were politically committed to achieving UPE and the wider development objectives embodied in ‘Ujamma’. However, it is contended that poverty has undermined the teachers’ social status and hence seriously weakened their once strong occupational identity. Other negative factors include high levels of teacher unemployment during the 1990s, declining educational quality, and the increase in female teachers.
If vocational commitment to teaching is low, it would perhaps be better that these individuals do not stay in the profession. However, the lack of other employment opportunities means that few leave (see Chapter 6).
3.1 RESPECT FOR TEACHING
Overview
In 1990, the TADREG Survey found that three-quarters of primary school teachers regarded teaching as a ‘respected profession’. According to the Hakie Elimu Survey ‘this situation seems to have changed drastically over the last 14 years’ (p.15). However, the survey results are not consistent on this issue; Over 70 percent of teacher questionnaire respondents agreed that teachers are respected (76 percent rural, 60 percent urban), but ‘the majority of interviewees’ said that teaching is not a respected profession anymore.
The school survey also indicates that respect for primary school teachers particularly in urban areas is low. Only one teacher focus group in Temeke and two in Muleba agreed with the statement that ‘teachers are respected in the community’. Only 43 percent of the teacher questionnaire respondents in Temeke agreed with this statement compared with 69 percent in Muleba.
trained teachers are more acutely aware of the status differences between teachers and other professions. The TTU/Hakie Elimu Survey reaches the disturbing conclusion that ‘female teachers are despised in the villages’.
The stakeholder interviews highlighted a number of points concerning teacher respect. Some respondents feel that teachers are ‘treated like children’ by the MOEC and donors. As a result, teacher participation in policy development continues to remain limited. These paternalistic attitudes have been partly shaped by the limited education of UPE teachers who were recruited during the 1970s. The Tanzania Teacher Union (TTU) is also concerned that the ‘dilution’ of pre-service training with just one year of formal college training will also further lower the status of primary school teachers.
Parental and community attitudes
Teacher status is heavily influenced by the attitudes of the community towards the overall value of education and the relationship between schools and the community. Traditionally, teachers in Tanzania have had a strong sense of moral accountability. ‘Teaching is far more than a job in a school, it is a role and position in society and, as such, is associated with honour and responsibility’ (Barrett, 2004 p.13). But, as a consequence, teachers are vulnerable to parental and community opinion. ‘If the parent values the teacher and the teacher values the parent, you find that the work goes well’. In the past, most concerns about this relationship have focused on rural areas. Parents in the villages are ‘unenlightened’ and tend not therefore to support schools, which is frustrating and undermining for teachers, many of who feel that they have made considerable sacrifices by working in rural schools. The danger in these situations is that teachers end up becoming estranged from the local community and ‘look down on villagers’. A 1993 TADGREG Report noted that ‘rural parents are increasingly disenchanted with primary education…Village teachers are characterised as lacking formal training, motivation and professional integrity’ (TADREG, 1993 p.28).
Education and employment outcomes
Professional status is closely linked to client perceptions of the quality and overall value of the service that is being provided. It is frequently asserted that the perceived value of education is falling in most households in Tanzania. This is due to three factors namely, declining education quality, increased household expenditure on education,8 and deteriorating employment prospects for school leavers.
Obtaining good quality data on trends in learning outcomes is very difficult. Examination results are notoriously unreliable except where they are criterion-referenced in a rigorous manner. Primary school leaving examination results have been improving quite appreciably since the late 1990s. However, the results of independent tests administered to large samples of primary school pupils show that learning outcomes are both low and declining (see Chapter 7).
The demand for primary education is also heavily dependent on the proportion of primary school completers who are able to progress to secondary schooling, since it is this level of education that provides access to ‘good jobs’. The transition rate from primary to secondary education has doubled since the mid 1990s - from 15 to 30 percent.
While poorer learning outcomes have been counteracted to some extent by increased access to secondary education, wage employment opportunities for male secondary school leavers deteriorated appreciably during the 1990s. Interestingly, though, these opportunities have remained relatively constant for female Form IV leavers (see Mukyanuzi, 2003).
3.2 VOCATIONAL COMMITMENT
Employment of the last resort
Given the shortage of wage employment opportunities, the demand for teaching jobs is extremely high. There were 150,000 applicants for the 10,000 pre-service places at teacher training colleges in 2002. Unlike in the past, Form IV leavers now have to put teaching as one of their three top occupational preferences (out of six) in order to be selected for teacher training college. The fact that the second year of the new pre-service training course is completed in schools is also intended to discourage those who are not fully committed to a teaching as a lifelong career.
Teacher unemployment
The future employment prospects of the newly qualified teacher are a key determinant of vocational commitment. The UPE campaign during the 1970s necessitated the introduction of a crash-training programme for mainly primary school leavers who were unable to proceed to secondary school. However, pretty much all teacher trainee graduates who wanted to teach were able to find employment. Given the rapid expansion of primary education, teachers accounted for nearly 20 percent of all wage employment in Tanzania by the late 1980s.
With the advent of structural adjustment in the late 1980s, the government rapidly liberalised the economy and retrenched large numbers of public sector workers.9 However, the education sector was largely ‘protected’ from budget cuts and retrenchments. The 1999 Education Public Expenditure Review describes the education sector as an ‘employment sink’ and concludes that teacher employment was maximised at the expense of addressing other urgent resource needs of the education system, in particular classrooms and learning materials. However, with little or no increase in the total number of primary school teachers employed in government schools throughout the 1990s coupled with minimal staff attrition, only around one-quarter of teacher trainee intakes ended up working as teachers in primary schools.
3.3 OCCUPATIONAL SOLIDARITY AND POWER
Strong feelings of professional and workplace solidarity coupled with ‘industrial muscle’ can provide a significant fillip to the status and vocational commitment of an occupational group. However, both remain weak among teachers in Tanzania. A key reason for this is that teachers were only allowed to form their own independent trade union in 1993 and, even then, its powers were heavily circumscribed. In particular, until very recently, there has been no collective bargaining over pay and other conditions of service and strikes have been illegal.
Well over half of the teachers at the survey schools in Muleba and Temeke disagree with the statement that ‘teachers at this school think that their trade union is doing a good job’ (see Table 2.2). Only one teacher focus group in each location agreed with this statement. This is despite the fact that most teachers belong to the Tanzania Teachers Union and are obliged to pay a membership levy of two percent of their pay. Levels of union activity are quite low, especially in Muleba.11
A Teacher Service Commission was established in 1986 in order to support the professional interests of teachers. However, the Commission was largely ineffectual and has now been disbanded. There is also widespread confusion about who exactly is the teacher’s employer. According to the Public Service Act, the newly created Teacher Service Department in the Civil Service Department (which has replaced the TSC) is the formal ‘appointing authority’ but, with decentralisation, district and municipal councils ‘enter into contracts of service and are responsible for the payment of salaries’. At the very least, such fragmentation of key human resource functions does little to promote a sense of professionalism and occupational solidarity among teachers. Certainly, neither teachers nor their trade union want local councils to become their employer.
4. TEACHER
COMPETENCE
There are two inter-related aspects of occupational motivation- ‘will-do’ and ‘can-do’. Will-do motivation refers to the extent to which an employee has adopted the organisations goals and objectives. Can-do motivation, on the other hand, focuses on factors that influence the capacity of individuals to realise organisational goals. For example, a teacher may be highly committed to the attainment of the school’s learning goals, but she may lack the necessary competencies to teach effectively, which ultimately becomes de-moralising and de-motivating. The actual and perceived competence of primary school teachers is therefore a key issue.
4.1 OVERALL ASSESSMENT
Teachers at the rural survey schools have less formal schooling than their colleagues working at the urban survey schools; 37 percent of teachers in Muleba have only primary education compared to 25 percent in Temeke.12
All except one of the teacher focus groups agreed that ‘teachers in this school have the knowledge and skills to do their jobs well’. Similarly, only small minorities of teacher questionnaire respondents disagreed with this statement - 13 percent in Muleba and 4 percent in Temeke (see Table 2). Teacher interviewees were also generally quite satisfied with their teaching competence. Head teachers estimated that 22 percent of teachers in Muleba and only 4 percent in Temeke have ‘poor competence’ and that, given a free hand, they would dismiss only 12 percent of teachers in Muleba and 2 percent in Temeke on grounds of incompetence.
However, these views are in marked contrast to the conclusions of nearly all external assessments during the last decade of teaching and learning outcomes in primary schools. This is despite the fact that, nationally, the overall qualification profile of primary school teachers has improved appreciably since the early 1990s. In 1991, only 34 percent of teachers were Grade A but, by 2004, this figure had increased to 58 percent. Most recently, the 2004 PEDP Review Team expressed serious concerns about the overall teaching practice of primary school teachers. It concludes that ‘the overall quality of teaching is poor’ (p.34). In particular, it is mainly teacher-centred with little use of textbooks and other learning materials.
pre-preparation, the teacher- training model continues to be based on the assumption that students have adequate subject knowledge and concentrates on pedagogy.
Previous reports have made similar observations.15 The on teacher training report prepared for the Education Sector Review Development Programme noted that the ‘teacher education institutions have tended to produce half-baked teachers due to the inadequate preparation of teacher educators’ (p. 3).
4.2 IMPROVEMENT STRATEGY
Despite these concerns, the reform of the teacher training system has not been adequately addressed by the PEDP. There are three main areas where efforts are being made to improve teacher competence, namely teacher qualification upgrading, the accelerated pre-service teacher training programme, and continuous professional development.
Teacher upgrading
The competence of Grade B/C has been consistently identified by external reviews as a serious constraint to the attainment of effective learning outcomes. The reliance on primary school leavers during the UPE era led to a ‘cascade of criticism from parents and government officials’ (Sumra, 2004, p. 29). To make matters worse, these teachers were trained ‘haphazardly in order to meet the demands of the time’ (ERSDP, 2000, Annex 12 p.12).
In order to resolve this problem, in 1999, the MOEC announced that all Grade B/C teachers would be given five years to upgrade their qualification to Grade A. Failure to do so would lead to dismissal. However, most of these teachers have only been able to enrol on an in-service distance learning programme, which is poorly resourced, and most have struggled to find the time to meet course requirements. Consequently, dropout rates have been high and pass rates low, which is demoralising for teachers. Currently, 25,000 (i.e. 50 percent) of Grade B/C teachers are upgrading to Grade A. However, given the acute shortage of primary school teachers that has resulted from the rapid expansion of primary school enrolments between 2001 and 2003, the 1999 upgrading policy has been effectively shelved. Even so, it has engendered considerable anxiety among many of the targeted teachers.
Around one-third of teachers in Temeke are not happy with the opportunities for upgrading their professional qualifications compared to only 4 per cent in Muleba (see Table 2.3). This is probably because most teachers in Temeke are Grade A and the scope for upgrading to diploma level is limited. It should also be pointed though that over 80 percent of teachers in both locations are currently studying for further qualifications of one sort or another, which reflects the strong desire on the part of most teachers to advance their careers.
Accelerated pre-service teacher training
To meet the rapidly growing need for fully qualified primary school teachers, an accelerated training programme has replaced the traditional, college-based, pre-service training course. Since 2002, teacher trainees spend only one year in college (instead of two) and are then posted to schools for supported on the job training for another year. Teacher trainees are given substantive teaching responsibilities and are paid 80 percent of the Grade ‘A’ starting salary.
The TTU sees this new 1+1 crash training programme as part of a wider attempt by government and the donors to reduce the income and power of teachers. In particular, the union believes that only one year of formal study in college is far too short to establish a strong sense of teacher identity and professionalism. The 2004 PEDP Review Team also has serious concerns about the programme. In particular, the previous two-year curriculum has been crammed into one year, (which means that there is insufficient subject content), teachers are not adequately supported and mentored (particularly by their colleges during the second year), and their teaching allowances are paid very late. Most trainees ‘are very fearful of being posted to remote schools and being forgotten’ (p. 36).
Continuous professional development
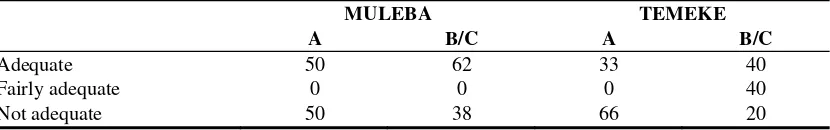
It is MOEC policy that teachers should receive an average of ten days of in-service training a year. However, for most teachers, in-service training remains very patchy, poor quality, and ad hoc. The accelerated, pre-service training programme is also increasingly crowding out in-service training activities at the teacher training colleges. The 400 teacher resource centres are ineffective mainly because they lack operational budgets.
Table 4.1: Teacher interviewee ratings of in-service training Provision by grade (rounded percentages)
MULEBA TEMEKE
A B/C A B/C
Adequate 50 62 33 40
Fairly adequate 0 0 0 40
Not adequate 50 38 66 20
Source: School survey
5.
WORKING AND LIVING CONDITIONS
The overall quality of the environment in which teachers live and work powerfully influences overall levels of job satisfaction and motivation. This is even more so when, as is the case in Tanzania, teachers often have little choice about where they work. There are many contributory factors that create a good work environment. In schools, the most important are the size and quality of classrooms, teacher workloads (number of pupils in each class and teaching and other activities), pupil behaviour, teacher management and support and living conditions.
5.1 OVERALL ASSESSMENT
The 1990 World Bank study highlighted the ‘harsh professional environment’ in which teachers have to work. The study also concluded that most teachers find poor working conditions ‘more discouraging than their salary levels’ (p. 22).
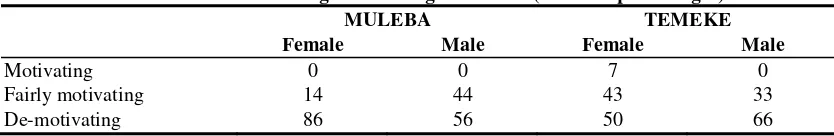
The results of the school survey suggest that poor working conditions can be just as trying for teachers working in urban schools as in rural schools. Nearly half of the teacher questionnaire respondents in Temeke rated their own working conditions as ‘very poor’ or ‘poor’ compared to only one-quarter in Muleba (see Table 2.3). The responses of the teacher focus groups and the teacher questionnaire respondents to a similar statement (‘the working environment at this school is adequate’) are also indicative of high levels of discontentment. Only one group in Temeke and two in Muleba agreed with this statement. Well over half of the teacher interviewees in both locations rated their working conditions as ‘de-motivating’ (see Table 5.1). Women teachers in Muleba are particularly unhappy.
Table 5.1: Teacher interviewee ratings of working conditions (rounded percentages)
MULEBA TEMEKE
Good working relations between teachers are a key motivator, particularly for teachers posted to more remote and difficult locations. All the teacher focus groups (except one in Muleba) agree with the statement that ‘teachers at this school work well together’. There is also a high level of agreement among the teacher questionnaire respondents.
5.2 SCHOOL LOCATION AND INFRASTRUCTURE
urban schools. As one teacher in Temeke put it,‘the school compound is no good because it is always penetrated by thugs and other unwanted people’. Classroom construction in rural areas has to date still been quite limited. For example, only one of the schools in Muleba has attractive buildings.
5.3 TEACHER WORKLOAD
Except for Standards 1 and 2, specialised subject teachers are responsible for all teaching in primary schools in Tanzania. This is quite unusual since class teachers are the norm in most primary school systems in sub-Saharan Africa and elsewhere. It is perhaps surprising therefore that, as part of PEDP, subject teaching has been extended to Standards 3 and 4. As with secondary school teachers, subject teachers tend to have relatively low teaching loads compared to class teachers who usually spend most of the school day with their own class.
Reaching robust conclusions about the level and trends in teacher workloads is quite complicated. A lot of detailed information is required about what teachers actually do each day, which can only be obtained with any real accuracy over relatively long, multi-day visits to representative schools. Although this kind of research has never been undertaken in Tanzania, there is nonetheless a widespread perception that primary school teachers have relatively light workloads. This was certainly a key conclusion of the 1990 World Bank study. However, many argue that PEDP has led to a significant intensification of teacher’s work mainly as a result of larger classes and the introduction of double shifting. There have been repeated calls for the ‘rationalisation’ of primary teaching loads. A target of 40 periods per week (27 hours) is now official policy.
School and class size
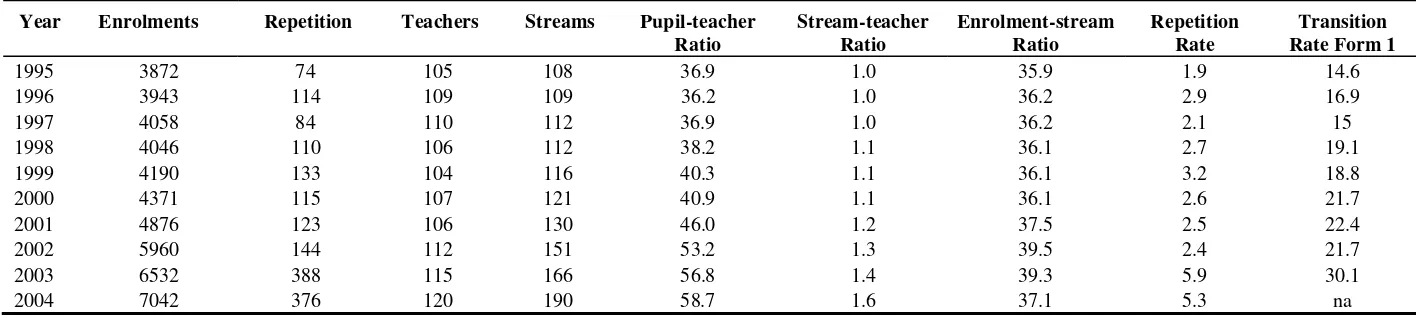
The official pupil-teacher ratio norm is 45. The national PTR increased by exactly 50 percent - from 38 to 59 - between 1998 and 2004 (see Table 5.2). The main reason for this is that primary school enrolments increased by 74 percent, but the total number of teachers in post increased by only 13 percent. The PTRs at the survey schools are almost the same (59 Muleba, 61 Temeke). However, PTRs are as high as 90 in some districts (see Chapter 7).
Table 5.2: Total enrolments, repeaters, teachers and streams at primary schools, 1995-2004 (rounded '000)
Year Enrolments Repetition Teachers Streams Pupil-teacher Ratio
Stream-teacher Ratio
Enrolment-stream Ratio
Repetition Rate
Transition Rate Form 1
1995 3872 74 105 108 36.9 1.0 35.9 1.9 14.6 1996 3943 114 109 109 36.2 1.0 36.2 2.9 16.9
1997 4058 84 110 112 36.9 1.0 36.2 2.1 15
1998 4046 110 106 112 38.2 1.1 36.1 2.7 19.1 1999 4190 133 104 116 40.3 1.1 36.1 3.2 18.8 2000 4371 115 107 121 40.9 1.1 36.1 2.6 21.7 2001 4876 123 106 130 46.0 1.2 37.5 2.5 22.4 2002 5960 144 112 151 53.2 1.3 39.5 2.4 21.7 2003 6532 388 115 166 56.8 1.4 39.3 5.9 30.1
2004 7042 376 120 190 58.7 1.6 37.1 5.3 na
Teaching load and working hours
According to the1990 World Bank study, primary school teachers taught for an average of only 16 hours each week in urban schools and 19 hours in rural schools. When all other activities are included (in particular preparation and marking), the overall workload was 27 hours in urban and 32 hours in rural primary schools. As civil servants, teachers are expected to work a 35-hour week. The report notes that ‘increasing workloads could have important benefits. If teachers taught more hours a week, fewer of them would be needed and the resulting budgetary savings could then be used to increase teacher’s salaries. Also, more classes could be added, enabling more students to attend school’ (p. 19).
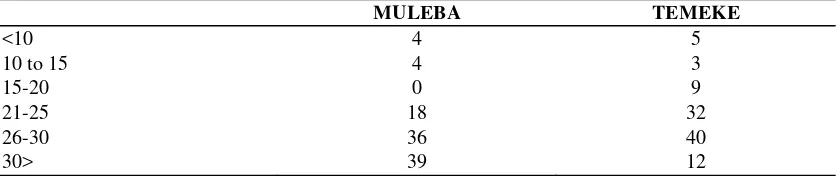
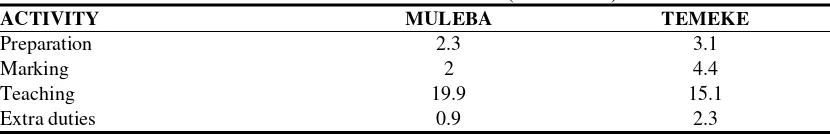
The average number of teaching periods per week at the survey schools is 30.4 (19.9 hours) in Muleba and considerably less than this - 23.9 periods (15.1 hours)- in Temeke.16 Nearly 40 percent of teachers in Muleba teach more than 30 periods, but only 12 percent of teachers in Temeke (see Table 5.3). If these two districts are representative of rural and urban locations then it would appear that the teaching load has decreased slightly in urban schools and increased slightly in rural schools since 1990. The total workload reported by teachers in both locations is 25-26 hours, which in the case of Muleba is appreciably lower than the 32 hours reported for rural primary schools in 1990. Rural primary school teachers may be compensating for higher teaching loads by reducing the amount of time on other activities, in particular preparation, marking and extra-curricular activities (see Table 5.4). More generally, ‘the understaffing of rural schools results in the timetable slipping to an alarming extent. Classes are frequently unattended by teachers and children spend much of the afternoon playing outside’ (Barrett, 2004b).
Table 5.3: Percentage breakdown of weekly periods taught at survey schools
MULEBA TEMEKE
<10 4 5
10 to 15 4 3
15-20 0 9
21-25 18 32
26-30 36 40
30> 39 12
Source: School survey
for teachers with relatively large teaching loads. The teaching load of Grade C teachers in Muleba is also relatively high. Further research is needed in order to establish if this is typical in rural areas.
Table 5.4: Time allocation between teacher work activities (hours/week)
ACTIVITY MULEBA TEMEKE
The Cooksey Survey found that one-quarter of primary schools were operating double shifts in 1990. EMIS data suggests that the incidence of teachers having to work more than one shift has increased appreciably since then. In particular, the stream-teacher ratio for all primary schools rose from 1.1 in 2000 to 1.6 in 2004. However, the length of each shift is now typically only around four-five hours at most schools.17
Most of the survey schools were operating a double shift. However in Temeke, only I in 10 of the teachers stated that they were teaching in more than one shift compared to one in five teachers in Muleba.
Over and under staffing
The formula for calculating the number of streams and thus teachers in each primary school is based on the PTR norm of 45.18 Given the continuing shortage of classrooms, urban teachers tend to have larger classes, but lower teaching loads. Because urban primary schools tend to be so overcrowded, this gives the impression that teachers at these schools have to work harder, when in fact this is generally not the case. Typically, teachers in urban primary schools spend more time in the staff room marking exercise books and preparing lessons than they spend in the classroom.
5.4 PUPIL BEHAVIOUR
In some countries, particularly in Europe and North America, pupil misbehaviour is a major de-motivator for teachers, which can lead to very high rates of teacher stress and attrition. In Tanzania, this does not appear to be such a burning issue. While most of the teacher focus groups in Muleba and Temeke disagreed with the statement that ‘the behaviour of pupils in class is not a problem for teachers at this school’, nearly all teacher questionnaire respondents agreed with this statement and teacher interviewees rarely mentioned pupil behaviour.
17
1100-Pupils at rural primary schools are generally well behaved. In urban areas, teachers have more trouble controlling the movements of pupils in and out of the school, especially where schools do not have adequate security fences, which is still common.
5.5 TEACHER MANAGEMENT
The quality of management at all levels (school, district, region and Ministry headquarters) is critically important in ensuring that teachers are adequately motivated. Management effectiveness is the combined outcome of management systems and the commitment and competence of individual managers. Teachers in most rural schools feel particularly isolated, which in turn increases the importance of good school management. As noted early, younger teachers posted to rural schools often have a strong fear of being forgotten.
Considerable scope exists to improve the management capacities of head teachers at the survey schools. A key reason for this is that head teachers have generally received little or no good quality management training.19 Only one of the schools in Temeke was exceptionally well managed and the impact that this has on teacher motivation and performance is clearly evident. In Muleba, no quality management was clearly observable at any of the survey schools.
Teacher interviewees at eight out of the ten survey schools are averagely satisfied with how their schools are managed. Seven out of the 10 teacher focus groups (two in Temeke and one in Muleba) disagreed with or were not sure about the statement that ‘teachers in this school are well managed.’ Similarly, only 43 percent and 18 percent of teacher questionnaire respondents agreed with this statement in Muleba and Temeke respectively (see Table 5.5). However, the large majority of these respondents still feel that their ‘head teacher leads by example’ and that they do not spend too much time away from schools either on official duties or doing their own private business. Most also agreed with the statement that ‘the head teacher regularly observes classes at this school’.
School governance
Table 5.5: Teacher questionnaire responses to management-related statements (rounded
Teachers at this school are well managed 13 43 43 26 55 18
Our head teacher leads by example 11 4 86 11 11 78 Our head teacher is often away from school on
official duties
46 4 50 65 16 19
Our head teacher is often away from school on private business HIV/AIDS has not had a big impact on teachers at
this school
17 21 62 9 32 60
Teachers at this school come to work hungry 57 32 11 38 41 21 Teacher absenteeism is not a problem at this
school
52 11 37 37 14 49
Teachers at this school come to work on time 17 0 83 7 10 83
Source: School survey
System management
There are longstanding concerns about the overall management of the public education system in Tanzania. One stakeholder interviewee described the public education system as ‘a circus without a ringleader’. Basic functions are poorly managed. Teachers are particularly disgruntled about the payment of salaries and allowances (see Table 5.5).
The 1990 World Bank report noted that the Inspectorate is well staffed and that most teachers are inspected annually. Most teacher questionnaire respondents in both locations agreed with the statement that ‘inspectors regularly visit this school’. However, stakeholder interviewees (including inspectors) stated that staffing shortages and other resource constraints (most notably transport) prevent most primary school inspectors making regular visits to rural schools. Primary school inspectors are based in districts. Most have to endure poor working conditions and lack suitable transport to be able to visit schools as prescribed. Consequently, teachers are isolated and are under relatively little pressure to perform.
5.6 LIVING CONDITIONS
The living conditions for most teachers are unsatisfactory and, for many, they are ‘intolerable’. The availability of reasonable quality and affordable housing within easy travelling distance of the school is a key issue for nearly all teachers.
Marital status and spouse separation
A sizeable majority of teachers in both Muleba and Temeke are married and are living with their spouses (see Table 5.6). However, over one-third of female teachers working at schools in Muleba are, for whatever reasons, separated from their spouses, which could be an important de-motivator.
Table 5.6: Marital status of teachers at survey schools (rounded percentages)
MULEBA TEMEKE
Female Male Female Male
Married 64 89 74 64
Living with spouse 63 84 79 78
Source: School survey
Housing
Housing conditions for primary school teachers are generally poor. The scarcity of ‘decent accommodation’ is a constant refrain of nearly all reports, both official and by independent researchers. The 1990 World Bank report states that ‘typically, rural primary teachers live in dilapidated, poorly-maintained school or government accommodation on or near the school compound’. The TADREG Survey similarly concludes that ‘most houses are in a sorry state of disrepair’.20
Almost all teacher interviewees and head teachers at the survey schools commented on the lack of decent housing. Only 2 percent of teachers at these schools are housed (Muleba 3.4 percent, Temeke 1.7 percent). Most inspector reports also highlight teacher complaints about their housing conditions.21
To date, PEDP has also failed to tackle the housing issue. During 2003 and 2004, only around 20 percent of the housing budget was disbursed.22 Numerous reasons are advanced for this ‘woeful performance’ (p. 28) and the serious imbalance between the number of classrooms and houses built. The lack of political commitment is a major factor. Both politicians and community leaders tend to be mainly interested in building classrooms. Some even suggest that communities are resentful of teachers being accommodated in better houses than their own. Understandably, local teachers usually prefer to stay in their own homes.
Travel to school
Many teachers have to commute long distances between home and school, which is time-consuming, costly and tiring. This issue is particularly acute for urban teachers. The TADGREG Survey found in 1990 that only around one-third of urban teachers lived near their school compared to three-quarters among rural teachers. The average distance from home to school is 10 kilometres for teachers at the Temeke survey schools, but only three kilometres in Muleba. Consequently, nearly all teachers in Muleba walk to school whereas over half of teachers in Temeke have to commute by bus.
Medical aid
Teachers in Temeke, complained bitterly about the government’s medical aid scheme, to which they are obliged to contribute 3 percent of their salary. The quality of the service they receive at government health facilities is very poor, especially because drugs prescribed to them are not available. However, teachers in Muleba were a lot more positive about the scheme mainly because the locally assigned hospitals provide a reasonably good service.
5.7 THE IMPACT OF THE AIDS EPIDEMIC
The AIDS epidemic in the worst affected countries in Africa is expected to lower seriously the morale and productivity of teachers as a result of higher levels of morbidity (sickness) and mortality. Even for teachers who are not directly affected, workloads are likely to increase as teachers are asked to cover for sick colleagues who are no longer able to work on a regular basis.
considerably across the country. Six regions (Dar es Salaam, Iringa, Kagera, Mbeya, Morogoro, and Mwanza) accounted for 54 percent of all deaths in 2004, but employed only 38 percent of all teachers. Iringa Region had the highest mortality rate of 1.7 percent and Arusha and Manyara the lowest with 0.2 percent.
The results of the Adult AIDS Mortality Study since the early 1990s also show that the impact of the epidemic is highly variable. In Dar es Salaam, 62 percent of female and 50 percent of male deaths were AIDS-related in 2003, but in Morogoro, the corresponding figures were only 23 percent and 27 percent respectively (see AAMP, 2004).
Although HIV prevalence rates are believed to be much higher among females, there was hardly any difference between female and male mortality rates among primary school teachers in 2004. In fact, male mortality rates were much higher throughout the 1990s.
6.
PAY AND OTHER BENEFITS
Surprisingly little analysis of teacher remuneration has been undertaken in Tanzania. In part, this may be because there has been no collective bargaining over pay. To date, the TTU has been mainly preoccupied with allowances rather than the level and structure of basic pay.
6.1 PAY LEVELS
Net pay
The net starting salary of a Grade IIIA primary school teacher is currently T.Sh. 69,000 per month (US$60.6). The average net salary was higher in the rural survey schools (T.Sh. 97,000 compared to T.Sh. 90,400) because rural teachers tend to have more work experience. .
Take home pay increases only very slowly with experience so that a primary school teacher with over 30 years experience earns, on average, only 75 percent more than a newly qualified teacher. However, the average net earnings of Grade C teachers at the survey schools are 20 percent higher than Grade A teachers mainly because they generally have more years of teaching service and promotion prospects have been relatively good for primary school teachers as whole.24 The difference between gross and net pay is around 30 percent for the highest paid teachers, but only 5 percent for those with less than five years experience. Data is not available, but “fresh” primary school teachers probably earn around 40 percent less than newly qualified secondary school teachers. Little is known about teacher pay at private schools although elite international schools pay two-three times more than in government schools.
All teacher and head teacher interviewees indicated that teacher salaries are inadequate. However, while 85 percent of teacher questionnaire respondents at the Temeke survey schools rated their pay as ‘very poor’ or ‘poor’, only 30 percent did so in Muleba (see Table 2.3). The main reason for this difference in response is the much higher cost of living in urban areas, and Dar es Salaam in particular. Average household monthly expenditure is nearly 2.5 times the average monthly net teacher salary in Temeke (T.Sh. 231,000) compared to 1.2 times for teachers in Muleba (T.Sh.124,000).25 Expenditure on some major items (particularly food, housing and transport) is at least twice as high for teachers in Dar es Salaam (see Table 6.1). Teacher’s earnings only reach the official Minimum Living Wage of T. Sh. 85,100 (in 2004) after 10-15 years of service. Teachers, especially those in urban areas, manage to survive because other household members are in wage employment26 or teachers
24 In the past, secondary school teachers have been resentful of the better promotion prospects
enjoyed by primary teachers
25
According to the 2000/01 Household Expenditure Survey, mean monthly household
themselves earn additional income from private tuition and other types of secondary employment (see Chapter 7).27
Table 6.1: Average monthly expenditure by major item among teachersat survey schools (T.Sh. rounded '000)
Around one-third of teacher questionnaire respondents and (all the focus groups) in Temeke agreed with the statement that ‘teachers sometimes come to school hungry’. In Muleba, only 20 percent agreed with this statement (see Table 6.1).
The influential 2002 World Bank study on the financing of Education For All in developing countries argues that, as a general norm, teacher’s pay in low income developing countries should, on average, be equal to 3.5 times Gross Domestic Product per capita (see Bruns et al, 2002). Average net pay among teachers at the survey primary schools is T.Sh. 96,600, which is 3.3 times GDP per capita. However, given that current pay levels are so far below survival income levels for most teachers, the World Bank salary norm is not helpful in the Tanzanian context. The 2003 PEDP Review also notes that ‘there is no strong evidence that teachers are overly compensated for their qualifications and skills in the context of the Tanzanian labour market, particularly with regard to the pay structure of civil servants’ (p. 5).
remuneration substantially are simply too large. Personnel emoluments already account for 90 percent of total recurrent expenditure for primary schools. An important policy target is to reduce this to 80 percent by 2005, which ‘may entail retrenchment’.
Allowances
No sizeable allowances, most notably for housing and transport, are currently paid to primary school teachers in Tanzania. However, this has not always been the case. During the 1980s, teachers received a ‘teaching allowance’, which was around 50 percent of their basic salary. The government removed this allowance in 1989. In the early 1990s, teachers still received a housing allowance of 10 percent of their salary.
Teachers also complain that they are not paid anything extra for teaching double shifts. According to the 2003 PEDP Review Team ‘agreed actions’ by the government include ‘the gradual provision of incentives to teachers involved in double shift teaching’, but, to date, this has not been implemented.
6.2 PAY RELATIVITIES
Teacher pay differentials
In accordance with the principles of Ujamaa, the Nyerere Government adopted an egalitarian wage policy during the 1970s. As a result, the salary differential between teachers with the lowest qualification (Grade B) and the highest (science degree) fell from 2.4 to 1.6 between 1978 and 1990. Lower level teachers gained most from the salary awards that were made during the late 1980s. Thus, the 1990 World Bank Report concluded that ‘the highest priority is to increase the salary differentials between primary and secondary school teachers’.
Relative pay
Teachers’ pay compares favourably with other civil service occupations. Table 6.2 shows that in the early 1990s the starting (gross) pay of Grade ‘A’ primary teachers was the same as or less than equivalent posts in the health and agriculture sectors, but by 2004 their pay was higher. Thus, it appears that, if anything, the government has been giving preferential treatment to teachers. However, it is argued that teachers have fewer opportunities for job-related secondary income activities (see Chapter 7).
Trends
that their standard of living had declined during the last five years. Once again, this highlights the very difficult living conditions for teachers in the capital.
Table 6.2: Teacher starting pay compared with equivalent occupations in the public sector (T.Sh. '000/month)
1990/91 1995/96 2000/01 2004/05
Teacher Grade A 4.5 19.6 51.5 87.1
Teacher Diploma 5 20.7 55.1 108.8 Teacher Degree 5.5 22.5 69 140
Nurse 3.7 19.6 44.3 80.6
Nursing officer 4.5 20.7 48.1 107.9 Assistant medical officer 6.6 24.1 73.6 139.4
Doctor 7.6 25.9 112 210.7
Agriculture assistant 4.5 20.7 48.1 80.6 Assistant agriculture officer 4.5 20.7 48.1 80.6 Livestock officer (degree) 7.4 22.5 112 178.7 Agricultural officer (degree) 6.6 24.1 73.6 139.4
Assistant accountant 4.5 20.7 48.1 107.9 Accountant (degree) 5.5 22.5 67 139.4 Economist (degree) 5.5 22.5 67 139.4 Administrative officer (degree) 5.5 22.5 67 139.4
Source: Civil Service Department
6.3 SALARY ADMINISTRATION
Teachers are resentful about the late payment of salaries and allowances (for leave and transfers). This is particularly the case in rural areas such as Muleba where not only are salaries generally paid late, but teachers have to travel to District Education Offices to pick up their salaries, which is costly both in terms of time and money.29 Teachers frequently have to queue up in front of a small hatch, which most find undignified and humiliating.
Government has given a commitment that teachers will be paid on time on the 25th of every month. However, three-quarters of the teachers at the survey schools in Muleba and 40 percent in Temeke did not receive their pay until after the 5th of the following month. A common feeling among teachers is that ‘teacher salaries and allowances should be paid on time in order to show that the government cares’
Late payment has resulted in sizeable arrears, which the MOEC is having difficulty
administration for teachers.31 The TTU submission to the Committee highlighted teacher concerns in three major areas:
Poor communication channels: Four government institutions ministries (MOEC, RALG, CSD, MoF) have responsibilities for handling teacher personnel issues.
Inadequate remuneration: Unpaid teachers’ allowances have become a burning issue. A good proportion of ‘other charges’ for teachers end up being paid to district development directors, district commissioners, and education officials. These constitute a substantial part of the budget which otherwise be paid for teacher allowances. Nor do teachers receive transport and subsistence allowances when they are posted to a new school. Teachers are also expected to sign payroll slips without knowing exactly the value of their gross salaries and thus are unable to verify exactly whether they are receiving the correct net pay. Sometimes it takes up to nine months for a newly appointed teacher to receive their first salary payment.
7.
IMPACT ON SERVICE DELIVERY
As with any other occupational group, pay, working and living conditions and other incentives determine the level and patterns of motivation among teachers. Incentives also powerfully influence the deployment of teachers to schools across the country. It is widely believed that low levels of job satisfaction and motivation are adversely affecting teacher behaviour in Tanzania, which in turn is resulting in lower quality education. Demoralised teachers are likely to want to find another occupation, be absent or late to work, and not do what is expected of them in the classroom in order to meet the learning needs of their pupils. They may even engage in unethical behaviour, such as excessive drinking and sexual relationships with pupils.
This chapter considers the extent to which these concerns can be substantiated both with respect to teacher deployment and key aspects of teacher behaviour, most notably resignations, absenteeism, indiscipline and learning outcomes.
7.1 TEACHER DEPLOYMENT
The major staffing challenge for public education systems in most low-income developing countries is how to achieve an equitable spatial distribution of teachers between rural and urban areas. The perceived unattractiveness of working in rural schools is usually compounded by the lack of additional incentives for teachers to work in these locations. As a consequence, rural schools generally have relatively less qualified and experienced teachers, teacher turnover is higher and, with higher vacancy rates, teachers have to work harder than their colleagues in urban schools.
It is difficult to analyse deployment issues in Tanzania mainly because it is not possible to breakdown schools by rural and urban locations using EMIS data. However, almost all major reviews and education policy documents comment on the serious problems caused by poor teacher deployment. Most recently, the 2004 PEDP Review Team observes that, generally speaking, ‘the proportions of Grade ‘A’ teachers and female teachers decrease as one moves away from district centres’ (p.35).