Static beacons based indoor positioning
method for improving room-level accuracy
School of Electrical Engineering
Thesis submitted for examination for the degree of Master of Science in Technology.
Espoo 28.4.2015
Thesis supervisor:
Prof. Jyri Hämäläinen
Thesis advisor:
Author: Ville Miekk-oja
Title: Static beacons based indoor positioning method for improving room-level accuracy
Date: 28.4.2015 Language: English Number of pages:9+78 Department of Communications and Networking
Professorship: Networking technology Code: S-38 Supervisor: Prof. Jyri Hämäläinen
Advisor: D.Sc. (Tech.) Timo Vanhatupa
Demand for indoor positioning applications has been growing lately. Indoor po-sitioning is used for example in hospitals for patient tracking, and in airports for finding correct gates. Requirements in indoor positioning have become more strict with demands for a higher accuracy.
This thesis presents a method for improving the room-level accuracy of a posi-tioning system by using static beacons. As a static beacon, Bluetooth low energy modules will be used to test how much they can improve room-level accuracy on top of an existing positioning system. First, base technologies used in indoor positioning are reviewed. These include but not limited to: WLAN, Bluetooth and Ultra-wideband. Then, general indoor positioning are reviewed. After that, Ekahau positioning system will be introduced, as it is used as the base positioning system in the proposed method. The Ekahau positioning system applies WiFi networks and a fingerprinting method.
Next, tests and their results in the thesis are shown. In the first test, a received signal strength of a static emulated WiFi AP is measured indoors to study radio signal behaviour indoors and to investigate whether the proposed method could improve the room-level accuracy. Then in the second test, the proposed method is presented and tested with the Ekahau positioning system. The results showed that it is possible to improve the room-level accuracy by using static beacons.
Keywords: Indoor positioning, Bluetooth low energy, room-level accuracy, WLAN fingerprinting
Tekijä: Ville Miekk-oja
Työn nimi: Sisätilapaikannusmenetelmä huonetarkkuuden parantamiseksi käyttäen staattisia radiomajakoita
Päivämäärä: 28.4.2015 Kieli: Englanti Sivumäärä:9+78 Tietoliikenne- ja tietoverkkotekniikan laitos
Professuuri: Tietoverkkotekniikka Koodi: S-38 Valvoja: Prof. Jyri Hämäläinen
Ohjaaja: TkT Timo Vanhatupa
Sisätilaipaikannusta hyödyntäville sovelluksille on ollut nouseva kysyntä. Tällä hetkellä sisätilapaikannusta käytetään muun muassa sairaaloissa muistiongelmista kärsivien potilaiden seuraamiseen, ja lentokentällä oikean lentoportin löytämiseen. Sisätilapaikannussovellusten vaatimukset ovat samalla kasvaneet. Tarkkuudessa, ja eritoten huonetarkkuudessa on ollut parantamisen varaa.
Tässä työssä esitetään menetelmä huonetarkkuuden parantamiseksi käyttämällä staattisia radiomajakoita. Radiomajakkana työn testeissä käytetään Bluetooth low energy -moduulia. Bluetooth low energy -moduulia testataan Ekahau paikannusjärjestelmän kanssa, nähdäksemme parantuuko huonetarkkuus modu-ulia käytettäessä.
Esiksi työssä esitetään teknologioita, joiden päälle monet sisätilapaikannus-menetelmät rakennetaan. Näitä ovat muun muassa WLAN, Bluetooth ja Ultra-wideband. Sen jälkeen käsitellään sisätilapaikannusmenetelmiä, jotka käyttävät edellä mainittuja teknologioita. Sitten esitellään Ekahaupaikannusjärjestelmä, jota käytetään tulevissa testeissä. Ekahaupaikannusjärjestelmä käyttää hyödyk-seen WLAN:ia, ja perustuu menetelmään nimeltä fingerprinting.
Lopuksi esitellään työssä tehdyt testit. Ensimmäisessä testissä mitattiin emu-loidun WiFi -tukiaseman lähettämien signaalien voimakkuutta sisätiloissa. Testin tarkoituksena oli tutkia radiosignaalien käyttäytymistä sisätiloissa ja sitä, kuinka hyvät mahdollisuudet työssä esitetyllä menetelmällä voi olla parantaa tarkkuutta. Testin tulokset olivat positiivisia. Toisessa testissä testattiin huone-tarkkuutta käyttäen Bluetooth low energy moduulia Ekahaun paikannusjär-jestelmän kanssa. Testiskenaarion tuloksena oli, että huonetarkkuutta onnistuttiin parantamaan käyttämällä staattisia radiomajakoita.
Preface
I want to thank my Professor Jyri Hämäläinen for the continuous support I’ve got related to this thesis and work at Aalto in general.
I wish to express my sincere thanks to Ekahau for giving me this wonderful oppor-tunity to do my thesis about indoor positioning. I want to thank my advisor Timo Vanhatupa, and my mentor Johannes Verwijnen, for all the guidance you gave me. Last, I want to thank my family for supporting me throughout my studies.
Otaniemi, 28.4.2015
Contents
Abstract ii
Abstract (in Finnish) iii
Preface iv
Contents v
Symbols and abbreviations vii
1 Introduction 1
1.1 Thesis scope and objectives . . . 1
1.2 Thesis structure . . . 2
2 Technologies used in indoor positioning 3 2.1 Wireless Local Area Networks . . . 3
2.2 Bluetooth . . . 4
2.2.1 Bluetooth Low Energy . . . 4
2.2.2 Bluetooth and positioning . . . 4
2.3 Radio Frequency IDentification . . . 5
2.4 Ultra-wideband . . . 7
2.5 Inertial Measurement Unit . . . 8
2.5.1 Gyroscope . . . 8
2.5.2 Accelerometer . . . 8
2.5.3 Magnetometer and barometer . . . 10
3 Indoor positioning methods 11 3.1 Trilateration . . . 11
3.2 Angulation . . . 13
3.3 TOA and TDOA . . . 15
3.4 RSSI-based ranging . . . 16
3.5 Fingerprinting . . . 17
3.5.1 Offline phase . . . 17
3.5.2 Online phase . . . 20
3.6 Filtering . . . 23
3.6.1 Simple filtering with error estimate . . . 23
3.6.2 Particle filter . . . 26
4 Indoor Propagation 28 4.1 Basic radio wave propagation mechanisms . . . 28
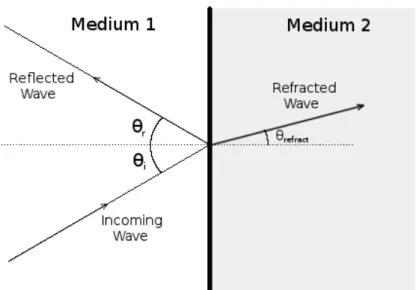
4.1.1 Reflection and refraction . . . 28
4.1.2 Diffraction . . . 29
4.2 Shadowing and multipath fading . . . 29
4.3 Indoor Propagation Models . . . 31
4.3.2 Physical path loss models . . . 32
5 Ekahau Positioning System Architechture 33 5.1 Ekahau Site Survey . . . 33
5.2 Ekahau Real-Time Location System Controller (ERC) . . . 35
5.3 Ekahau Tags . . . 36
6 Test scenarios and results 39 6.1 RSS measurements . . . 39
6.1.1 Methodology of the RSS measurements . . . 39
6.1.2 Results and analysis of the RSS measurements . . . 43
6.2 Room-level accuracy test . . . 46
6.2.1 Deployment of the Ekahau Positioning system . . . 47
6.2.2 Integration of a BLE beacon to the system . . . 50
6.2.3 Test scenario and test survey . . . 53
6.2.4 Results and analysis of the room-level accuracy test . . . 55
7 Summary and future work 59
References 61
Appendices 66
A DumpToText Java program 66
B RSS analysis R-script 69
C Full results of the RSS measurements 71
D BLE Scanner Android software 73
Symbols and abbreviations
Symbols
af Attenuation factor for a floor
aw Attenuation factor for a wall
Bel(st) Belief, that a system is at state st
c Speed of light in a vacuum ≈3×10⁸ [m/s] dist(li, le) Distance function
dq Minkowski distance
D Distance between an anchor node and a located device E(le|x) Positioning error estimation
f Frequency of a signal
fX(x) Gaussian probability density function
Gr Located device’s antenna gain
Gt Anchor node’s antenna gain
kb Slope of the side B
kc Slope of the side C
K(x;xi) Kernel function
l Location identifier
le Estimated location, for which an error-estimate will be calculated
li Location variable
L Path loss in Keenan model L1 Path loss of one meter Lf Floor penetration loss factor
LF Free-space path loss
LF(dB) Free-space path loss in decibels LT Path loss in ITU-R model
M RSS-matrix of a fingerprint in probabilistic approach n Distance path loss exponent
nf Number of floors
nw Number of walls
NEF F Effective number of particles
p(l) Prior probability p(l|x) Posterior distribution p(x) Normalizing constant p(x|l) Likelihood function
Pr Measured received signal power at located device
Pt Anchor node’s transmit power
r Radius of a circle and distance between anchor node and LD si Online RSS measurement
si
t Discrete hypothesis of an object’s location at time t
Si RSS-vector of the detected signals from APs within a certain location,RSS of a fingerprint
t0 User’s departure time from object A tdif f Time difference
tend User’s time of arrival to object B
tscan Scan time of WiFi APs’ RSS
wi
t Weight of a particle at time t
xscan A location where a scan result of RSS from APs was received
η Normalizing constant
θref ract Departure angle of a refracted radio wave
λ Wavelength of a signal
µ Mean value
σ2 Variance
Abbreviations
AN Anchor node AOA Angle Of Arrival AP Access Point
BAP tag Battery-Assisted Passive tag BT Bluetooth
BLE Bluetooth Low Energy
Blinds Nodes that should be located BTLE Bluetooth Low Energy
ELP Ekahau Location Protocol
ERC Ekahau Real-time location Controller ESS Ekahau Site Survey
GPS Global Positioning System
GSM Global System for Mobile Communications ID Identification
IEEE Institute of Electrical and Electronics Engineers IMU Inertial Movement Unit
ISM Industrial, Scientific and Medical KLD Kullback-Leibler Distance
KNN K-nearest neighbors LD Located Device
LF Low Frequency (30 - 300 kHz) LOS Line-of-sight
MEMS Microelectromechanical systems NIC Network Interface Card
pdf Probability density function PDR Pedestrian dead reckoning RF Radio Frequency
RFID Radio Frequency Identification
RP-SMA Reverse Polarity SubMiniature version A RSS Received Signal Strength
RTLS Real-time location system
SHF Super High Frequency (3-30 GHz) SIG The Bluetooth Special Interest Group
SISR Sequential Importance Sample with Resampling SMG Spinning mass gyroscope
SNR Signal to Noise Ratio TDOA Time Difference Of Arrival TOA Time Of Arrival
USB Universal Serial Bus
UTD Uniform theory of diffraction UWB Ultra-wideband
WGAN Wireless Global Area Networks WLAN Wireless Local Area Networks WWAN Wireless Wide Area Networks XML EXtensive markup language
Indoor positioning has been a widely researched subject for over decades. Despite the fact that indoor positioning has not yet been witnessed as such a mainstream technology as outdoor positioning with Global Positioning System (GPS), the indus-try of indoor positioning applications has been growing. Currently there are many indoor positioning applications such as patient tracking in hospitals, asset tracking and navigation.
Outdoor positioning is mainly done with GPS that uses signals from satellites. Indoors, the walls of buildings greatly diminish the GPS satellite signals which causes inaccurate positioning. Therefore, other technologies have been used and studied for indoor positioning. These include Wireless Local Area Networks (WLAN), Blue-tooth (BT), Ultra-wideband (UWB), Global System for Mobile Communications (GSM) and even the use of Earth’s magnetic field.
This thesis will focus mainly on positioning methods that can be used with WLAN and Bluetooth technologies, but general indoor positioning methods that can be applied on other technologies will be covered as well. One of the most common indoor positioning method for WLAN is received signal strength (RSS) -based fingerprinting. RSS-based fingerprinting is based on measuring radio signals’ strength from multiple Access Points (AP) and determining a position by comparing the RSS to a fingerprint model of an area.
Fingerprinting-based positioning has two phases. A radio map of RSSs from APs is first created for the location. This can be done for example, by making measurements in predetermined spots and storing the location information and cor-responding RSS values. In the second phase, RSS values are measured from the APs and then compared to the fingerprints that were stored earlier. Based on this comparison, the position with the closest match is chosen as the correct position. There are different methods on how to calculate the closest match, and they will be reviewed later.
The fingerprinting method has some drawbacks unfortunately. One of them is that the fingerprinting-based methods are not reliable in places that share a similar fingerprint. A similar fingerprint in two places means that the measured RSSs from APs are close to equal. This can happen especially with two neighbouring rooms close to each other. One solution is to add more traditional radio beacons (Wifi or Bluetooth) to the area to increase fingerprint uniqueness, but that can become expensive in the long run and the area would have to be recalibrated.
1.1
Thesis scope and objectives
The accuracy of a WiFi fingerprinting based positioning system can decrease, if two or more places share a similar WiFi fingerprint. This thesis presents a method for improving a room-level accuracy in a WiFi fingerprinting based positioning by using low-cost static radio beacons. When low-cost static radio beacons are added to an existing positioning system, the fingerprints of a radio map become more unique. More unique fingerprints can increase the room-level accuracy. In the context of
this thesis, the room-level accuracy is quantified as the accuracy that a positioning system can locate a device to a correct room. In the context of the room-level accuracy, it doesn’t matter where inside the room the system locates the device, as long as it can locate devices correctly on a room level. Static radio beacons can be also used in a way that adding them to the positioning system doesn’t necessarily require a recalibration of the area of interest.
The main question is, can low-cost static radio beacons increase the room-level accuracy in a Wifi fingerprinting-based system? In this thesis, the static beacons based indoor positioning method will be tested on top of real a indoor positioning system. As the low cost static radio beacons we will use Bluetooth Low Energy (BTLE) modules and WiFi Universal Serial Bus (USB) injectors with an attenuator that simulates a low-energy wifi beacon.
1.2
Thesis structure
The remaining thesis work is divided into four sections. In section 2 we make a literature research about the base technologies used in indoor positioning. Differ-ent base technologies provide possibilities for differDiffer-ent indoor positioning methods. Some of the positioning approaches can be used with many different technologies, while some of them are very technology specific. As for the base technologies, Wifi, Bluetooth, Radio Frequency Identification (RFID), UWB and Inertial Movement Unit (IMU) are reviewed. Then, in section 3, the positioning approaches that use some of these technologies for indoor positioning are reviewed. These include trilat-eration, angulation, Time Difference Of Arrival (TDOA), Time Of Arrival (TOA), Wifi fingerprinting and filtering. Wifi fingerprinting is given more emphasis, since it is the base method used in the tests of this thesis.
In section 4, the most essential characteristics of a radio signal propagation indoors are described. Indoor propagation is in a very essential role in indoor posi-tioning, and in the new method we propose. Different path-loss models, multipath propagation, shadowing and small-scale fading are covered.
In section 5, Ekahau positioning system is presented. The Ekahau positioning system is an implementation of a WiFi fingerprinting method. The proposed method in the thesis is tested on top of the Ekahau positioning system.
Test scenarios and their results are reviewed in section 6. Two different kind of test were made: RSS-measurement tests and room-level accuracy test. In the RSS-measurement test, the RSSs of an emulated WiFi AP are measured indoors in order to study indoor propagation of radio signals and to investigate whether the proposed method of static beacons could improve the room-level accuracy in theory. In the second test, the room-level accuracy of Ekahau positioning system is tested with and without the aid of a BTLE beacon. First, the integration between BTLE and ekahau positioning system will be shown. Then, the methodology, results and result analysis of the room-level accuracy test will be reviewed.
In the last section (7), summary of the thesis is presented with future work suggestions that could be made to further improve the proposed method and tests.
2
Technologies used in indoor positioning
In this chapter we will shortly review few of the base technologies that are currently used and studied for indoor positioning. These include WLAN, Bluetooth, RFID, UWB and the use of IMU. Many of these technologies were not originally designed to be used in indoor positioning. For example, WLAN was designed for wirelessly connecting computers. Majority of indoor positioning methods are based on the use of radio signals. Therefore, many of the approaches require a device capable of receiving radio signals, and radio beacons that transmit radio signals. Before we review the positioning approaches that can be used with these technologies, let’s cover the base technologies.
2.1
Wireless Local Area Networks
WLAN is a popular technology for wireless connections between devices and con-necting clients to infrastructure networks [1]. A wireless connection is established and maintained by creating electromagnetic waves, which propagates through air. WLAN is currently used in four different radio frequency zones: 2.4 GHz, 3.6 GHz, 4.9 GHz and 5 GHz. The most common frequency zone is 2.4 GHz. The majority of modern WLANs are adhering to Institute of Electrical and Electronics Engineers (IEEE) 802.11 standards, commonly labelled as Wifi. Mobility is a significant ad-vantage of WLANs. Users can be mobile while connected to each other and to a fixed network. The architecture and technical overview of WLAN can be found in [2]. Other wireless technologies that can provide the same aferementioned functions as WLAN are for example, Wireless Global Area Networks (WGAN) and Wire-less Wide Area Networks (WWAN). InLindroos[2], a comparison is made between WLAN, WGAN and WWAN. WLAN is seen as the best choice for the residential buildings for the following reasons:
• WLAN-coverage is good for many indoor environments, especially for residen-tial buildings. For security reasons the optimal signal strength should be strong inside the building, and weak outside. WLAN-coverage is usually optimal for this.
• Because users often want to connect to the Internet, the throughput of the technology has to be high enough. This can be achieved with WLAN.
• The cost of WLAN is very low.
Because WLAN has become so popular nowadays, that it already exists in many indoor infrastuctures, it is naturally very tempting to use its radio signals for indoor positioning. This way an indoor positioning system can be implemented without the need for installing any additional equipment. Though in practise, the density of WLAN APs (Access Points) can vary a lot in the area. If the density of APs is low, then there is a need to install additional APs. Generally speaking, the higher the amount of APs, the better the conditions for positioning methods to work. Locations of the APs have an impact on the positioning system as well. Also the APs channels
should be selected in such a way that they don’t interfere with each other. On 2.4 GHz WLAN, one very common choice is to use channels 1, 6, 11 and 14 together, because they don’t overlap with each other.
2.2
Bluetooth
Bluetooth is another wireless technology for connecting devices and exchanging data over short distances. It is standardized in IEEE standard number 802.15.1, but that standard is no longer maintained. Currently Bluetooth is managed by The Bluetooth Special Interest Group (SIG), which includes more than 19000 member companies in the areas of networking, computing, telecommunication, and consumer electronics.[3] Idea behind Bluetooth is to enable low-power radio communications to link computers, phones and other kind of network devices over short range. Mo-tivation for bluetooth was to replace the cable(s) that were used in connecting fixed or portable electronic devices.
Next, lets take a look at some of the technical specs of Bluetooth. Bluetooth uses short-wavelength microwave transmissions in the Industrial, Scientific and Med-ical (ISM) band from 2400Mhz to 2480Mhz. Frequency hop tranceiver is used in Bluetooth to diminish fading and interference. The Bluetooth protocol uses a combi-nation of packet and circuit switching. Good overview of the Bluetooth architecture and features can be found in [4].
Differences between WLAN and Bluetooth are:
• Bluetooth signal has generally a lower distance range.
• Bluetooth costs less to implement. Also the power consumption of Bluetooth is generally lower.
• Wifi has a bitrate many times higher than BT.
2.2.1 Bluetooth Low Energy
The BTLE was officially introduced in 2011 in Bluetooth Specification v4.0. Blue-tooth Low energy has much lower power consumption than in classic BlueBlue-tooth, has new features and unique characteristics. This enables new types of applications that were not practical with Classic Bluetooth. BTLE was originally devised by Nokia under the name of Wibree. With a low power consumption, BTLE can be used in small devices with a tiny coin cell battery, that can last for 1-10 years, depending on usage. BTLE is aimed at applications in security, fitness, healthcare and home entertainment industries. [4]
2.2.2 Bluetooth and positioning
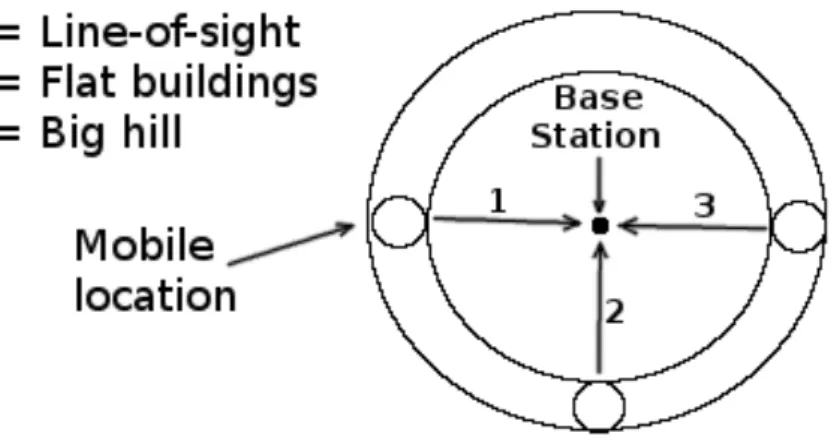
Bluetooth contains useful characteristics which can be used in indoor positioning. Because of the low distance range of Bluetooth signals, Bluetooth can be utilized in cell-based positioning [5]. Bluetooth cell-based positioning contains Bluetooth
transmitters covering the localization area such that each transmitter and its signal range forms a cell area, as demonstrated by Figure 1.
Figure 1: Cell based positioning structure
This kind of cell-based infrastructure enables tracking of a device capable of receiving Bluetooth signal. The device can be located in the cell area of which Bluetooth signal it is detecting the strongest. Of course this method requires a large amount of BT transmitters, but because BT transmitters cost little and lifetime is high, it is a financially scalable solution. Its viability increases especially with BTLE, that has even lower power consumption. One of the goals of this thesis work is to utilize and study BTLE beacons to gain more room-level accuracy for indoor positioning. The communication range of Bluetooth is generally less than WLAN, but based on my personal observations during measurements, in many cases the signal can be detected equally far away. Detecting weak BT signal doesn’t allow good connection and data transfer between devices, but this doesn’t mean the signal could not still be used in positioning. This is why many other common positioning methods also apply to Bluetooth. These positioning methods will be discussed further in the next section.
2.3
Radio Frequency IDentification
Radio Frequency IDentification (RFID) is a method mainly for tracking and iden-tifying tags attached to different objects. Commercially, RFID is often used as a replacement for bar codes [6]. RFID is a wireless and a contact-free method, that uses radio-frequency electromagnetic fields for transferring data between RFID tags. RFID also has an option to store data to a Radio Frequency (RF) compatible in-tegrated circuit [7]. RFID systems operates on many frequency bands from Low Frequency (LF) ( 30 - 300 kHz ) to Super High Frequency (SHF) (3-30 GHz).
An RFID system consist of three components: a tag, a reader and antennas in both. RFID tags can be either passive, active or passive with battery assistance. A passive tag has no integrated power source. It only activates when it receives a signal from an RFID reader that will power it up to send back a response signal. Active tags have their own battery power source, that can be used to periodically transmit ID signal. A battery-assisted passive (BAP) tag works similarly to the passive tag, except that it doesn’t necessarily need an external power signal from the reader, since it has its own battery source. A BAP-tag doesn’t actively transmit an ID signal, but it is activated when it detects an RFID reader. Because passive tags have no internal power source, the range of their signal is usually lower than that of an active tag. RFID tags can be either read-only, or read/write enabled, where the user of the system can write data to them. [8]
An RFID reader is used to read tags and get information from objects attached to tags. An RFID reader produces energy to passive tags by using its electromag-netic field. Passive tags can then use this energy to send information to the reader. Readers can be also either passive or active. Passive readers receive signals from tags, but don’t transmit anything by themself. A system with passive readers re-quires active tags that transmit their ID signal periodically. Active readers transmit interrogator signals to tags, and receive information from them. [8]
The RFID tags and readers can be made very small and cheap and their de-ployment and usage in different devices and places is straigthforward and don’t necessarily require much maintenance. Currently RFID-based systems are widely used in libraries and big malls for disbursing and monitoring. Also, tags can be implanted for tracking of animals, for example. RFID tags can be made very small, as seen in Figure 2.
Figure 2: RFID tag size comparison with rise grain [9]
RFID-based systems have been used in indoor positioning as well. Contrariwise to the normal RFID system use case, in the indoor positioning case the actual
reader is the device usually being tracked or located. A very common scenario is to have static RFID tags scattered over the area. The RFID tags contains a location information that tells where the tag is located. Then a moving object will carry an RFID reader that reads signals transmitted by tags. If the tags are passive, then the reader also sends power signal for them. Based on the received signals from the tags, the readers position can be estimated. Many different kind of methods and algorithms for RFID have been invented. A common one is cell-based positioning by using RSSIs (Received Signal Strength Indicator) of the tags. The reader can be located to an area of which the RFID tag’s RSSI value reader detects the strongest. [10]
An extensive state-of-the-art review [11] of RFID-based positioning methods includes the use of RSSI information and combining RFID-based positioning with Pedestrian Dead Reckoning (PDR). The authors’ own proposed approach in [11] is localization based on RSSI measurements combined with RFID tag detection count probability. They estimate distances between all the tags and the reader from the RSS based on radio signal attenuation model. These distances are then used by a particle filter to get more accuracy. Traditional positioning methods like trilateration and fingerprinting can also be used in RFID technology, as presented in [12].
2.4
Ultra-wideband
Ultra-wideband, as the name indicates, uses a wide frequency band for communica-tion with radio waves. UWB can be used for short distances with low energy and high bandwidth. UWB is used in non-cooperative radar imaging, tracking, local-ization, and sensor data collection.[13] In military, UWB radars have been used for multiple decades [14, 15].
Bandwidth of UWB can be wider than 500Mhz in absolute frequency. Remark-able difference with traditional radio transmissions and UWB is, that UWB mod-ulates the information by generating radio energy at certain time intervals, which is called time modulation. Wide band gives handfull of benefits in radar applica-tions, communications and positioning. One benefit is that UWB contains multiple different frequency components, which increases the probability of UWB signal to penetrate through walls. This is because the frequency that passes through obstacle is dependent on the obstacle’s material. Different material passes different frequen-cys and prevents others. Small-scale fading effect, known for radio communications, is also decreased when using large bandwidth. [13]
The signal penetration property of UWB provides quality and opportunities in indoor positioning. It enables positioning methods that can not be used very well with other technologies in indoors. These include TDOA and TOA -trilaterations and Angle Of Arrival (AOA). These techniques will be explained further in this thesis. Multipath distortion of radio signals caused by reflections from walls and obstacles is a common hindrance for TOA and AOA -based positioning techniques in traditional RF positioning systems. TOA and TDOA methods require the original unreflected signal in order to work properly. Because UWB pulses have a very short duration, it is possible to filter out the reflected signals from the original signals
[16]. The advantages of UWB technology in indoor positioning are: less interference, good material penetration of signals, no multipath distortion, doesn’t require a line-of-sight, UWB sensors are cheap and they have a large coverage range [16]. The accuracy scale of UWB positioning system is generally in centimeters.
2.5
Inertial Measurement Unit
Inertial measurement unit is a device that consist a combination of gyroscopes, ac-celerometers, magnetometers and a barometer. For device to be labelled as IMU, it doesn’t require to have all of the aforementioned gadgets. IMU unit measures velocity, orientation, air pressure, and gravitational forces of the object it has been attached. These information can be utilized for example in navigation and position-ing. Originally IMU was used a lot in aircraft navigation, and it is still used as a backup system if GPS fails. In indoor positioning, IMU is utilized in a positioning method called pedestrian dead reckoning. Next, lets review the components of the IMU unit. [17]
2.5.1 Gyroscope
Gyroscope (Fig. 3) is a device capable of sensing the changes in orientation and angular velocity. There are different ways how to implement a gyroscope. Figure 3 represents a classic mechanical spinning mass gyroscope. A spinning mass gy-roscope (SMG) has a spinning disk that is mounted into a loosely rotating joints. When the disk is set to high reeling motion, it remains its orientation almost the same even if the gyroscope is turned around differently. Reason for this is in the angular momentum the disk holds. Disk with angular momentum tries to resist any movement in its orientation. Because the disk remains its orientation even if gyroscope’s orientation is moved, we can then easily sense the changes on the ob-jects orientation the gyroscope is being attached to. For positioning purposes, this will give us information about the changes of orientation. The more information we have about the movement of object being positioned, the better we can estimate its position. [18]
Two other common gyroscopes are vibrating mass gyroscope and optical gy-roscope. Vibrating mass gyroscopes are popular Microelectromechanical systems (MEMS) gyroscopes, that can be found for example inside smart phones. Vibrating mass gyroscope works by sensing angular velocity from two different modes of vibra-tions. First vibration mode is called drive-mode, and in drive-mode the mass is set to vibrate in a linear way using electronic current. The second mode is called sense-mode, and it is caused by the Coriolis effect caused by drive-mode vibration and input of external angular velocity. From the displacement of gyro’s inner structures, the amount of external angular velocity can be sensed. [20]
2.5.2 Accelerometer
In IMU based indoor positioning, accelerometers are in very crucial roles. Accelerom-eters used inside devices like smartphones are micromachined acceleromAccelerom-eters. They
Figure 3: Gyroscope [19]
consist a supported mass, outlying frame, and springs between the frame and the mass. Accelerometer can be modeled as in Fig. 4. When no forces are influencing the system, the springs have an equal tension and the proof mass’s position will be in the center of the frame. If the frame is under acceleration, the mass will displace from the center which causes electrical change. Acceleration of the frame can be determined from this electrical change. Usually one IMU contains 3-axis ac-celerometer, so acceleration can be sensed in 3 dimensions. [21] Regarding of indoor positioning, acceleration can be used to estimate travelled distance by counting foot steps.
2.5.3 Magnetometer and barometer
Magnetometer is a device for measuring either the strength of the magnetic field, direction of the field, or both. In general, magnetometers can be split into two categories: vector and scalar magnetometers. Vector magnetometers measure the strength and direction of the magnetic field, whereas scalar magnetometers only measure the strength. Carl Friedrich Gauss invented the first magnetometer in 1833. [22]
Sensing the direction and strength of magnetic field can both be used in indoor and outdoor positioning. Knowing the direction of magnetic field, one can use the magnetometer like a compass to get heading information. If we consider small device with magnetometer carried by human, the device should be mounted into one position in order to get proper heading information from magnetometer. The strength of magnetic field can be utilized in fingerprinting based positioning. [23]
Barometer is a device used for measuring atmospheric pressure. It is commonly exert in measuring air pressure to forecast changes in the weather. In indoor posi-tioning, a barometer can be used for detecting correct floor level. Quick changes in air pressure can indicate vertical movement. [24]
3
Indoor positioning methods
In the third chapter of this thesis the most common indoor positioning approaches are covered. Many of these methods are usable in outdoor positioning as well. Weaknesses and strengths of the methods will be analysed. The methods include: Trilateration, triangulation, TDOA and TOA, RSSI-based ranging, fingerprinting and filtering. The methods are not exclusive to each other. One could use many of them simultaneusly to increase the performance of a positioning system. The use of different filtering techniques has become popular in indoor positioning. Based on history estimates, a positioning system can filter out false positioning candidates, and therefore increase the positioning accuracy. In section 3.6, we will review a simple filter, which is based on error estimate, and a particle filter.
Many of the positioning approaches consist of similar system components. An anchor node/reference point is a one typical component of an positioning system. These reference points provide crucial information, that is then used in positioning. It is common, that the location of an anchor node is known beforehand. Usually, the devices wanted to be located and anchor nodes exchanges information with each other. The content of this information is then applied in localization. In the context of this thesis, the nodes or devices wanted to be located are called blinds.
3.1
Trilateration
Trilateration is a positioning approach, that can be used to locate an object by using the geometry of spheres. Requirement for the trilateration approach is, that the distances between a blind node and at least 3 reference points has to be known. There are different means how the distances can be estimated. If the blind node and the reference points are RF compatible devices, one can calculate the distance based on signal strength attenuation. Different propagation models exists that can be used for that. Another way to obtain the distance is by calculating a radio signal’s flight time between an anchor node and the blind. This method is called Time of Arrival (TOA). Measuring the distance based on TOA and received signal strength (RSS) attenuation will be reviewed later.[25]
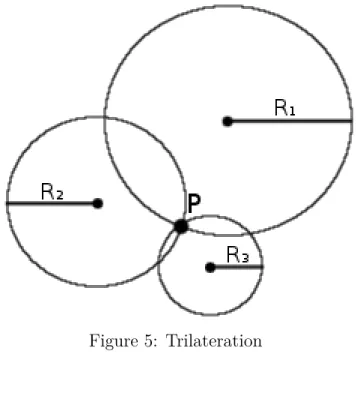
Once the distances between the anchor nodes and the blind are known, lateration process can be applied. In lateration, the blind is located by using the geometry of circles. Let’s consider a situation where we have one anchor node and a blind, and we know the distance (d) between them, but not the heading of anchor node. What we do know, is that the blind is located somewhere on a circumference of a circle that has a radius of d. To get the exact position, we need to know the distances between of at least 3 different anchor nodes and the blind. If we draw the 3 circles that forms from the distances between the anchor nodes and the blind as in Fig. 5, we can see that they intersect in one spot, which is the correct position. [25]
The intersection point can be found by using mathematics. We have three circles and we just need to calculate where their x and y coordinates are equal. First, we have the three circles as in Equations 1, 2, 3.
Figure 5: Trilateration
(x−a1)2+ (y−b1)2 = r12 (1) (x−a2)2+ (y−b2)2 = r22 (2) (x−a3)2+ (y−b3)2 = r32 (3) Two circles will intersect at two points. The first two circles will have two pair of x and y coordinates as their intersection points. These can be solved for example by solving y from the Equation 1, and inserting it to Equation 2. Then x can be solved from Equation 2. X will have two values, that can be used to calculate the two y coordinates. Once we know where two circles intersect, we can look where the third one will intersect. The third one will intersect two times with both of the circles making it total of 4 intersections. Two of these intersection coordinates will be the same coordinates where circles 1 and 2 crossed. This point is the point where all circles intersect, thus we have found our goal.
In practise, the three circles never really intersect exactly at one spot. This is because we never get absolutely right distances between the anchor nodes and a blind. Especially in indoors, the environment is very challenging for estimating distances between anchor nodes and blind nodes. Challenges for trilateration are (1) variations of wireless communications; (2) incorrect measurement of range; (3) dynamic environment with disturbance [25]. Different technologies and different methods can affect a lot for the performance of estimating distances as we will see in the forthcoming sections. Indoors, the trilateration method struggles in situations where there are no-line-of-sight between a blind node and anchor nodes.
3.2
Angulation
Angulation positioning method is based on arrival angles of signals. [26] These signals can be for example electromagnetic signals or sound waves. The method is often also referred as Angle of Arrival (AoA). Like trilateration, angulation based method can be used in a system that has anchor nodes (AN) and blind nodes. In Angulation, the anchor nodes doesn’t necessarily need to send any signals to the blind. Common scenario is that blind node is the one sending signals to anchor nodes. Requirements for angulation positioning method to work in two dimensions are following [27]:
• At least two anchor node positions have to be known.
• Anchor nodes need to be able to measure the arrival angles of the signals originated from the blind nodes.
• Direct signals are required; reflected can cause errors.
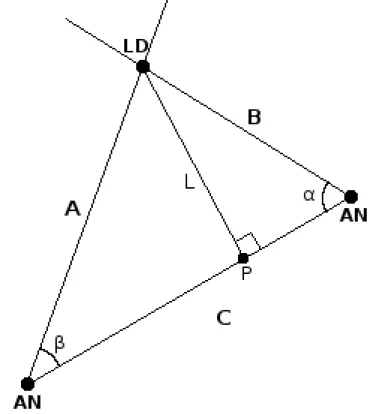
Once we know the arrival angles of the signals, we can draw those signal lines and the point where the lines cross is the estimated location. Let’s go through how by using mathematics we can get the position coordinates of a blind node with two anchor nodes as in Fig. 6. In Fig. 6 the anchor nodes are marked as AN and the blind node is marked as LD (Located Device). Goal is to get the coordinates of the blind node. Since we beforehand know the locations of ANs, we know the distance between them, marked as C. We also know the slope and function of side C. Probably easiest way to get coordinates of the blind node is to calculate the functions of side A and B, and then see where they intersect. Lets calculate the function of side B. Slope of C is:
kc=tanθ
Because we know the angle between sides C and B, and the slope of C, we can get the slope of B:
kB =tan(θ+ (π−α))
The function of side B has a form of:
y=kBx+R
We already know the slope of B, so we just need to figure out the constant R. That can be solved by using the fact that function B goes through point AN. Lets mark the point AN as: (x0, y0). We can now insert that point to the function of side B and solve the constant R:
R=y0 −kBx0 So the function of side B is:
y=x∗tan(θ+ (π−α)) +y0−kBx0
Next we can do the same thing to calculate the function of side A, and then just calculate where they intersect. That operation is mathematically trivial and left therefore outside of this thesis.
The pros of angulation method is, that no calibration of the area is needed beforehand. Cons and challenges are:
• Currently can not utilize existing wlan architechtures. One has to install separate special hardware.
• Multipath effect in indoors affects to the angle of arrival; signal can arrive from multiple directions.
Before in this thesis we mentioned that Ultra-wideband technology uses very fast pulses, which enables the detection of different multipath components. In AoA this can be utilized to find the direct path component or at least migitate the errors of multipath reflections. Overview of migitation methods and multipath reflection problems can be found in [28].
3.3
TOA and TDOA
Time Of Arrival (TOA) and Time Difference Of Arrival (TDOA) are methods that try to estimate a location of a blind node based on the travel time of a signal. These methods can be used in a system that has multiple anchor nodes and blind nodes. In both methods, the blind nodes has to send signal to anchor nodes. Lets review TOA first.
In TOA, the flight time of signals traversing between anchor nodes and blinds are calculated to get distances. TOA method can only give distances between blinds and anchor nodes. The estimation of the location can then be obtained by using for example trilateration method, discussed earlier. One way to calculate the time of flight is following: a blind node sends a radio signal to the anchor nodes. The radio signal consist of a timestamp message of the signal’s time of departure. When an anchor nodes receives the message, it writes down the arrival time and calculates the time difference by subtracting the departure time from the arrival time. The TOA approach requires precice clock synchronization between the blind nodes and the anchor nodes. Clock synchronization is one of the challenges involved in the TOA. [27]
Once the time difference has been calculated, the actual distance between the anchor node and the blind can be calculated simply by formula:
D=c∗ 4t
Where c is the speed of light in medium, and 4t is the time difference.
In TDOA method, a blind node sends signals which anchor nodes can detect. The location of the blind is estimated by using the time difference of the arrival signal between several anchor nodes. Lets have an example in two-dimensions, where we have two anchor nodes and a blind node, that is sending signals. When the anchor nodes receive the signal originated from the blind node, they will save the arrival time into memory. Then the difference between those arrival times is calculated. We know that the blind has to be located on places that share the same time difference. Because now time is linear to distance, the possible locations of the blind are those where the difference of distance remains the same. When these possible locations are calculated mathematically, we actually find out that they are all located on a hyperbola.[29]
In order to get the exact position, we need to add a third anchor node to the system. Then we can calculate a different hyperbola of possible locations. The exact position of the blind node can then be found in the intersection point of the two hyperbolas.
The benefit of TDOA compared to TOA is that in TDOA, only the anchor nodes’ clocks needs to be synchronized between each other [27]. It doesn’t matter whether the blind nodes are in sync or not, since it doesn’t affect to the time difference of arrival. Indoors, Both TOA and TDOA methods suffer from multipath reflections which causes the signal to arrive later than expected. But with UWB technology, different reflection components can be detected and filtered, making TOA and TDOA noteworthy method for also in indoor positioning. [30]
3.4
RSSI-based ranging
In RSSI-based ranging the distance between a blind and an anchor node is estimated from the signal path loss by using radio signal propagation models [31]. The path loss between a pair of antennas is defined as the ratio of the transmitted power to the received power [32]. Lets assume we have an anchor node, that is transmitting radio signals captured by a blind node. When the signal output power of the anchor node is known, the attenuation of the signal can be calculated by measuring the received power at the blind node and then subtracting that from the signal output power. The distance is then calculated based on a chosen propagation model. Once we know the distances from the blind node to three or more anchor nodes, a location of the blind can be calculated by using the trilateration method discussed earlier.
There are several propagation models invented for radio signals. In a free space, the path loss is [32]:
LF = PtGtGr Pr = 4πr λ 2 = 4πrf c !2 Where:
• LF is the free space loss.
• Pt is anchor node’s transmit power.
• Gt is anchor node’s antenna gain.
• Pr is a signal’s received power at a blind node.
• Gr is blind node’s antenna gain.
• r is the distance between anchor node and a blind node. • λ is the wavelength of the signal.
• f is the frequency of the signal. • cis the speed of light.
The free space loss model expressed as decibels is:
LF(dB)= 32.4 + 20logR+ 20logfM Hz
Where LF(dB) is attenuation in decibels, R is distance in kilometers, and fM Hz is
frequency in megahertz.
However, in most of the cases these forementioned equations don’t provide accu-rate estimation of the distance under real-life conditions [33]. In indoor environment, a radio signal can experience many physical phenomens, which makes it more hard to estimate a distance based on RSS. Indoors can contain walls, objects and moving people for example. These all have an effect to the signal strength. The signal
can fade or reflect, which causes multipath issues. Therefore, more advanced signal propagation models have been invented for indoors. These include, for example, Log-Distance path loss model, ITU path loss model and Keenan and Montly path loss model. We will come back to these path loss models in section 5, where we discuss about indoor propagation and phenomenons. Despite the more advanced indoor propagation models, the accuracy of the RSS-based ranging is generally seen as moderate due to its physical constraints.[27]
3.5
Fingerprinting
Fingerprinting is an indoor positioning technique, where a map of fingerprints is first created for the location [34]. Then online measurements are compared with the fingerprints, and the location of a blind node is determined based on the compari-son. What are these fingerprints then? Generally speaking, fingerpints are location-dependent characteristics mapped to the location [31, 16]. In case of WLANs, possi-ble fingerprints can be for example, the RSSI of the APs. Other example attributes that have used as fingerprints are:
• Radio signal’s signal to noise ratio (SNR) [35]. • The Earth’s magnetic field [36].
• Air pressure [37, 38]. • Sound waves [39].
As a fingerprint, it is possible to use all the available location-dependent charac-teristics together. In the context of the remaining thesis, the term fingerprinting means the Wifi RSSI-based fingerprinting. That is the base method used in our test system, and therefore we will focus more on it in this thesis. Fingerprinting has two phases, an offline phase and an online phase. In the offline phase, a radio map of RSSI fingerprints is created for the location. In the online phase, the current measurements are compared to the radio map and closest match is selected as the positioning estimate. First, lets review offline phase. [34]
3.5.1 Offline phase
In the offline phase, a radio map of fingerprints is created. Lets define a fingerprint in the Wifi RSS-based fingerprinting. Content of a fingerprint is dependent on the approach of the chosen comparison method. Two very common approaches are a deterministic and a probabilistic approach, which we will review further in the thesis. In the deterministic approach the fingerprint can be defined as (l, Si), where
l denotes the location identifier, and Si is an RSS-vector consisting all the RSSIs
from detected APs in the location [40]. In other words, Si = (S1, S2, S3, ..., Sn),
where n is the amount of detected APs. In deterministic approach it is common to use the average value of RSS from each AP. This means that RSS of each detected AP is measured multiple times at each location point to calculate the average.
In the probabilistic approach, instead of using the average value of RSS as a metric, a probability distribution of RSS is used [40, 41]. A fingerprint is modeled as a group of probability distributions of RSSs from detected APs. In the present case, the fingerprint can be defined as (l, M),where l denotes a location, and M is a matrix containing RSSs that are used to model the probability distributions. In order to form a probability distribution, the RSS has to be measured multiple times. With multiple measurements the average and variance of the distribution can be calculated, assuming the RSS follows Gaussian distribution. The matrix M is defined as: M = R11 R12 · · · R1a R21 R22 ... R2a ... ... ... ... Rk1 Rk2 · · · Rka
Where k is the amount of RSS for each AP, and a is the number of detected APs. In practise, there are many ways how to create the fingerprint radio map. First, the location area and the distance between fingerprints should be decided. Scattering the fingerprints uniformly throughout the area can possibly decrease positioning bias, compared to unequal distribution of fingerprints.
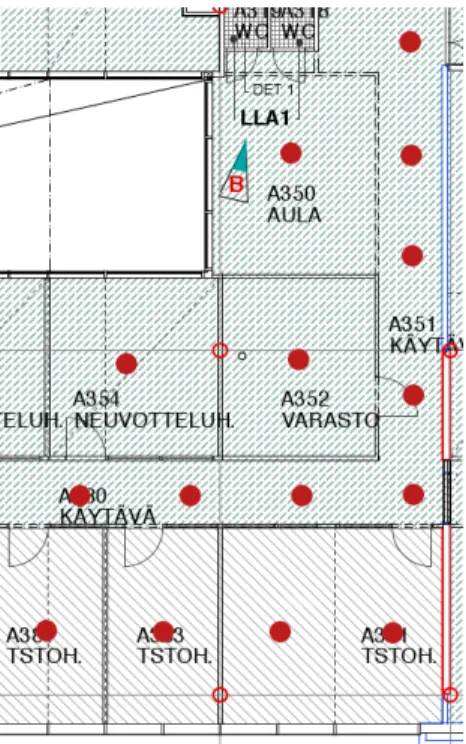
Next, we take a look at some possible examples of how to create the radio map. First example is simple and straighforward. The locations of fingerprints are decided and marked down to a map beforehand as in Fig. 7. Then with a device and software capable of measuring Wifi RSS, we physically walk to every position and stationary scan through all APs to measure their RSS, preferably multiple times to get an average. The red circles in Fig. 7 represent fingerprinting measurement locations. Because human body effects to RSSs, measuring in multiple orientations per location can give more accurate fingerprints. RSSs are then stored to memory with their location identifier. Aforementioned method is simple, but contains few drawbacks. First is that the method can be relatively time-consuming. Second, the method manages to create the RSSs fingerprints only in the predefined spots. Between the spots there is no measured evidence of RSS. This means the actual area where we do have empirical knowledge of RSS is usually small compared to the total area of the location. The density of RSS-knowledge in the area can be increased by raising the density of measurement spots, which in turn makes the method more time-consuming.
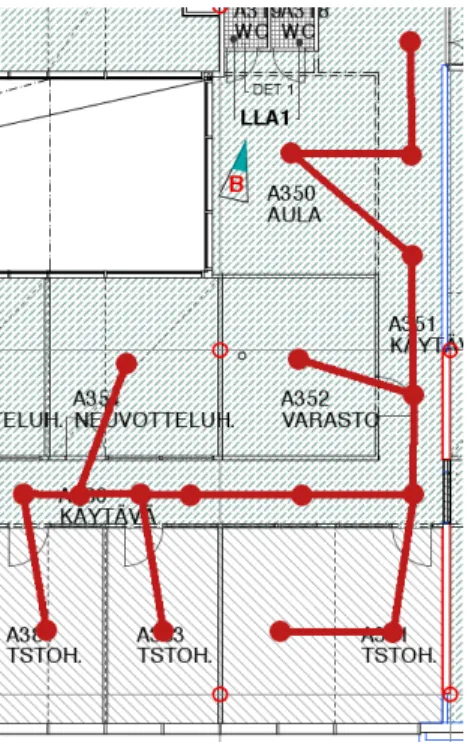
The second example utilises a graph for achieving a better coverage of the RSS information in the area [42]. Idea is to make a graph on top of the area map that is uniformly distributed as in Fig. 8. As in the figure, all the objects are connected through links. A user is then supposed to walk from object to object by following the link between them, and simultaneusly scan WiFi RSS with a device. When a user encounters object at the end of the link, he then marks down (with the aid of a software for example) the position of the object and the current time. This process is then repeated for each link in the figure, until the whole test area is covered.
In a WiFi RSS fingerprint map, the locations of RSS scannings should be known. In the above example, the locations of RSS scannings are not directly known. What
Figure 7: Fingerprinting; creation of a radio map with stationary measurements
is known in the example are: the departure and arrival times of the user traversing between objects, the times of WiFi scans, the locations of objects and the distance of the links between the objects. The RSS scan positions on a link can then be calculated by using the proportional relationship between time and distance. Let’s have a simple example demonstrating this. Assume we have two objects A and B connected with a straight link. For the sake of simplicity, assume we only scanned once the RSS values at time tscan, and the both objects A and B are located on the
x-axis. What we are trying to calculate is the location where the RSS was scanned, denoted as xscan. The coordinates of A and B are (0,0) and (xdist,0). The user’s
time of departure from object A is denoted by t0 and the time of arrival to object B is denoted bytend. The time difference is then:
tdif f =tend−t0
Because of the proportional relationship between distance and time, the following relation holds:
xdist
xscan
= tdif f
tscan
From this we can easily solve the location of the scan xscan:
xscan =
xdisttscan
tdif f
= xdisttscan
tend−t0
The benefit of the graph-based method is that it gives more RSS-information about the area. One could also argue, that walking and scanning continuosly is
Figure 8: Fingerprinting; Graph-based method for creating the radio map.
faster than doing only stationary scans where you need to separately start and stop the scanning.
Both of the examples above are methods that use empirical measurements to create the fingerprint radio map. Another way to create the radio map is to analyti-cally estimate the RSSs of APs by using different radio signal path loss models [43]. The analytical and empirical method can be used together in a beneficial way. By using the analytical method we can for example try to estimate the RSSs between measurement points. Secondly, the combination of these methods could result into a fewer required measurement points, which would make the calibration phase less time-consuming.
3.5.2 Online phase
In the online phase, a comparison is made between the online measurements and the fingerprint database created in the offline phase [41]. The position of a blind node is chosen based on this comparison. Many different comparison methods exists and in this thesis we will cover some of the common ones. Essential for almost all the comparison methods is that each RSS-vector measured in online phase is compared to a relevant group of fingerprints (sometimes to all fingerprints). One Wifi scan comprises of RSSs from all detected APs. The Wifi scan results are then compared with each relevant fingerprint. The RSSs of a Wifi scan are compared with fingerprint in such a way that each RSS is compared with the fingerprint’s corresponding AP’s data. The corresponding AP’s data depends on the method used. In deterministic methods the corresponding AP’s data for a fingerprint is usually one scalar RSS value. That value can be either one RSS measurement or an
average RSS from many measurements. In probabilistic methods the corresponding AP’s data is a probability distribution of the RSS in that particular place. The probability distribution can be modelled with many measurements of RSSs in the spot. These give us the average and variance of RSS, which are needed for the Gaussian modelled probability distribution.
In deterministic-based methods the distance norm between the online RSS-vector and the fingerprint RSS-vector is calculated for all fingerprints. Distance norm can be for example Euclidean distance or Manhattan distance. Euclidean and Manhat-tan disManhat-tance can be generalized by the Minkowski disManhat-tance:
dq = n X i=1 |si−Si| q !1 q
WhereSi is the RSS of the fingeprint,si is the online measured RSS, n is the amount
of APs detected, andq determines the formula as Manhattan distance or Euclidean distance. If q equals 2, then the distance norm is Euclidean distance. If q equals 1, then the distance norm is Manhattan distance.
After all the distances between online measurement RSS-vector and fingerprints have been calculated, it is time to estimate the blind’s position based on the tances. Each fingerprint is associated to a certain position. That means each dis-tance is also associated to a certain position. In anearest neighbor method [41], the location estimate is obtained by choosing the position that has the minimum dis-tance compared to other position’s disdis-tances. In a K-nearest neighbors (KNN) [44] method, k positions having the smallest distance are chosen instead of just one. The location estimate is then obtained by averaging the k-nearest neighbours’ locations. Modification of the KNN method is the so-called WkNN method (Weighted k near-est neighbors). WkNN works similarily to KNN mehtod, except after finding the k best matching measurements it assigns weights for each of these measurements. The weights can be for example, the inverse of the distance.
In the probabilistic fingerprinting, signal measurements are considered as samples from a random variable. The random variable follows a certain probability distribu-tion. The probability distribution can be either a histogram-based or parametric.[31] The histogram-based probability distribution models the signal variations by using a histogram which consist of previous observations. The parametric probability dis-tribution model can be for example Gaussian disdis-tribution, that has a probability density function (pdf) as:
fX(x) =
1 σ√2πe
−(x−µ)2
2σ2 (4)
Where µ is the mean value of the random variable,σ2 is the variance, and x is the observed value.
What probabilistic fingerprinting tries to find is the most probable position of the blind node. Let l denote the location variable. The idea is to compute the conditional posterior pdf for each relevant fingerprint, and select the position that has the highest probability value.[41] The posterior distribution means that what
is the probability that a blind node is at location l, when we have received an observation vector x, containing the received RSS from the detected APs. From Bayes rule we can get the posterior distribution:
p(l|x) = p(x|l)p(l) p(x)
Wherep(l) is the prior probability of the blind being at locationl without knowing the value of observation vector x. The prior distribution can be used to include background information, for example user profiles. For simplicity we use uniform priors that gives no bias towards any location. Thep(x) is treated as a normalizing constant if needed, since it does not depend on the location variable l.
The part we are most interested in is the p(x|l), which is called the likelihood function. It gives the probability that we have observedx, when the blind is located atl. The likelihood function can be implemented in multiple different ways. In this thesis we will cover two different types of methods how to implement the likelihood function, the kernel method and the log-sum method.
The operating principle of the kernel method is that after we have observed RSS vector x, we calculate probability for each RSS by using kernel function. Then we sum up those probabilities, and divide the sum by the amount of RSS values in vectorx. More formally:
p(x|l) = 1 n n X i=1 K(x;xi)
WhereK(x;xi) is denoted as the kernel function. Kernel function can be for
exam-ple the Gaussian probability density function presented in equ. 4. To clarify things little, we have to remember that each fingerprint in a database consists of training vectors xi. Each of these training vectors model a particular AP’s RSS probability
distribution in that location. [31]
The log-sum method works a little differently. If we assume that the APs are independent on each other, then the likelihood function can be calculated by first estimating the probability of each RSS, and then multiplying those probabilities together. The probability can be estimated for example by using the Gaussian probability density function presented in equ. 4. If one of the probabilities is a value near zero, then it can affect a lot to the end result, because the probabilities are multiplied together. In order to prevent this kind of underflow, the likelihood function is calculated on a logarithmic scale. In logarithmic scale the product of probabilities converts into a sum of logarithmic probabilities:
p(x|l) = N Y i=1 p(xi |µi, σi)↔logp(x|l) = N X i=1 logp(xi |µi, σi)
Once the likelihood function has been calculated to each relevant location, the position with the highest probability can be chosen as the position estimate. Or the weighted average of the k-highest ranking positions can be chosen. In proba-bilistic approach the offline measurements can be grouped into a different clusters.
Each cluster can then represent as one location. This means that inside the cluster there are multiple fingerprints, each to be considered as the same location. In the aforesaid setting the fingerprints can be for example combined as one fingerprint. Grouping the offline measurements into clusters and using the kernel method is in the experiments ofRoos[41] produced worse results than the kernel method without the clustering.
Next we will consider methods that try to increase the accuracy of the positioning by using the history position estimates to filter out the false position candidates for the next location. Assume our positioning system updates the location of the blind node with continuous interval of one second for example. Can we, by some way, use the history locations in the determination of the next location? The use of filtering in indoor positioning is discussed on the next section.
3.6
Filtering
Filtering is a technique that can be used in indoor and outdoor positioning to gain more positioning accuracy. Filtering can be utilised on almost any indoor position-ing technique, where locations are updated continuosly with particular time interval. Basic idea of filtering is to filter out false position candidates based on previous his-tory estimates. For example, if a position is updated every second, then we can assume, that the next position cannot be far away from the previous one. With this in mind, we can filter out all positions that are too far away from the previous po-sition. But what if the previous location estimate was wrong, and the real position was relatively far away from it? Are we then mistakenly actually filtering out posi-tions that could be right? For example, in fingerprinting technique, different places can share a very similar fingerprint, that could lead to a mistake in estimation. As it turns out, filtering requires more complex methods to provide robust results. In this subsection, we will review two different filtering techniques that can enhance the accuracy of a positioning system. The first technique is denoted as a simple filtering with error estimate.
3.6.1 Simple filtering with error estimate
One solution to the aforementioned filtering situation is to estimate a positioning error. If a location estimate receives a high error-level, then that estimate would not be used in the filtering. Only the location estimates with low error-level would be utilized in the filtering. For the fingerprinting-based positioning, the error estimate can be calculated for example the following way[45]:
E(le |x) = X i=0
p(li |x)dist(li, le)
Wherein:
• le is the estimated location for which the error estimate is being calculated,
• li is the location variable,
• p(li |x)is the posterior (probability) of the location li,
• dist(li, le) is a distance function that calculates distance between li and le.
The error estimate for the estimated location is calculated by a sum of products. The sum consist of each different position’s probability of being the correct position, multiplied by the position’s distance to the estimated location. Based on my per-sonal experiences, the simple filtering with error-estimate can increase a positioning accuracy of a positioning system.
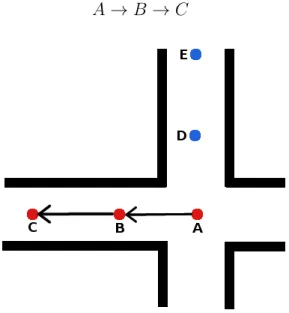
The simple filtering with error-estimate can improve the positioning accuracy, but it can be improved even more with complex filtering. The simple filtering fails at some situations where a more complex filtering would not. Let’s have an example. In our example, we have WiFi fingerprinting-based indoor positioning system that applies the simple filtering with an error-estimate. Assume we have a situation as in Fig. 9, where a blind node is first at location A. Then the blind node (person with a device) is moving linearly with a constant speed to location B, and from that to location C. The speed remains constant whole time during the movement, and the location of the blind is estimated at constant interval of 3 seconds, for example. First, estimation of the location is done at point A, second estimation is done at point B, and third estimation is done at point C. The movement of the blind can then be described as:
A→B →C
Figure 9: Example of filtering error in simple filtering method
The estimation of the location of the blind however is not correct. The location of the blind was estimated first to A, then to B, and last, it jumped to E. The positioning estimates of the system about the location of blind can then be desrcibed as:
Why in our example did the estimate jump from B to E, even the correct posi-tions were A, B and then C? Let’s go through step by step, what could have caused the jump, and why didn’t the filtering work.
Step A:
We assumed that the system was started when the blind was located at location A. No previous history positionings existed at this point. The blind scanned RSSs of APs, send the results to a server, which then run a fingerprinting algorithm, that es-timated the users location to be A. Location A had most similar RSS-readings with the scanned online measurements. The server also calculated the error-estimate for the location, and the error-estimate was good for the position. It means, that the location would be used in filtering for the next position estimates.
Step B:
At step B, the blind arrives to location B, and sends new measured RSS again to the server for location estimation. The server estimates the location by using finger-printing and filtering techniques. The fingerprint in B is the closest match with the current online RSS that were scanned. The position D has a bad probability, so it is not selected. The server estimates user position as B. But, the error estimate for location B was bad. It means that the server cannot say with high certainty, that the users correct location is B. Therefore, this location estimate of B is not used in the future for filtering purposes.
Step C:
The blind arrives to location C, and sends again new measured RSSs to the server, which estimates the position. This time, the location E shares a similar signal environment with the location C. The server uses fingerprinting algorithm to estimate the position. The result of the estimation is, that location E has the most similar fingerprint with the current scanned RSS. After this, the server applies filtering to the results. The only history position that could now be used for filtering is the position A, since it is the only one that had a good error-estimate. The position A is as far away from the position C and the position E, so the server cannot filter out position E, and therefore it chooses E to be the most correct position.
Is there anything in this situation that could have been done to prevent the faulty jump from B to E? What the simple filtering technique doesn’t take into account, is a path probability. In order for the LD to get from A to E, it would need to go through D. At step C, the system could take into account, that the probability of the position D was bad at step B. This information could then be used in filtering, which could have made the difference between places C and E. Next, we will review particle filter and its use in indoor positioning to overcome demerits of simple filtering.
![Figure 2: RFID tag size comparison with rise grain [9]](https://thumb-ap.123doks.com/thumbv2/123dok/2944420.2301806/15.892.309.632.664.986/figure-rfid-tag-size-comparison-rise-grain.webp)
![Figure 3: Gyroscope [19]](https://thumb-ap.123doks.com/thumbv2/123dok/2944420.2301806/18.892.283.654.106.399/figure-gyroscope.webp)