Pacific Accounting Review
Managerial ownership-induced income smoot hing and inf ormat ion asymmet ry Ahsan Habib Haiyan Jiang
Article information:
To cite this document:Ahsan Habib Haiyan Jiang, (2012),"Managerial ownership-induced income smoothing and information asymmetry", Pacific Accounting Review, Vol. 24 Iss 2 pp. 211 - 232
Permanent link t o t his document :
http://dx.doi.org/10.1108/01140581211259839
Downloaded on: 25 March 2017, At : 04: 39 (PT)
Ref erences: t his document cont ains ref erences t o 63 ot her document s. To copy t his document : permissions@emeraldinsight . com
The f ullt ext of t his document has been downloaded 1082 t imes since 2012*
Users who downloaded this article also downloaded:
(2012),"Income smoothing behaviour by Asian transportation firms", Managerial Auditing Journal, Vol. 28 Iss 1 pp. 23-44 http://dx.doi.org/10.1108/02686901311282489
(2012),"Corporate governance and income smoothing in China", Journal of Financial Reporting and Accounting, Vol. 10 Iss 2 pp. 120-139 http://dx.doi.org/10.1108/19852511211273688
Access t o t his document was grant ed t hrough an Emerald subscript ion provided by emerald-srm: 602779 [ ]
For Authors
If you would like t o writ e f or t his, or any ot her Emerald publicat ion, t hen please use our Emerald f or Aut hors service inf ormat ion about how t o choose which publicat ion t o writ e f or and submission guidelines are available f or all. Please visit www. emeraldinsight . com/ aut hors f or more inf ormat ion.
About Emerald www.emeraldinsight.com
Emerald is a global publisher linking research and pract ice t o t he benef it of societ y. The company manages a port f olio of more t han 290 j ournals and over 2, 350 books and book series volumes, as well as providing an ext ensive range of online product s and addit ional cust omer resources and services.
Emerald is both COUNTER 4 and TRANSFER compliant. The organization is a partner of the Committee on Publication Ethics (COPE) and also works with Portico and the LOCKSS initiative for digital archive preservation.
*Relat ed cont ent and download inf ormat ion correct at t ime of download.
Managerial ownership-induced
income smoothing and
information asymmetry
Ahsan Habib and Haiyan Jiang
Department of Accounting, Auckland University of Technology,
Auckland, New Zealand
Abstract
Purpose– The purpose of this paper is to examine whether managerial ownership-induced income smoothing accentuates or attenuates an information asymmetry problem. Standard agency theory suggests that managerial ownership may play a significant role in alleviating agency problems between managers and external shareholders that can arise from information asymmetry. According to this view, managerial ownership-induced income smoothing could convey managerial private information and could, therefore, be considered as informative. However, managerial ownership could also entrench managers with absolute control of firms, and encourage them to engage in earnings manipulation, including earnings smoothing, in order to hide private benefits of control.
Design/methodology/approach– The paper uses two smoothing measures, and separate total smoothing into its innate and discretionary components. The former is determined by firm fundamentals, whereas discretionary smoothing allows managers the flexibility to use it for either informative or opportunistic reasons. The paper then regresses information asymmetry, as proxied by scaled bid-ask-spreads, on the interaction between managerial ownership and both these smoothing components.
Findings– The paper documents that managerial ownership-induced discretionary smoothing has a positive effect on bid-ask spreads. This result seems to support the entrenchment view of managerial ownership.
Practical implications– This study offers insights to policy makers interested in enhancing the effectiveness of the managerial ownership aspect of corporate governance in New Zealand.
Originality/value– This paper uses agency theory to provide a comparative assessment of the efficient versus the entrenchment hypotheses with respect to managerial ownership.
KeywordsManagerial ownership, Management accountability, Innate smoothing, Discretionary smoothing, Information asymmetry, Corporate governance, New Zealand
Paper typeResearch paper
1. Introduction
This paper investigates the impact of managerial ownership-induced income smoothing on information asymmetry. Income smoothing is conceptualised as managerial reporting discretion designed to intentionally dampen the fluctuations in a firm’s actual earnings (Biedleman, 1973). There are competing arguments regarding the beneficial effects of income smoothing. On the one hand, income smoothing allows managers to make public their private information about a firm’s future earnings, thereby making earnings prediction easier. Smoothed earnings are also perceived by investors as being less risky (Ronen and Sadan, 1981; Chaney and Lewis, 1995;
The current issue and full text archive of this journal is available at www.emeraldinsight.com/0114-0582.htm
The authors would like to thank two anonymous reviewers and the Editor, Mike Bradbury for their helpful comments.
Ownership-induced income
smoothing
211
Pacific Accounting Review Vol. 24 No. 2, 2012 pp. 211-232
qEmerald Group Publishing Limited 0114-0582 DOI 10.1108/01140581211259839
Tucker and Zarowin, 2006; Grahamet al., 2005)[1]. On the other hand, managers may smooth income in an attempt to garble earnings for private benefit (Healy, 1985; Fudenberg and Tirole, 1995; DeFond and Park, 1997).
Over the years researchers have identified a number of factors encouraging managerial income smoothing practices, for example, managerial bonus compensation (Healy, 1985; Moses, 1987), managers’ job security concerns (DeFond and Park, 1997; Ahmed et al., 2006), product market competition (Tinaikar and Xue, 2011), relationship-specific investments with suppliers and customers at the national and international levels (Raman and Shahrur, 2008; Douet al., 2010), country-level investor protection and legal enforcement mechanisms (Leuz et al., 2003), and firm-level ownership structure including managerial ownership (Carlson and Bathala, 1997; Habib, 2005; LaFondet al., 2011).
With regard to the effects of managerial ownership on managers’ reporting incentives, economics theory identifies two contrasting effects: the incentive alignment effect and the management entrenchment effect. Traditional agency theory argues that considerable agency problems exist between managers and outside shareholders because of a separation between ownership and control ( Jensen and Meckling, 1976). The agency theory view proposes that shareholdings held by managers help align their interests with those of shareholders. In contrast, Morcket al.(1988) argue that greater ownership would provide managers with deeper entrenchment and, therefore, greater scope for opportunistic behavior. From a financial reporting perspective, the alignment view proposes an informational perspective of income smoothing. Since managerial interest is aligned with that of the outsiders, income smoothing can be considered a rational managerial response. In contrast, the opportunistic view would suggest that managerial ownership-induced income smoothing could be an instrument for concealing private benefits of control. Because of the existence of these two competing predictions for income smoothing, a positive association between managerial ownership and income smoothing, does not necessarily imply an informational role for income smoothing.
Our paper is motivated by this ongoing debate on the informational versus opportunistic view of income smoothing. To provide a more powerful test of these competing hypotheses, we separate total smoothing into its innate and discretionary components. The former is determined by firm fundamentals, whereas discretionary smoothing allows managers the flexibility to use it for either informative or opportunistic reasons[2]. We, therefore, examine the effect of managerial ownership-induced discretionary smoothing (defined as the interaction between managerial ownership and discretionary smoothing) on information asymmetry.
From a capital market perspective, we hypothesise that if investors perceive discretionary smoothing incentives to be opportunistic, then they are going to widen the bid-ask spread to price-protect themselves and, therefore, increase the asymmetric information component of the cost of capital. This proposition is based on the adverse selection hypothesis, which suggests that the bid-ask spreads are likely to be set wider by market makers or specialists in a market with more informed traders (Stoll, 1978, 1989). Due to their managerial positions, directors and managers have access to inside information. Being aware of directors and managers’ information advantages, other market participants could widen bid-ask spreads to avoid this asymmetric information risk (Bagehot, 1971; Copeland and Galai, 1983; Glosten and Milgrom, 1985). So, large managerial shareholdings should be associated with a greater information asymmetry.
PAR
24,2
212
A number of empirical research studies support such a positive association (Demsetz, 1968; Hamilton, 1978; Heflin and Shaw, 2000; Jenningset al., 2002; Rubin, 2007). On the contrary, a negative association between the two is expected if market participants perceive that income smoothing conveys managerial private information which helps to attenuate an information asymmetry problem.
Using data from New Zealand we document a significant positive association between managerial ownership-induced discretionary smoothing and information asymmetry proxied by bid-ask spreads. We contribute to the ongoing debate on the controversial role of income smoothing by assessing the effect of an important governance mechanism upon information asymmetry. Our evidence seems to suggest that managerial ownership may not perform an effective governance function, at least from an information provision perspective. This finding should be of interest to prospective investors who may weigh the relative benefits and costs of managerial shareholdings in the companies they are investing in. The finding should also inform regulators about whether to strengthen alternative governance mechanisms if managerial shareholdings are found to be opportunistic.
Our paper proceeds as follows. In the next section we provide a brief review of the income smoothing literature and develop our testable hypothesis. Section 3 explains the research design issues. Section 4 outlines our sample selection procedure and provides relevant descriptive statistics. Section 5 provides the test results and Section 6 concludes.
2. Income smoothing, managerial ownership and information asymmetry In their seminal article, Jensen and Meckling (1976) argue that divergence of interests and the inability of principals to observe agents’ actions lead to moral hazards and to an inherent conflict of interest between principals and agents which generates agency cost. One way to minimize this conflict is to make managers part owners of the company. With regard to the effects of managerial ownership on managers’ incentives, economics theory identifies two contrasting perspectives: the incentive alignment effect and the management entrenchment effect. The incentive alignment effect is expected to be more pronounced with an increase in managerial ownership ( Jensen and Meckling, 1976). In contrast, the entrenchment hypothesis propounded by Morcket al.
(1988) argues that greater ownership would provide managers with greater scope for opportunistic behavior. Researchers have tested these two opposing perspectives by relating managerial ownership to financial reporting quality. Warfield et al. (1995) document that informativeness of earnings increases, and that earnings management decreases, with an increase in managerial share ownership. In contrast, Fan and Wong (2002) show that concentrated ownership reduces the informativeness of earnings, and
Baiket al.(2010) reveal that firms having high levels of managerial ownership have
relatively poor analyst coverage, less likelihood of issuing management earnings forecasts, and less accurate and more optimistic management forecasts[3].
Income smoothing is a special case of earnings management where managers smooth out inter-temporal volatility in reported earnings to deliver a stable earnings stream (Biedleman, 1973). Gordon (1964) developed four propositions to contextualize income smoothing as a rational managerial action based on the assumptions that:
. managers act to maximize their utility;
. such utility depends on the firm’s share values;
Ownership-induced income
smoothing
213
. achievement of utility maximization and increased share values depends in part
on the satisfaction of the stockholders with the corporate performance; and
. stockholder satisfaction, in turn, depends on the stability of corporate income
which promotes income smoothing.
Fudenberg and Tirole (1995, p. 75) defined income smoothing as “the process of manipulating the time-profile of earnings or earnings reports to make the reported income stream less variable, while not increasing reported earnings over the long run”. Prior research on the effect of managerial ownership on income smoothing has documented a positive association (Carlson and Bathala, 1997; Kamin and Ronen, 1978; LaFondet al., 2011), an insignificant association (Moses, 1987; Leuzet al., 2003), and a negative association (Habib, 2005; Atik, 2009). We argue that using total rather than a discretionary component of income smoothing may have contributed to this mixed evidence. We address this concern in our research design choice.
We now discuss the implications of income smoothing for capital market participants. Analytical models for income smoothing predict that smoothed earnings will reduce both earnings volatility and the cost of capital. For example, Goel and Thakor (2003) show that increased volatility associated with unsmoothed earnings increases the potential loss suffered by uninformed stockholders when they trade for liquidity reasons. This situation discourages uninformed investors from actively participating in stock trading, with the consequences of increased illiquidity and reduced stock price. The rational manager responds to such a situation by smoothing earnings in order to affect market perceptions of earnings volatility and, hence, the firm’s stock price. Smoothed earnings can help reduce information asymmetry in the market place since earnings prediction is perceived to be easier when current earnings are smoothed. Similar predictions are made in other analytical models too (Trueman and Titman, 1988; Dye, 1988; Sankar and Subramanyam, 2001; Kirschenheiter and Melumad, 2002; Goel and Thakor, 2003). Empirical evidence, however, is not always consistent with analytical predictions.
Franciset al.(2004) find a strong negative association between income smoothing and the cost of equity capital estimates, based on the Value Line forecasts of future stock prices and dividends. McInnis (2010), however, fails to find any association between earnings smoothness and average stock returns using a long time-series of US data. Michelsonet al.(1995) find that US smoothers have a lower ten-year annualised return than non-smoothers, but in a subsequent study they find that US smoothers have a higher cumulative average abnormal return than non-smoothers (Michelsonet al., 2000). Wang and Williams (1994) find that the market response to earnings for firms with a smooth income series is four times as large as that for other firms. International evidence seems to support an entrenchment view of smoothing as Bhattacharyaet al.(2003) find a positive effect of income smoothing on the cost of capital and LaFondet al.(2011) report that firms with greater discretionary smoothing experience significantly higher bid-ask spreads and lower trading volumes. From a firm valuation perspective, Bao and Bao (2004) report that more income smoothing does not necessarily imply higher firm valuation, but that only when the smoothed earnings stream is accompanied by high quality earnings, will there be a valuation premium. Huang et al. (2009) reveal that firm value increases with real smoothing (derivative usage) but decreases with artificial smoothing (abnormal accruals).
PAR
24,2
214
Although these studies provide some important insights into the market behaviour of managerial income smoothing practices, they remain silent on the effect of managerial ownership on discretionary smoothing and consequent market behavior. We develop the following testable hypothesis to examine this issue. In developing the hypothesis we consider the contrasting perspectives of incentive alignment and entrenchment hypothesis. To provide a more powerful test of these competing hypotheses, we separate total smoothing into its innate and discretionary components. The former is determined by firm fundamentals, whereas discretionary smoothing allows managers the flexibility to use it for either informative or opportunistic reasons. We, therefore, examine the effect of managerial ownership-induced discretionary smoothing, defined as the interaction between managerial ownership and discretionary smoothing, on information asymmetry. The following two testable hypotheses are developed:
H1a. If discretionary smoothing accentuates information asymmetry between managers and shareholders then there will be a positive association between managerial ownership-induced discretionary smoothing and bid-ask spreads (entrenchment hypothesis).
H1b. If discretionary smoothing attenuates information asymmetry between managers and shareholders then there will be a negative association between managerial ownership-induced discretionary smoothing and bid-ask spreads (incentive alignment hypothesis).
3. Research design
To testH1aandH1b, we employ a two-step procedure. First, we determine the innate component of smoothing (INNSMTH) by estimating the following regression equation based on prior research (Franciset al., 2004; LaFondet al., 2011):
SMTHit¼a0þb1SIZEitþb2LEVERAGEitþb3sSALESitþb4LOSSit þb5GROWTHitþb6AVGOCFitþb7DIVIDENDitþb8OPLEVitþ1
ð1Þ
the subscripts “i” and “t” represent firm and year, respectively.
The dependent variable SMTH is our income smoothing measure calculated using two alternative approaches:
SMTH1 ¼[sNI/sOCF], where NI is net income after extraordinary items after tax and OCF is operating cash flows; both deflated by beginning-of-period total assets. Standard deviations are calculated using a three-year rolling window period. SMTH1 is multiplied by negative one so that larger values, i.e. values closer to zero represent more income smoothing.
SMTH2 ¼ the correlations between change in operating cash flows (DOCF) and change in total accruals (DTACCR) with both variables scaled by average total assets. The correlations are calculated using a three-year rolling window period. Total accruals are calculated as the difference between NI and OCF scaled by beginning-of-period
Ownership-induced income
smoothing
215
total assets. SMTH2 is also multiplied by negative one so that values closer to one represent more income smoothing.
SIZE ¼ natural log of total assets.
LEVERAGE ¼ total liabilities divided by total assets.
sSALES ¼ standard deviation of sales scaled by total assets calculated over a three-year rolling window period.
LOSS ¼ a dummy variable coded 1 for negative profit observations, and zero otherwise.
GROWTH ¼ firm’s growth opportunities and is defined as the market-to-book ratio (market capitalization/shareholders equity).
AVGOCF ¼ average OCF scaled by total assets calculated over a three-year rolling window period.
DIVIDEND ¼ cash dividends divided by average total assets.
OPELEV ¼ operating leverage measured as net property, plant, and equipment (PPE) divided by total assets.
We derive two INNSMTH values, one for each smoothing measure, using the regression coefficients from equation (1). We denote these as INNSMTH1 and INNSMTH2, respectively. Our proxy for discretionary smoothing is calculated as the difference between total smoothing (SMTH) and INNSMTH. We denote these as DISCSMTH1 and DISCSMTH2, respectively.
For descriptive analysis purpose we regress the INNSMTH and DISCSMTH components of total smoothing on managerial ownership (MOWN) variable as in equations (2) and (2a) below. Prior research on the association between income smoothing and managerial ownership has used total smoothing as opposed to disaggregated smoothing measures (Carlson and Bathala, 1997) and found inconclusive evidence. We focus on the coefficient of MOWN equation (2a) because the theoretical predictions of incentive alignment or entrenchment hypothesis are more relevant for the component of smoothing that is under managerial discretion:
INNSMTHit¼d0þd1MOWNitþ1it ð2Þ DISCSMTHit¼d0þd1MOWNitþ1it ð2aÞ MOWN¼percentage managerial ownership as disclosed in the top five security holder disclosures in the annual reports. We include multiple measures of MOWN for each firm (if available) instead of calculating once for each firm. For example, managerial ownership of Rakon Limited amounts to 15.62, 15.64 and 15.66 percent in 2009, 2008 and 2007, respectively, and are included for all three separate years[4].
Second, we develop the following regression equations to examine the effect of managerial ownership-induced discretionary income smoothing on information asymmetry. Our dependent variable is bid-ask spread, a proxy for information asymmetry. Independent variables of primary interest are the interaction between MOWN and DISCS0MTH in equations (3a) and (3b) below:
PAR
24,2
216
SCABAS2it¼ a0þb1MOWNitþb2INNSMTHitþb3MOWNit*INNSMTHit þb4LPRICEitþb5ACAR2itþb6AAV2itþ1it
ð3Þ
SCABAS2it¼ g0þg1MOWNitþg2DISCSMTHitþg3MOWNit*DISCSMTHit þg4LPRICEitþg5ACAR2itþg6AAV2itþ1it
ð3aÞ
SCABAS2it¼ w0þw1MOWNitþw2INNSMTHitþw3MOWNit*INNSMTHit þw4DISCSMTHitþw5MOWNit*DISCSMTHitþw6LPRICEit
þw7ACAR2itþw8AAV2itþ1it
ð3bÞ
SCABAS2 ¼ the bid-ask spread for a two-day return window scaled by share price on annual report release date. Whether bid-ask spread should be measured annually or around a narrow window surrounding annual report release date had to be determined. We decided to focus on the latter because we wanted to ensure that ownership data as well as fundamental performance variables, e.g. earnings and cash flows, for estimating smoothing measures were available to shareholders. We also provide a sensitivity analysis with SCABAS measured over a seven-day return window (SCABAS7it).
Prior research suggests that although most market reaction to new information occurs on days 21 and 0 relative to the earnings announcement date, it persists up to five days afterwards (Utama and Cready, 1997).
LPRICE ¼ the natural log of closing share price two days before the annual report release date. Share price is found to be negatively correlated to spreads (Branch and Freed, 1977; Fabozzi, 1979; Heflin and Shaw, 2000).
ACAR2 ¼ mean-adjusted absolute abnormal returns (ACAR2) during the two-day event window around annual report release date. This is calculated using the following formula:
CARð21;0Þ ¼
X
Rð21;0Þ22*MRð270;211Þ
where, R is the daily raw return in two-day time periods around annual report release date. MR (270,211) is the mean stock return during trading days (270,211). Since business or economic cycles can strongly affect stock prices, the mean stock returns of trading days (270,211) are used to control for any unusual returns behaviour shortly before the annual report release date. Returns are calculated based on NZX Data. Absolute abnormal returns is a proxy for liquidity and therefore is expected to have an impact on the bid-ask spread because of the known correlation between liquidity and bid-ask spread (Berkman, 1992).
AAV2 ¼ absolute abnormal trading volume and is calculated as the absolute value of the difference between mean daily trading volume around annual report release dates (21, 0) and the mean daily trading volume
Ownership-induced income
smoothing
217
during a specified pre-annual report release date (270, 211) (Chordia et al., 2001). AAV2 is scaled by number of outstanding shares and is expected to be negatively associated with bid-ask spread (Berkman, 1992).
We are interested in the sign and statistical significance of the interaction termg3in
regression (3a), and w5 in regression (3b) above. If management ownership-induced
discretionary smoothing accentuates (attenuates) the information asymmetry problem then we should expect the coefficients to be positive (negative), respectively. We include INNSMTH in the regression equations to control for the innate determinants of income smoothing but do not develop any prediction.
In an unbalanced panel data setting, we conduct regression analysis employing the variants of the panel corrected standard error (PCSE) methodology to estimate efficient estimators robust to potential heteroscedasticity and autocorrelation in the disturbances (Beck and Katz, 1995). Industry dummy variables are used to control for industry effects.
4. Sample selection and descriptive statistics
Our sample consists of all listed and delisted companies on the New Zealand Stock Exchange (NZX) for the period of 1998-2009. We began with 1998 as data coverage for New Zealand companies prior to this year was not extensive. Because we require at least three consecutive years of net income, OCF, and total assets data to calculate smoothing, our regression analysis begins in 2000 and ends in 2009. Our initial sample size was 1,134 firm-year observations including financial institutions. We excluded 144 observations pertaining to financial institutions because of their unique accounting and reporting systems. We then deleted 17 negative book equity observations as the definition of GROWTH in equation (1) requires only positive book equity observations. We then deleted 117 observations due to the requirement of having at least three years of consecutive data including the current year. Our final sample size for the SMTH1 measure was 855 firm-year observations. For the SMTH2 measure the corresponding sample size was 785 firm-year observations. The fewer sample observations for the SMTH2 measure is due to the additional data requirement, since this measure adopts a change version (the correlation between change in DOCF and DTACCR) which requires an additional year of data and hence a deletion of 187 firm-year observations. We obtained managerial ownership data for these sample observations from the “percentage share owned by each of the top five largest shareholders” as disclosed in the “Substantial Security Holders” section of the annual reports. Our sample size reduced to 827 (759) firm-year observations for SMTH1 and SMTH2, respectively, for the information asymmetry analysis because of some missing observations on bid-ask spread data. Table I outlines the sample selection process.
Table II, Panel A, provides descriptive statistics of the variables used in our analysis. All the variables have been winsorised at the top and bottom 1 percent of their respective distributions to control for the effect of outliers. The SMTH1 measure varies considerably with a maximum of20.05 to a minimum of231.67. Recall that values closer to zero represent more income smoothing. The SMTH2 measure, on the other hand, is bounded between the correlation values of 21.00 to 1.00 with values closer to 1.00 representing more smoothing. The mean MOWN is 5.2 percent with a standard deviation of 0.13. The mean MOWN is comparable with that of
PAR
24,2
218
Carlson and Bathala (1997). Their calculation of the smoothing measure, however, differs from our approach and, hence, can’t be compared. About 21 percent of the sample observations are loss-making firms, although firms overall are characterized by above average growth potentials. The mean (median) of scaled bid-ask spread for a two-day return window, SCABAS2, is 0.038 (0.019), respectively. Panel B provides industry breakdown of our sample. Our sample comes from a wide variety of industries with “consumer” and “investment and other service” industries comprising 30 percent of the total firm-year observations. We include industry dummies in all our regression models to control for industry-wide variation that could affect managerial smoothing choices.
Panels C and D of Table II contain the correlation coefficients among the variables. In Panel C we present the correlation coefficients for the variables used to determine innate smoothing. The two smoothing measures are positively and significantly correlated (correlation coefficient 0.25). The correlation between MOWN and SMTH1 is20.01 and between MOWN and SMTH2 is 0.04, none of which are significant at the conventional level. However, our regression estimations are based on the discretionary component of smoothing instead of the total smoothing measure. SMTH1 is positively associated with firm leverage and operating leverage but is negatively associated with dividend and firm profitability. Similar results are obtained with the SMTH2 measure. None of the pair-wise correlations between the independent variables is high enough to warrant multicollinearity concern. The highest variance inflation factor (VIF) score is 1.39 associated with SIZE. Untabulated correlation analysis documents a positive and significant association between DISCSMTH1 and DISCSMTH2 with MOWN (correlation coefficient 0.08 and 0.09, respectively, significant at better than the 5 percent level, two-tailed test).
Panel D of Table II contains the correlation coefficients among the variables used in the information asymmetry test. SCABAS2 is negatively and significantly associated with LPRICE. The correlation between SCABAS2 and ACAR2 is positive and that of SCABAS2 and AAV2 is negative. Both these correlation coefficients are significant.
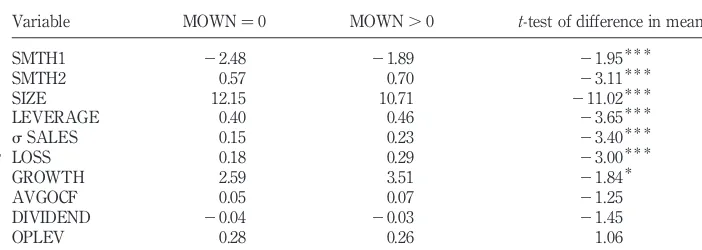
Table III presents a univariate analysis of the difference in means of the test variables between firm-year observations with zero and non-zero MOWN, respectively. Results show that firms with non-zero MOWN are more inclined to smooth earnings compared to their zero MOWN counterpart (differences in mean for both the SMTH1 and SMTH2 measures are significant). Zero MOWN firm-year observations are smaller, more leveraged, incur losses more often and exhibit higher variability in sales compared to their non-zero MOWN counterparts. This analysis reinforces
SMTH1 SMTH2
Number of firm year observations from 1998-2009 1,134 1,134 Less: firm-year observations from financial institutions (144) (144) Less: negative book equity observations (17) (17) Less: observations lost due to three-year data requirement for
calculating the smoothing measures (117) (187) Final usable sample for estimating regression equation (1) 855 785 Less: missing bid-ask spread observations (28) (26)
Final sample for estimating regression equations (3)-(3b) 827 759 Sample selectionTable I.
Ownership-induced income
smoothing
219
Panel A: descriptive statistics
Variable n Mean Median SD Maximum Minimum
SMTH1 855 22.33 20.84 4.67 20.05 231.67
SMTH2 785 0.60 0.91 0.59 1.00 21.00
INNSMTH1 855 24.12 23.73 1.18 0.79 27.85
INNSMTH2 785 20.93 20.90 0.14 20.69 21.64
DISCSMTH1 855 1.79 2.89 4.44 6.75 228.16
DISCSMTH2 785 1.53 1.78 0.57 2.49 20.13
MOWN 855 0.05 0.000 0.125 0.671 0.000
SIZE 855 11.79 11.99 1.915 16.01 4.87
LEVERAGE 855 0.413 0.395 0.218 0.995 0.002
sSALES 855 0.172 0.077 0.280 3.918 0.000
LOSS 855 0.208 0.000 0.406 1.000 0.000
GROWTH 855 2.820 1.329 5.446 39.38 0.18
AVGOCF 855 0.074 0.046 0.319 4.87 0.000
DIVIDEND 855 20.040 20.026 0.068 0.000 21.44
OPLEV 855 0.275 0.199 0.261 0.970 0.00
SCABAS2 827 0.038 0.019 0.30 4.17 21.13
LPRICE 827 0.274 0.247 1.216 3.54 24.71
ACAR2 827 0.033 0.013 0.146 3.89 0.00
AAV2 827 0.001 0.000 0.003 0.05 0.00
Panel B: industry breakdown
Industry category Observations
Percentage of total observations Agriculture and fishing 75 8.8 Building materials and
construction 10 1.2
Consumer 130 15.2
Energy processing 56 6.5
Investment and other service 129 15.1
Food and beverage 30 3.5
Forestry and forest products 13 1.5 Intermediate and durables 105 12.3
Leisure and tourism 50 5.8
Media and
telecommunications 33 3.9
Mining 35 4.1
Ports 53 6.2
(continued)
Table
II.
Descriptive
information
on
variables
PAR
24,2
220
Property 95 11.1
Textiles and apparel 11 1.3
Transport 30 3.5
Total 855 100.00
Panel C: correlation analysis among variables used to determine innate smoothing
(1) (2) (3) (4) (5) (6) (7) (8) (9) (10)
SMTH1 (1) 1
SMTH2 (2) 0.25* * * 1
SIZE (3) 20.01 0.04 1
LEVERAGE (4) 0.07* 0.11* * * 0.16* * * 1
sSALES (5) 20.04 20.05 20.31* * * 0.15* * * 1
LOSS (6) 20.28* * * 20.17* * * 20.37* * * 0.03 0.19* * * 1
GROWTH (7) 20.02 20.11* * * 20.26* * * 0.14* * * 0.24* * * 0.28* * * 1
AVGOCF (8) 0.08* 0.16* * * 0.25* * * 0.03 20.23* * * 20.39* * * 20.15* * * 1
DIVIDEND (9) 20.11* * * 20.07* 20.09* * 0.13* * * 20.03 0.30* * * 0.009 20.37* * * 1
OPLEV (10) 0.16* * * 0.11* * * 0.16* * * 0.01 20.10* * 20.27* * * 20.04 0.20* * * 20.17* * * 1 Panel D: correlation analysis of information asymmetry variables
SCABAS2 LPRICE ACAR2 AAV2
SCABAS2 1.00
LPRICE 20.15* * * 1.00
ACAR2 0.07* * 20.12* * * 1.00
AAV2 20.10* * 20.04 0.08* * 1.00
Notes:Statistically significant at a probability of*,0.01,* *,0.05 and* * *,0.01 (two-tailed test); variable definitions: SMTH1is calculated assNI/sOCF, where NI is net income after extraordinary items after tax and OCF is operating cash flows; both are deflated by beginning-of-period total assets; standard deviations are calculated using a three-year rolling window period; SMTH1 is multiplied by negative one so that larger values, i.e. values closer to zero, represent more smooth earnings; SIZE is the natural log of total assets; LEVERAGE is calculated as total liabilities divided by total assets;sSALES is standard deviation of sales scaled by total assets calculated over a three-year rolling window period; LOSS is a dummy variable coded 1 for negative profit observations, and zero otherwise; GROWTH is firm’s growth opportunities and is defined as the market-to-book ratio (market capitalization/shareholders equity); AVGOCF is average OCF scaled by total assets calculated over a three-year rolling window period; DIVIDEND is cash dividends divided by average total assets; OPELEV is operating leverage measured as net property, plant, and equipment (PPE) divided by total assets; INNSMTH1 is the predicted value using the regression coefficients derived from equation (1); DISCSMTH1 is the difference between actual smoothing (SMTH1) and INNSMTH1; MOWN is percentage managerial ownership as disclosed in the top five security holder disclosures in the annual reports; SCABAS2itis the bid-ask spread scaled
by share price of firmion annual report release date in yeartfor a two-day return window; LPRICEitis the natural log of closing share price two days before the annual report
release date; ACAR2 is mean-adjusted absolute abnormal returns (ACAR2) during the two-day event window around annual report release date calculated as CARð21;0Þ ¼
P
Rð21;0Þ22*MRð270;211Þ, R is the daily raw return in two-day time periods around annual report release date; MR(270,211) is the mean stock return during trading days (270,211); since business or economic cycles can strongly affect stock prices, the mean stock returns of trading days (270,211) are used to control for any unusual returns behaviour shortly before the annual report release date; returns are calculated based on data provided by NZX Data; AAV2 is the absolute abnormal trading volume is calculated as the absolute value of the difference between mean daily trading volume around annual report release dates (21, 0) and the mean daily trading volume during a specified pre-annual report release date (270,211); AAV2 is scaled by number of outstanding shares
Table
II.
Ownership-induced
income
smoothing
221
the importance of controlling for innate determinants of smoothing so that the discretionary component can capture the market perception of informative versus opportunistic use of income smoothing.
5. Test results
5.1 Innate and discretionary component of smoothing and managerial ownership
Table IV, Panel A provides regression results for innate determinants of income smoothing as modeled in equation (1). The dependent variable, SMTH, in regression equation (1) is regressed on a number of firm-specific (innate) variables theorized to affect income smoothing choices. Columns (ii) and (iv) present estimated coefficients for the SMTH1 and SMTH2 measures, respectively. The sign of the variables is generally consistent across the smoothing measures although significance level varies. Firm size is negatively related to income smoothing for the SMTH1 measure (coefficient of20.20,
t-statistic, 22.14). Larger firms are more likely to engage in income smoothing because:
. They receive more publicity, as well as regulatory and governmental actions
compared to their small firm counterparts. Regulators may consider large upward earnings fluctuations to be a sign of monopolistic practice, while large downward fluctuations may signal crisis and cause panic (Moses, 1987, p. 362).
Variable MOWN¼0 MOWN.0 t-test of difference in mean
SMTH1 22.48 21.89 21.95* * *
SMTH2 0.57 0.70 23.11* * *
SIZE 12.15 10.71 211.02* * *
LEVERAGE 0.40 0.46 23.65* * *
sSALES 0.15 0.23 23.40* * *
LOSS 0.18 0.29 23.00* * *
GROWTH 2.59 3.51 21.84*
AVGOCF 0.05 0.07 21.25
DIVIDEND 20.04 20.03 21.45
OPLEV 0.28 0.26 1.06
Notes:Statistically significant at a probability of *,0.01, * *,0.05 and * * *,0.01 (two-tailed
test); variable definitions: SMTH1is calculated as s NI/s OCF, where NI is net income after extraordinary items after tax and OCF is operating cash flows; both are deflated by beginning-of-period total assets; standard deviations are calculated using a three-year rolling window beginning-of-period; SMTH1 is multiplied by negative one so that larger values, i.e. values closer to zero, represent more smooth earnings; SMTH2 is the correlation betweenDOCF and change in total accruals (DTACCR) calculated using a three-year rolling window period; TACCR are calculated as the difference between NI and OCF scaled by lagged total assets; SMTH2 is also multiplied by negative one so that values closer to 1 represent more smoothing; SIZE is the natural log of total assets; LEVERAGE is calculated as total liabilities divided by total assets;sSALES is standard deviation of sales scaled by total assets calculated over a three-year rolling window period; LOSS is a dummy variable coded 1 for negative profit observations, and zero otherwise; GROWTH is firm’s growth opportunities and is defined as the market-to-book ratio (market capitalization/shareholders equity); AVGOCF is average OCF scaled by total assets calculated over a three-year rolling window period; DIVIDEND is cash dividends divided by average total assets; OPELEV is operating leverage measured as net property, plant, and equipment (PPE) divided by total assets
Table III.
Univariate comparison among the explanatory variables between firm-year observations with and without MOWN
PAR
24,2
222
Panel A: innate determinants of income smoothing
SMTHit¼a0þb1SIZEitþb2LEVERAGEitþb3sSALESitþb4LOSSitþb5GROWTHitþ b6AVGOCFitþb7DIVIDENDitþb8OPLEVitþ1
(1)
SMTH1 SMTH2
Variables Coefficient Coefficient
Constant 1.56 (1.29) 0.84* * * (4.57)
SIZE 20.20* * (22.14) 20.01 (20.96)
LEVERAGE 1.14 (1.47) 0.35* * * (3.14)
sSALES 21.13* * ( 20.16
22.00) (21.47)
LOSS 23.09* * * ( 20.24* * *
25.92) (23.65)
GROWTH 0.03 (1.22) 20.008 (21.55)
AVGOCF 1.66* (1.85) 20.06 (
20.64)
DIVIDEND 20.43 (20.36) 20.75 (21.44)
OPLEV 20.19 (20.41) 20.05 (20.46)
Industry dummies Yes Yes Yes Yes
AdjustedR2 0.20 0.20 0.10 0.10
Observations 855 855 785 785
(continued)
Table
IV.
Innate
and
discretionary
smoo
thing
and
managerial
ownership
Ownership-induced
income
smoothing
223
Panel B: managerial ownership and innate and discretionary smoothing
INNSMTHit¼d0þd1MOWNitþ1it ð2Þ
DISCSMTHit¼d0þd1MOWNitþ1it ð2aÞ
SMTH1 SMTH2
INNSMTH1 DISCSMTH1 INNSMTH2 DISCSMTH2
Variables Coefficient Coefficient Coefficient Coefficient
Constant 23.81* * * (210.15) 1.74* * * (10.17) 0.44* * * (8.46) 1.51* * * (6.58)
MOWN 0.35 (0.28) 0.87 (0.81) 0.05 (1.06) 0.40* * * (3.35)
Industry dummies Yes Yes Yes Yes Yes Yes Yes Yes
AdjustedR2 0.09 0.09 0.13 0.13 0.11 0.11 0.06 0.06
Observations 855 785
Notes: Statistically significant at a probability of *,0.01, * *,0.05 and * * *,0.01 (two-tailed test); t-statistics are in parentheses; variable
definitions: SMTH1is calculated assNI/sOCF, where NI is net income after extraordinary items after tax and OCF is operating cash flows; both are
deflated by beginning-of-period total assets; standard deviations are calculated using a three-year rolling window period; SMTH1 is multiplied by
negative one so that larger values, i.e. values closer to zero, represent more smooth earnings; SMTH2 is the correlation betweenDOCF and change in total
accruals (DTACCR) calculated using a three-year rolling window period; TACCR are calculated as the difference between NI and OCF scaled by lagged
total assets; SMTH2 is also multiplied by negative one so that values closer to 1 represent more smoothing; SIZE is the natural log of total assets;
LEVERAGE is calculated as total liabilities divided by total assets;sSALES is standard deviation of sales scaled by total assets calculated over a
three-year rolling window period; LOSS is a dummy variable coded 1 for negative profit observations, and zero otherwise; GROWTH is firm’s growth opportunities and is defined as the market-to-book ratio (market capitalization/shareholders equity); AVGOCF is average OCF scaled by total assets calculated over a three-year rolling window period; DIVIDEND is cash dividends divided by average total assets. OPELEV is operating leverage measured as net property, plant, and equipment (PPE) divided by total assets; MOWN is percentage managerial ownership as disclosed in the top five security holder disclosures in the annual reports
Table
IV.
PAR
24,2
224
. Larger firms have a wide array of smoothing instruments available (e.g. research
and development expenditure, non-recurring items, etc.) compared to smaller firms.
. Large, mature firms should have synchronized revenue and expense cycles
because fewer uncertainties in the environment lead to their earnings being naturally, rather than artificially, smoothed.
On the other hand, larger firms may have less incentive to smooth earnings since they receive more attention from analysts and investors and, therefore, more is known of them. Consequently, little additional value is derived from income smoothing (Ashari et al., 1994).Firm leverage is expected to have a positive effect on income smoothing behavior, since the cost of violating debt agreements may be reduced by giving an impression that the company maintains a steady flow of income through smoothing income (Moses, 1987). The coefficient on LEVERAGE is positive and statistically highly significant for the SMTH2 measure. Firms with less volatile sales, less frequent losses and more volatile OCF are found to report smoother earnings. Firm growth, dividend status and degree of operating leverage have no significant effect on income smoothing practices. These variables together explain about 20 (10 percent) of the variation in income smoothing for SMTH1 (SMTH2) measures, respectively.
We use the predicted coefficients from regression (1) to calculate the INNSMTH component of smoothing, and derive DISCSMTH by subtracting INSMTH from SMTH. We then regress both innate and discretionary smoothing on managerial ownership variables in Panel B, of Table IV. Because INNSMTH reflects smoothing due to fundamental firm characteristics, we expect the association between SMTH and MOWN, if any, to be captured by the DISCSMTH component. We find evidence consistent with this proposition for the SMTH2 measure where the coefficient on MOWN is positive and statistically significant at the 1 percent level (coefficient value of 0.40, t-statistic, 3.35). For the SMTH1 measure, the coefficient on MOWN is also positive, but insignificant at the conventional significance level.
5.2 Management ownership-induced income smoothing and information asymmetry
Table V presents regression results of equations (3)-(3b) designed to test our hypothesis. equations (3) and (3a) separately tests the effect of managerial ownership-induced innate and discretionary smoothing on bid-ask spreads. equation (3b) includes both these variables in the same regression equation and provides a direct test of our hypothesis. For each SMTH measure we include results in three separate columns. Columns (2)-(4) present regression results of equations (3)-(3b) for SMTH1, while columns (5)-(7) present results relate to SMTH2.
Our variable of primary interest is the interactive coefficient MOWN*DISCSMTH in equation (3b) that captures the effect of managerial ownership-induced discretionary smoothing on bid-ask spreads. For SMTH1 measure, the coefficient in column (4) is positive and statistically highly significant (coefficient 0.09, t-statistic 7.05). We document the same result for SMTH2 although, unlike that for SMTH1, the coefficient on MOWN*DISCSMTH in column (7) is significant at the 5 percent level (coefficient 0.17,
t-statistic, 1.98). The coefficient on managerial ownership-induced innate smoothing is insignificant in all the regression specifications. The findings suggest that market participants consider managerial ownership-induced discretionary smoothing to be
Ownership-induced income
smoothing
225
SCABAS2it¼a0þb1MOWNitþb2INNSMTHitþb3MOWNit*INNSMTHitþb4LPRICEitþ b5ACAR2itþb6AAV2itþ1it (3)
SCABAS2it¼g0þg1MOWNitþg2DISCSMTHitþg3MOWNit*DISCSMTHitþg4LPRICEitþ g5ACAR2itþg6AAV2itþ1it (3a)
SCABAS2it¼w0þw1MOWNitþw2INNSMTHitþw3MOWNit*INNSMTHitþw4DISCSMTHit þw5MOWNit*DISCSMTHitþw6LPRICEitþw7ACAR2itþw8AAV2itþ1it (3b)
SMTH1 SMTH2
(2) (3) (4) (5) (6) (7)
Variables Coefficient Coefficient Coefficient Coefficient Coefficient Coefficient
Constant 0.03 (0.31) 0.023 (0.78) 0.03 (0.33) 20.108 (20.90) 0.0026 (0.09) 20.10 (20.98)
MOWN 0.17 20.19* 0.15 0.607
20.28* * 0.37
(0.43) (21.64) (0.56) (0.73) (22.45) (0.45)
INNSMTH 0.0018 (0.10) 0.0014 (0.08) 20.11 (20.96) 20.11 (20.95)
MOWN*INNSMTH 0.055 (0.60) 0.09 (1.22) 0.72 (0.69) 0.78 (0.76)
DISCSMTH – – 20.0013 20.0014 – – 20.004 20.0047
– – (20.76) (20.81) – – (20.26) (20.31)
MOWN*DISCSMTH – – 0.09* * * 0.09* * * – – 0.14* 0.17* *
– – (6.39) (7.05) – – (1.70) (1.98)
LPRICE 20.04* *
20.04* * *
20.04* * *
20.019 20.023* * *
20.02
(22.56) (22.73) (22.59) (21.41) (22.59) (21.41)
ACAR2 0.11* 0.11* * 0.11* * 0.13* * * 0.13* * * 0.13* * *
(1.94) (2.16) (2.21) (3.61) (3.60) (3.64)
AAV2 23.39* * (22.08) 23.64* * (22.25) 23.62* * (22.55) 22.16* * (21.96) 21.89* (21.67) 22.32* * (22.15)
Industry dummies Yes Yes Yes Yes Yes Yes
AdjustedR2 0.04 0.04 0.05 0.01 0.04 0.03
Observations 827 759
Notes:Statistically significant at a probability of *
,0.01,* *
,0.05 and* * *
,0.01 (two-tailed test);t-statistics are in parentheses; variable definitions: INNSMTH1 and INNSMTH2 are predicted values for two smoothing measures using the regression coefficients derived from equation (1); DISCSMTH1 and DISCSMTH2 are the difference between actual smoothing (SMTH) and INNSMTH1 and INNSMTH2, respectively; MOWN is percentage managerial ownership as disclosed in the top five security holder disclosures in the annual reports; SCABAS2itis the bid-ask spread scaled by share price of firmion annual report release date in yeartfor a two-day return window; LPRICEitis the natural log of closing share price two days before the annual report release date; ACAR2 is mean-adjusted absolute abnormal returns (ACAR2) during the two-day event window around annual report release date calculated as CARð21;0Þ ¼
PRð
21;0Þ22*MRð270;211Þ, R is the daily raw return in two-day time periods around annual report release date; MR(270,211) is the mean stock return during trading days (270,211); since business or economic cycles can strongly affect stock prices, the mean stock returns of trading days (270,211) are used to control for any unusual returns behaviour shortly before the annual report release date; returns are calculated based on data provided by NZX Data; AAV2 is the absolute abnormal trading volume is calculated as the absolute value of the difference between mean daily trading volume around annual report release dates (21, 0) and the mean daily trading volume during a specified pre-annual report release date (270,211); AAV2 is scaled by number of outstanding shares
Table
V.
Management
ownership-induced
income
smoothing
and
information
asymmetry
PAR
24,2
226
opportunistic thereby increasing information asymmetry problem. With respect to the control variables used in the regression equations, the coefficient on LPRICE is significantly negatively related to the bid-ask spread in all the regression equations. The coefficient on AAV2, as a measure of trading liquidity, is significantly negative as predicted. Finally, the coefficient on ACAR2 is found to be significantly positive.
5.3 Sensitivity analysis
Estimation of equation (1) without AVGOCF as an independent variable. (a) A reviewer
suggested that we re-estimate regression equation (1) without AVGOCF as an independent variable because OCF appears on both sides of the equation. Untabulated result documents no significant change in our primary result (Table V). For SMTH1 measure, the coefficient on MOWN*DISCSMTH in column (4) of Table V remains unchanged at 0.09 although thet-statistic is reduced to 4.30 which is still significant at better than the 1 percent level. The corresponding coefficient for SMTH2 measure is 0.20 (t-statistic 1.99), a slight increase from the current reported coefficient of 0.17.
Alternative bid-ask spread measurement window. We also use an alternative
measurement window for the information asymmetry proxy, namely SCABAS7 (the bid-ask spread scaled by share price of firmion annual report release date in yeartfor a seven-day return window). Prior research suggests that although most market reaction to new information occurs on days21 and 0 relative to the earnings announcement date, it persists up to five days afterwards (Utama and Cready, 1997). Unreported regression results reveal that the coefficient on MOWN*DISCSMTH1 is positive and statistically
significant at better than the 1 percent level in the comprehensive regression specification (coefficient 0.07,t-statistic 3.99). For SMTH2 measure, however, the coefficient becomes insignificant. Of the control variables, the LPRICE and AAV7 report coefficients that are consistent with theoretical predictions, but the coefficient on ACAR7 loses significance.
Controlling the effect of institutional owners. We include institutional ownership
(INSTHLD) as an additional explanatory variable in equations (3) to (3b) as a sensitivity analysis check. The rationale for doing that stems from the fact that for most of our sample firm-year observations institutional shareholders dominate the top five of the shareholding composition. We want to ensure that the management ownership-induced income smoothing effect on bid-ask spreads is not subsumed by this large group of shareholdings. Untabulated results reveal no significant association between INSTHLD and bid-ask spreads and, more importantly, our main results remain virtually the same.
6. Concluding remarks
We examine the effect of managerial ownership-induced income smoothing on information asymmetry. Our research is motivated by the ongoing debate on the value of income smoothing practices for shareholders. Although survey evidence by Grahamet al.(2005) shows that an overwhelming majority of the respondents prefer income smoothing, academic literature is still divided on the informational versus opportunistic motives for managerial smoothing behavior. We test this conjecture by separating smoothing into its innate and discretionary components and find that managerial ownership-induced discretionary smoothing is positively associated with bid-ask spreads. This positive coefficient implies that such smoothing is perceived by the market participants as accentuating information asymmetry as opposed to attenuating it.
Ownership-induced income
smoothing
227
Our findings provide important insights into the influence of corporate governance and financial reporting practice on the market’s perception of the quality of financial reporting. An absence of information asymmetry between stock traders is considered to be an important mechanism in decreasing the cost of capital and enhancing market efficiency (Glosten and Milgrom, 1985; Lang and Lundholm, 1996; Welker, 1995). Investors and regulators are interested in finding out whether managerial ownership helps attenuate such information asymmetry through financial reporting choices (income smoothing in our case).
The findings of this study should, however, be interpreted in light of some limitations. First, the model for developing INNSMTH may not include all the relevant variables. For example, Franciset al.(2004) include the operating cycle as a determinant of income smoothing. However, we left this variable out because of the unavailability of “cost of goods sold” information for New Zealand companies. Second, we investigate only the effect of income smoothing, and its interactive effect with managerial shareholdings, on bid-ask spread. However, a richer insight could be gained by considering consequential measures other than bid-ask spread, like liquidity and cost of equity capital. The findings of this study should also be interpreted cautiously in light of the relatively small sample size used in this study.
Notes
1. Tucker and Zarowin (2006) address the informational versus garbling effect of smoothing by estimating the future earnings response coefficient (FERC). The FERC measures the extent to which current period stock returns incorporate future earnings, based on the well known proposition that accounting earnings lag stock returns, and this lack of timeliness can be modeled by incorporating future earnings as an independent variable (Collinset al., 1994). Tucker and Zarowin (2006) provide evidence that income smoothing improves the informational value of past and current earnings about future earnings and cash flows after controlling for a number of firm-specific characteristics, like firm size, growth opportunities, and analyst following.
2. Dechowet al.(2010, p. 362) note that, “[...] cross-sectional variation in smoothness can result from variation in the smoothness of fundamental performance [...] from variation in the ability of an accrual-based accounting system absent any choice to capture fundamental performance, or from variation in accounting choice. Moreover, the accounting choice can be motivated either to increase decision usefulness or to distort it. [Researchers need to] differentiat[e] inherent or fundamental inherent or fundamental smoothness from smoothness related to accounting choice, and differentiat[e] informative choices from opportunistic choices...” (italics added).
3. A recent meta-analytic review of the effect of managerial ownership on earnings management by Garcia-Meca and Sanchez-Ballesta (2009), however, failed to document any significant association.
4. Our sample observations have an average (median) top five ownership concentration of 54.17 percent (56 percent), respectively, which lends support to the characterisation of New Zealand as a concentrated ownership country (Hossainet al., 2001).
References
Ahmed, A.S., Lobo, G.J. and Zhou, J. (2006), “Job security and income smoothing: an empirical test of the Fudenberg and Tirole (1995) model”, working paper, Texas A&M University, College Station, TX.
PAR
24,2
228
Ashari, N., Koh, H.C., Tan, S.L. and Wong, W.H. (1994), “Factors affecting income smoothing among listed companies in Singapore”, Accounting and Business Research, Vol. 24, pp. 291-301.
Atik, A. (2009), “Detecting income-smoothing behaviours of Turkish listed companies through empirical; tests using discretionary accounting changes”, Critical Perspectives on Accounting, Vol. 20, pp. 591-613.
Bagehot, W. (1971), “The only game in town”,Financial Analysts Journal, Vol. 27 No. 2, pp. 12-14. Baik, B., Kang, J- K. and Morton, R. (2010), “Why are analysts less likely to follow firms with high managerial ownership?”, Journal of Accounting Auditing & Finance, Vol. 25 No. 2, pp. 171-200.
Bao, B.H. and Bao, D.H. (2004), “Income smoothing, earnings quality and firm valuation”,Journal of Business Finance & Accounting, Vol. 31 Nos 9/10, pp. 1525-57.
Beck, N. and Katz, J.N. (1995), “What to do (and not to do) with time-series-cross-section data in comparative politics”,American Political Science Review, Vol. 89, pp. 634-47.
Berkman, H. (1992), “The market spread, limit orders, and options”,Journal of Financial Services Research, Vol. 6, pp. 399-416.
Bhattacharya, U., Daouk, H. and Welker, M. (2003), “The world price of earnings opacity”,The Accounting Review, Vol. 78 No. 3, pp. 641-78.
Biedleman, C. (1973), “Income smoothing: the role of management”,The Accounting Review, Vol. 48 No. 4, pp. 653-67.
Branch, B. and Freed, W. (1977), “Bid ask spreads on the Amex and the Big Board”,Journal of Finance, Vol. 32 No. 1, p. 159.
Carlson, S.J. and Bathala, C.T. (1997), “Ownership differences and firms’ income smoothing behavior”,Journal of Business Finance & Accounting, Vol. 24 No. 2, pp. 179-96.
Chaney, P.K. and Lewis, C.M. (1995), “Earnings management and firm valuation under asymmetric information”,Journal of Corporate Finance, Vol. 1 Nos 3/4, pp. 319-45. Chordia, T., Roll, R. and Subrahmanyam, A. (2001), “Market liquidity and trading activity”,
Journal of Finance, Vol. 56, pp. 501-30.
Collins, D.W., Kothari, S.P., Shanken, J. and Sloan, R. (1994), “Lack of timeliness and noise as explanation for the low contemporaneous returns-earnings association”, Journal of Accounting and Economics, Vol. 18 No. 3, pp. 289-324.
Copeland, T.E. and Galai, D. (1983), “Information effects on the bid-ask spread”,Journal of Finance, Vol. 38 No. 5, pp. 1457-69.
Dechow, P., Ge, W. and Schrand, C. (2010), “Understanding earnings quality: a review of the proxies, their determinants and their consequences”, Journal of Accounting and Economics, Vol. 50, pp. 344-401.
DeFond, M.L. and Park, C.W. (1997), “Smoothing income in anticipation of future earnings”, Journal of Accounting and Economics, Vol. 23, pp. 115-39.
Demsetz, H. (1968), “The cost of transacting”,Quarterly Journal of Economics, Vol. 87, pp. 33-53. Dou, Y., Hope, O.K. and Thomas, W.B. (2010), “Relationship-specificity, contract enforceability, and income smoothing: an international study”, working paper, University of Toronto, Toronto.
Dye, R.A. (1988), “Earnings management in an overlapping generations model”, Journal of Accounting Research, Vol. 26 No. 2, pp. 195-235.
Fabozzi, F. (1979), “Bid-ask spreads for over-the-counter stocks”,Journal of Economics and Business, Vol. 32 No. 1, pp. 56-65.
Ownership-induced income
smoothing
229
Fan, J. and Wong, T.J. (2002), “Corporate ownership structure and the informativeness of accounting earnings in East Asia”, Journal of Accounting and Economics, Vol. 33, pp. 401-25.
Francis, J., LaFond, R., Olsson, P. and Schipper, K. (2004), “Costs of equity and earnings attributes”,The Accounting Review, Vol. 79 No. 4, pp. 967-1010.
Fudenberg, D. and Tirole, J. (1995), “A theory of income and dividend smoothing based on incumbency rents”,Journal of Political Economy, Vol. 103 No. 1, pp. 75-93.
Garcia-Meca, E. and Sanchez-Ballesta, J.P. (2009), “Corporate governance and earnings management: a meta analysis”,Corporate Governance: An International Review, Vol. 17 No. 5, pp. 594-610.
Glosten, L. and Milgrom, P.R. (1985), “Bid, ask and transaction prices in a specialist market with heterogeneously informed traders”,Journal of Financial Economics, Vol. 14, pp. 71-100. Goel, M.A. and Thakor, A. (2003), “Why do firms smooth earnings?”,Journal of Business, Vol. 76
No. 1, pp. 151-93.
Gordon, M. (1964), “Postulates, principles and research in accounting”,The Accounting Review, Vol. 39, pp. 251-63.
Graham, J.R., Harvey, C.R. and Rajgopal, S. (2005), “The economic implications of corporate financial reporting”,Journal of Accounting and Economics, Vol. 40 Nos 1-3, pp. 3-73. Habib, A. (2005), “Firm-specific determinants of income smoothing in Bangladesh: an empirical
evaluation”,Advances in International Accounting, Vol. 18, pp. 53-72.
Hamilton, J. (1978), “Marketplace organization and marketability: NASDAQ, the stock exchange, and the national market system”,Journal of Finance, Vol. 33 No. 2, pp. 487-503. Healy, P. (1985), “The impact of bonus schemes on the selection of accounting principles”,Journal
of Accounting and Economics, Vol. 7 Nos 1-3, pp. 85-107.
Heflin, F. and Shaw, K.W. (2000), “Blockholder ownership and market liquidity”, Journal of Financial and Quantitative Analysis, Vol. 35, pp. 621-33.
Hossain, M., Prevost, A.K. and Rao, R.P. (2001), “Corporate governance in New Zealand: the effect of the 1993 Companies Act on the relation between board composition and firm performance”,Pacific-Basin Finance Journal, Vol. 9 No. 2, pp. 119-45.
Huang, P., Zhang, Y., Deis, D.R. and Moffitt, J.S. (2009), “Do artificial income smoothing and real income smoothing contribute to firm value equivalently?”,Journal of Banking & Finance, Vol. 33 No. 2, pp. 224-33.
Jennings, W., Schnatterly, K. and Seguin, P. (2002), “Institutional ownership, information and liquidity”,Advances in Financial Economics, Vol. 7, pp. 41-71.
Jensen, M.C. and Meckling, W.H. (1976), “Theory of the firm, managerial behavior, agency costs, and ownership structure”,Journal of Financial Economics, Vol. 3 No. 4, pp. 305-60. Kamin, J.Y. and Ronen, J. (1978), “The smoothing of income numbers: some empirical evidence on
systematic differences among management-controlled and owner-controlled firms”, Accounting Organizations and Society, Vol. 3 No. 2, pp. 141-57.
Kirschenheiter, M. and Melumad, N. (2002), “Can ‘Big Bath’ and earnings smoothing coexist as equilibrium financial reporting strategies?”,Journal of Accounting Research, Vol. 40 No. 3, pp. 761-96.
LaFond, R., Lang, M. and Skaife, H.A. (2011), “Earnings smoothing, governance and liquidity: international evidence”, working paper, Massachusetts Institute of Technology, Cambridge, MA.
PAR
24,2
230
Lang, M. and Lundholm, R. (1996), “Corporate disclosure policy and analyst behavior”,The Accounting Review, Vol. 71, pp. 467-93.
Leuz, C., Nanda, D. and Wysocki, P.D. (2003), “Earnings management and investor protection: an international comparison”,Journal of Financial Economics, Vol. 69 No. 3, pp. 505-27.
McInnis, J. (2010), “Earnings smoothness, average returns, and implied cost of equity capital”, The Accounting Review, Vol. 85 No. 1, pp. 315-41.
Michelson, S.E., Jordan-Wagner, J. and Wootton, C.W. (1995), “A market-based analysis of income smoothing”,Journal of Business Finance & Accounting, Vol. 22 No. 8, pp. 1179-93.
Michelson, S.E., Jordan-Wagner, J. and Wootton, C.W. (2000), “The relationship between the smoothing of reported income and risk-adjusted returns”, Journal of Economics and Finance, Vol. 24 No. 2, pp. 141-59.
Morck, R., Shleifer, A. and Vishny, R. (1988), “Management ownership and market valuation: an empirical analysis”,Journal of Financial Economics, Vol. 20, pp. 293-315.
Moses, O.D. (1987), “Income smoothing and incentives: empirical test using accounting changes”, The Accounting Review, Vol. 62 No. 2, pp. 358-77.
Raman, K. and Shahrur, H. (2008), “Relationship-specific investments and earnings management: evidence on corporate suppliers and customers”,The Accounting Review, Vol. 83 No. 4, pp. 1041-81.
Ronen, J. and Sadan, S. (1981),Smoothing Income Numbers: Objectives, Means, and Implications, Addison Wesley, Boston, MA.
Rubin, A. (2007), “Ownership level, ownership concentration, and liquidity”,Journal of Financial Markets, Vol. 10, pp. 219-48.
Sankar, M.R. and Subramanyam, K.R. (2001), “Reporting discretion and private information communication through earnings”,Journal of Accounting Research, Vol. 39, pp. 365-86. Stoll, H. (1978), “The supply of dealer services in securities markets”,The Journal of Finance,
Vol. 33, pp. 1133-51.
Stoll, H. (1989), “Inferring the components of the bid-ask spread: theory and empirical tests”, Journal of Finance, Vol. 44 No. 1, pp. 115-34.
Tinaikar, S. and Xue, X. (2011), “Product market competition and earnings management: some international evidence”, working paper, University of Florida, Gainesville, FL.
Trueman, B. and Titman, S. (1988), “An explanation of accounting income smoothing”,Journal of Accounting Research, Vol. 26, pp. 127-39 (supplement).
Tucker, J.F. and Zarowin, P. (2006), “Does income smoothing improve earnings informativeness?”,The Accounting Review, Vol. 81 No. 1, pp. 251-70.
Utama, S. and Cready, W.M. (1997), “Institutional ownership, differential predisclosure precision and trading volume at announcement dates”,Journal of Accounting and Economics, Vol. 24 No. 2, pp. 129-50.
Wang, Z. and Williams, T. (1994), “Accounting income smoothing and stockholder wealth”, Journal of Applied Business Research, Vol. 10 No. 3, pp. 96-104.
Warfield, T.D., Wild, J.J. and Wild, K.L. (1995), “Managerial ownership, accounting choices, and informativeness of earnings”,Journal of Accounting and Economics, Vol. 20, pp. 61-91.
Welker, M. (1995), “Disclosure policy, information asymmetry, and liquidity in equity markets”, Contemporary Accounting Research, Vol. 11 No. 2, pp. 801-27.
Ownership-induced income
smoothing
231
Further reading
Ball, R., Kothari, S.P. and Robin, A. (2000), “The effect of international institutional factors on properties of accounting earnings”,Journal of Accounting and Economics, Vol. 29, pp. 1-51.
Short, H. and Keasey, K. (1999), “Managerial ownership and the performance of firms: evidence from the UK”,Journal of Corporate Finance, Vol. 5, pp. 79-101.
Corresponding author
Ahsan Habib can be contacted at: [email protected]
To purchase reprints of this article please e-mail:[email protected] Or visit our web site for further details:www.emeraldinsight.com/reprints
PAR
24,2
232
This article has been cited by:
1. Jing Chi, Jingjing Yang, Martin Young. 2014. Mutual funds’ holdings and listed firms’ earnings management: Evidence from China. Journal of Multinational Financial Management 28, 62-78. [CrossRef]