ANALYSIS OF PUBLIC TRANSPORT RATES BASED ON VEHICLE
OPERATIONAL COSTS AND CONSUMER WILLINGNESS TO PAY (WTP)
Ratna Purwaningsih¹, Handy Nugroho²
1 Industrial engineering Department, Diponegoro University, Semarang
ABSTRACT
Determination of public transport fares require the right policy to bridge the interests of passengers as consumers and employers as providers of public transport services. Many factors affect the transport tariffs, such as public purchasing power, the cost of maintenance, spare parts price, fuel prices, facilities and infrastructure, etc. This study aim to define a long-distance bus fares based on vehicle operational costs and willingness to pay of consumers by taking a case study on Solo - Jabodetabek bus route for executive class.
The method for determining the operational costs of transport services is to determine the vehicle operational cost (VOC) value which consist of direct costs and indirect costs of transportation services. The ability of passengers to pay measured by the method WTP (willingness to pay). These two indicators became a trade-off to determine the tariff by considering a targeted rate of profit by a transportation services company. The results showed that the VOC value and the WTP value did not have much difference. Then, profits cannot be targeted too large. The values obtained using Load factor of 75 % of the number of bus seats. The study also perform simulations to determine the revenue of transportation services at different levels of load factor to determine the breakeven point per vehicle per trip. Results of the research is expected to provide an overview for the company in determining the ticket fare per passenger.
Keywords: public transport tariff, Vehicle operational cost, willingness to pay, load factor simulation
1. INTRODUCTION
Public transportation services long distance buses have an important role in improving public transport. The bus company trying to attract customers by providing a good service and travel safety to get more users. Bus rates bus tariff determination requires appropriate policies to bridge the interests of passengers as consumers and public transport operators as service providers. Lack of purchasing power and the willingness to pay of the community is often the reason for the delay and even the cancellation of the tariff changes. Basically rates declared by the government to guarantee the urban public transport service quality and safety standards on appropriate level.
Many factors are considering while tariffs determination process such as macro-economic conditions, maintenance costs, the price of spare parts, fuel prices, infrastructure condition and so on. Changes in fuel prices give immediate changes to the cost structure of transportation services. Such changes have an impact on the largest component of the price increases Vehicle Operational Costs (VOC). The purpose of this study are (1) define a percentage ranked or a cost structure of vehicle operational cost, (2) define executive class bus rates based on vehicle operational costs (VOC), (3) define the executive class rates based WTP of passenger.
2. LITERATURE REVIEW
Morlok [1] stated that the management of transport businesses face a very wide choice in terms of pricing and operating plans, although often the choice is restricted by government regulations. Some options are operating on the fixed route or not, operation fixed scheduling or not depend on vehicles operated capacity, types of traffic to be served (especially in transport and unloading of goods ) , and the price or tariff will be draged. Vehicle operational costs is the total cost incurred by road users by using specific transport modes from the zone of origin to destination zone. Vehicle operational costs consist of two components, namely the fixed costs and variable costs. Fixed costs are costs that do not vary with changes in the volume production of services to a certain extent, while the variable costs are costs that change when there is a change in the volume of production services.
2.1 Vehicle Operasional Cost (VOC)
VOC consist of direct cost and indirect cost. Direct costs are costs directly related to the production process of a product or service, which consists of a fixed cost and variable costs. Most of these direct costs can be directly calculated per km vehicle, but most of the cost of longer counted as cost per year [4].
Indirect costs are costs that are not directly related to the products or services produced and also consists of fixed cost and variable cost. Indirect costs consist of the cost components that are not directly related to the operation of the vehicle such as the total cost per year employee in addition to the crew of the vehicle and the cost of managing such as corporate tax, vehicle tax, depreciation of office buildings, etc. Direct costs and indirect costs form the basic costs per vehicle, it can also be divided per kilometer.
The bus cost on VOC also influenced by load factor. Load factor is the ratio between the capacity sold and the capacity available for the trip stated in percentage. According to the decision of the Director General of Land Transportation the load factor for the calculation of general tariff is 70 %. The total cost calculated as VOC Then divided by The number of passenger to gaet the cost per passenger.
Rates are fees paid by users of public transport per unit weight or per passenger per km. determination of the tariff is intended to encourage the use of infrastructure and means of transport which takes into account the density of traffic optimum concerned [5].
2.2. Consumer Willingness To Pay (WTP)
WTP is people's purchasing Power. WTP is the willingness of a person to pay rates to issue a sacrifice for services obtained [6]. Willingness to pay defines as the willingness of users to issue a reward for services obtained. The approach used in the analysis of WTP for public transport based on the user's perception of the tariff of the service. In the field of transport WTP is influenced by several factors, including (1) the public transportation services production and supply by companies, (2) quality and quantity of transport services, (3) the utility of public transport, (4) user income [7].
3. RESEARCH METHODOLOGY
Data and information were obtained by the method dap interviews, questionnaires and historical data of the company. The data obtained and analyzed by using the method of calculation of the BOK to obtain the appropriate tariff for bus Rosalia Indah executive class. Meanwhile, to describe the real conditions BOK value is based on the number of seats. To measure people's willingness to pay for services used method willingness
to pay, particularly to determine how much consumers are willing to add payment for improving the quality of services. WTP values in the can through questionnaires given to the consumer.
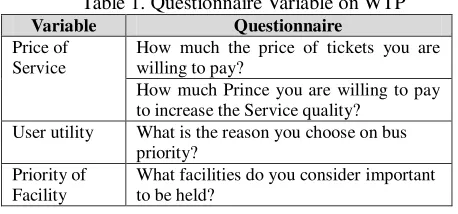
According to Sugiyono [8], the population is a generalization region consisting of the object / subject has a certain quantity and characteristics defined by the researchers to be studied and then drawn conclusions. The sampel for questionaire is 75 person bus passenger. The variabel and the question for passenger are given on Table 1. After processing the data, analysis should be done to obtain some value such as:
1. Define percentage rank of the cost component that most contribute to the operational cost.
2. Define the tariff of executive class bus ticket that was obtained from the calculation of the VOC. 3. Provide comparative operational costs based on the
number of bus seats.
4. Compares and simulate the operational costs based on the number of seats and different load factor scenario.
5. Analyze the willingness to be pay of passengers and the amount cost passenger want to be added in order to increase or maintain the service facilities.
Table 1. Questionnaire Variable on WTP
Variable Questionnaire
User utility What is the reason you choose on bus priority?
Priority of Facility
What facilities do you consider important to be held?
4. RESULT AND DISCUSSION
First step of the study is to define the percentage rank of the cost component that most contribute to the operational cost. Bus transportation rates prevailing on this study was Rp.195.000/ passenger. Table 2 show some data and assumption to be input while calculated the VOC. Bus transportation rates prevailing on this study was Rp.195.000/ passenger.
Table 2. Input data and assumption for VOC calculation
No Specification Condition
9 Day Works/year 300 days 10 Total Distance/month 14.275 km 11 Total Distance/year 171.300 km 12 Passenger rate 25 person 13 Passenger/month 630 14 Passenger/year 7560
4.1. Transportation Cost Structure Analysis
The cost component per passenger is Vehicle operasional cost component divided by the number of passenger. Number of passenger based on 70 % multiply by number of maksimum seats available. The cost component per passenger is given on Table. Rank analysis on cost componenet of VOC describe briefly on Table 4.
The most influential cost of bus operational costs is the cost of fuel. It have a percentage of 35.63 %. Therefore, every time the government increased fuel prices, especially diesel, the price of a bus ticket will increase [9]. For example, when the price of diesel was Rp.5.500, ticket price was Rp.175.000 for executive class. When the price of diesel fuel increase on Rp 7,250, then the ticket price became Rp.195.000 or increased Rp 20,000.
Table 3. Cost Component/passenger 6 Tire replacement 17.714
7 Spare part 1.852
8 Vehicle depreciation 27.407 9 Wage and salary of bus crew 20.833
Salary of administrative worker 6.794 2 Management cost 9.980 Total indirect cost 16.774
Total cost 163.595
Profit targeted (10 %) 16.360
Tariff defined 179.955
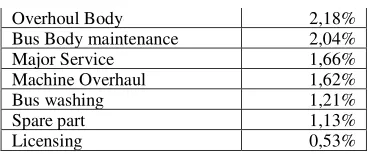
Table 4. Percentage of Cost Component
Cost component Percentage Salary of administratif worker 4,16% Safety Service 3,40%
The second cost component contribute to VOC is the cost of depreciation (16.76%). Depreciation fleet annually by Rp.207, 2 million at a price of one new bus for Rp.1.295 million and the residual value of the bus is Rp.295 million for five years of life time. The third influential costs further is the bus crew salaries and allowance. These costs include salaries for 2 drivers (Rp.2 million/ person/month), a bus conductor (Rp.1 million /month), and an allowance for 2 drivers for Rp.125.000 per person and a bus conductor 75,000 for each one-way trip. Total contribution for the cost is amount of 12.74 %.
Tire replacement costs on fourth position on its contribution to VOC value. It have a percentage of 10.83 %. Tire life time’s depends on the condition of the road. Tire condition also affects the comfort and safety of passengers. Maintenance cost on fifth place, it gives contribution on 6.10% of VOC in the form of maintenance office, garage, pool, and more. Seventh costs are personnel costs in addition to the bus crew, the percentage amounted to 4.16 %. The average employee salary of Rp 1.126.000 /month.
Then, vehicle services cost has a percentage of 3.40% i.e. for routine checks in Bitung, Jabodetabek and Palur polo. The actual cost per service items are not all the same, depending on the reports of the crew buses that operate whether the bus was damaged while traveling or not. The next charge is to overhaul the body that is equal to 2.18%. Overhaul costs in the body can be of 9 % of the price of the bus. Body maintenance costs have a percentage of 2.04%. This fee can be from 0.5 % of the price of car body.
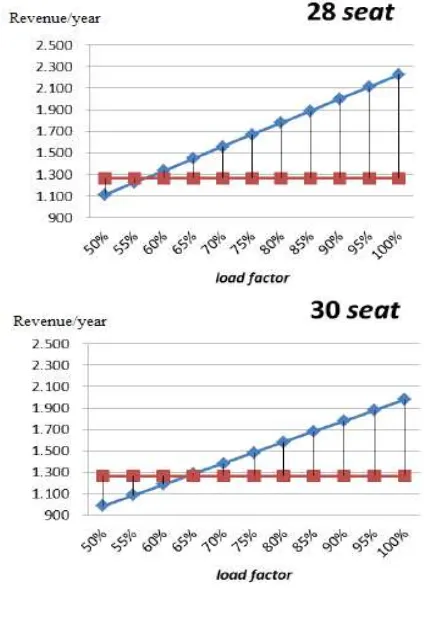
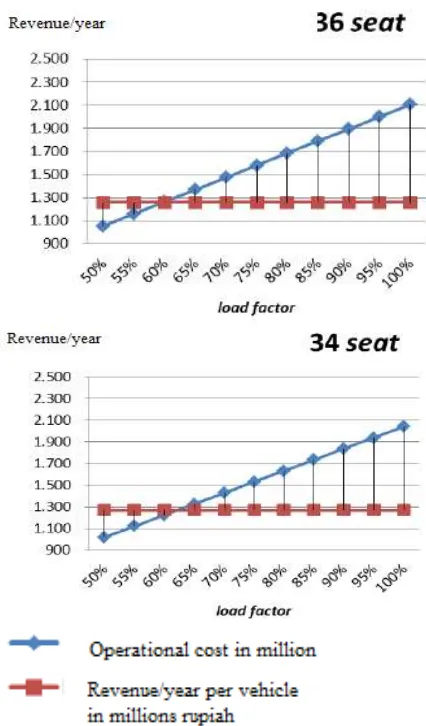
4.2. Revenue Simulation
Comparisons between the cost for different seats capacity of bus 28 seats, 30 seats, 34 seats and 36 seats describe on Table 5. Revenue define is number of passenger according to load factor skenario multiply by the tiket price. Graphic for bus revenue simulation is given on figure 1.
The operational costs for bus which has 28 seats is Rp 1,264 billion. This bus reach its BEP when the number of passengers in a year are on load factor of 57 % or an average of 16 passengers. Also, the operational costs for these buses with 30 seats is Rp 1,266 billion. The company experienced BEP when the number of passengers in a year an average of 65 % of the total maximum capacity or about 20 passengers for each trip.
Table 5. Operational Cost on Different Seat Capacity
No VOC component
36 Seats
34 Seats
30 Seats
28 Seats Fixed Cost/Intial Investment
1 Vehicle price 259 263,8 262,6 261,4 2 Depreciation 207,2 211,0 210,1 209,1 3 Admint cost 6,565 6,565 6,565 6,565
4 Crew salary 6 6 6 6
Total fixed cost 478,76 487,4 485,2 483,1 Variable cost
1 Fuel 440,4 440,4 440,4 440,4 2 Tyre 88,6 88,6 88,6 88,6 3 Minor service 23,5 23,5 23,5 23,5 4 Major service 10 10 10 10 Total variable
cost
562,5 562,5 562,5 562,5 Fix + Variable 1041 1050 1047 1045 Overhead cost
(15 %)
156,19 157,5 157,1 156,8
Total Cost 1197 1207 1205 1202
Then, for buses which have capacity 34 seats, the operational costs is Rp 1,269 billion. The company reach its BEP on number of passengers in a year when load factor is between 60 % and 65 %, or about 21 passengers. Bus with 36 seat has operational costs Rp 1,259 billions. The company reach its BEP when the number of passengers is 60 % of the total maximum capacity, or about 22 passengers each trip.
4.3. Result of Consumer Willingness to Pay
Respondents for WTP survey is 70 persons of executive class bus passenger. Respondent consist of 75.7 % mans or 53 person and 24.3 % women or about 17 persons. Age of respondents most frequently is around 15-25 years (42 person in this age range). The bus passenger consist of 46 % Company employer and 34 % university students. Other passenger are entrepreneur and government employee.
52.9 % of respondents have income per month around 2-3 million. Respondents which has income under 2
million/month is 38.6 %. Then, respondents who have an income of 3-4 million per month is 2.9 %, and only 5.7 % of respondents which have income above 5 million per month.
Figure 1. Graphic of revenue simulation
The amount of the maximum WTP is willing to pay passengers believed to be related to the frequency of journeys undertaken and the level of passenger income. The Cross Tab analysis test showed that passengers with different trip frequency is not enough to give a different value to the maximum WTP is selected. Similarly with income levels also did not give results that indicate a maximum WTP options at various levels of passenger income. The maksimum WTP value chosen by passenger gives on Table 6.
Table 6. Maximum WTP
Frequency Percent
Valid Percent
Cumulative Percent
Valid 185000 7 10.0 10.0 10.0 190000 7 10.0 10.0 20.0 195000 10 14.3 14.3 34.3 200000 27 38.6 38.6 72.9 205000 16 22.9 22.9 95.7
210000 3 4.3 4.3 100.0 Total 70 100.0 100.0
Table 6 shows that the highest value for WTP maximum of 27 % passenger is Rp 200,000, then WTP maximum with a value of Rp 205,000 chosen by 16 % of passenger. For maximum WTP Rp 195,000 have chosen by 10 % of passenger and maximum WTP values Rp 190.000 and Rp 185.000 chosen by of 7 % of passenger. While the maximum WTP fatherly Rp.210.000 has a percentage of 3 % of passenger.
5. CONCLUSION
Cost structure analysis of long distance bus executive class shows that the Vehicle operational cost dominated by 35,63% del cost, 16,76% cost of Depreciation, 12,74% for bus crew salary, 10,83% for tyres replacement, 6,10% for Management cost.
Cost calculation shows that Vehicle operational cost for one bus per year is 1, 23 billion. Bus rates or tariff analysis gives the value of Rp 179.850 per passenger per trip for route Solo – Jabodetabek (about 571 km). This value consist of operational cost per passenger Rp.163.500 and 10 % profit targeted by bus Transport Company.
Questioner willingness to pay result on bus rate Rp. 190.571, the value is Rp. 4.429 lower than existing bus rates. The bus rates is Rp.195.000.
Break event point analysis for bus which has 28 seat will reached at load factor 57 % of maximum capacity. Bus which has 30 seats need 65 % load factor to get its BEP. Then bus with 34 seats Wills reach its BEP on 65 % load factor. Bus which has 36 seats will reach BEP at 60 % load factor.
REFERENCES
[1] Morlok, Edward K., Pengantar Teknik dan Perencanaan Transportasi, (Introduction to Transportation Planning Technique), Erlangga, Jakarta, 1988
[2] Director General of Land Transportation Republic of Indonesia Decree No SK.687 / AJ.206 / DRDJ / 2002
[3] Button, K., Transport Economics, Second edition, Edward elgar (Aldershot), 1993
[4] Departemen Pekerja Umum ((Department of Public Workers Republic Indonesia), Pedoman Konstruksi dan Bangunan tentang perhitungan Biaya Operasional Kendaraan Bagian 1. Biaya Tidak Tetap (Construction and Building Code concerning the calculation of Operating Costs Vehicle Part 1. Cost Variable) (Running Cost), Pd T-15-2005-B. 2005
(Transportation system planning), Penerbit ITB, Bandung , 1990
[6] Sontikasyah, Elyis. Analisis Kesediaan Membayar Pengguna Jasa Bus Trans Pakuan Kota Bogor (Willingness To Pay) dengan Metode Valuasi Kontingensi (Willingness to Pay analysis User Services Bus Trans Pakuan Bogor, the Contingency Valuation Method), Thesis,
Universitas Indonesia, 2010.
[7] Tamin, O.Z., Kusumawati, A., Rahman, H., Munandar, A.S., and Setiadji, B.H. Studi Evaluasi Tarif Angkutan Umum dan Analisis Ability to Pay (ATP) dan Willingness to Pay (WTP) di DKI-Jakarta (Public Transport Rates Evaluation Study and Analysis of Ability to Pay ( ATP ) and Willingness to Pay ( WTP ) in DKI – Jakarta), Jurnal Transportasi, Forum Studi
Transportasi antar Perguruan Tinggi (FSTPT), Vol 1, No 2, Desember 1999, hal 121-135, ISSN: 1411-2442. 1999.
[8] Sugiyono, Pengertian populasi ( Define the population), Alfabeta, Bandung, 2009