*Corresponding author.
1944-3994 / 1944-3986 © 2017 Desalination Publications. All rights reserved.
www.deswater.com
doi:10.5004/dwt.2017.20969
July
Removal of Cu(II) and Pb(II) from wastewater using biochar-clay nanocomposite
Felycia Edi Soetaredjo
a,*, Yi-Hsu Ju
b, Suryadi Ismadji
a, Aning Ayucitra
aaDepartment of Chemical Engineering, Widya Mandala Surabaya Catholic University, Kalijudan 37 Surabaya 60114, Indonesia, Tel. +62 31 3891264, Fax +62 31 3891267, email: [email protected]
bDepartment of Chemical Engineering, National Taiwan University of Science and Technology, 43, Sec. 4 Keelung Rd., Taipei 10607, Taiwan
Received 2 February 2017; Accepted 24 May 2017
A B S T R A C T
The new nanocomposite material has been synthesized from inexpensive and abundantly available materials. Bentonite and water hyacinth were used as the precursors for the preparation of bentonite – biochar nanocomposite. The nanocomposite was produced at 400°C under a combination of nitro-gen and carbon dioxide environment. The adsorption capability of the nanocomposite was tested for the removal of Cu(II) and Pb(II) from aqueous solution. Temperature dependent forms of Langmuir and Freundlich equations were employed to correlate the experimental data. Based on the physical meaning assessment of the parameters, the Langmuir equation with its temperature dependent form can correlate the experimental data better than Freundlich. The maximum adsorption capacity for nanocomposite toward Cu(II) and Pb(II) are 78.1 mg/g and 44.7 mg/g, respectively. The adsorption kinetic data of Cu(II) and Pb(II) onto bentonite and nanocomposite follow pseudo-first-order equa-tion, with k1 strongly dependent on temperature. The thermodynamic study reveals that the adsorp-tion Cu(II) and Pb(II) was controlled by physical adsorpadsorp-tion and spontaneous.
Keywords: Nanocomposite; Biochar; Bentonite; Adsorption isotherm; Adsorption kinetic
1. Introduction
Heavy metals are one of the most hazardous contam-inants found in the polluted waterways. The primary sources of these pollutants are from electroplating indus-tries, mining, metal indusindus-tries, leather tanning, textile and dyeing, fertilizers, etc. The contamination of water by heavy metals is a severe problem and need urgent attention because heavy metals are considered as highly life-threat-ening substances toward living organisms. Heavy metals enter the human body via several routes such as inges-tion, skin absorpinges-tion, and inhalation. Several severe effects caused by heavy metals are reduced mental and central nervous function, damage to vital organs, change in human metabolisms, damage to blood composition, and other seri-ous diseases.
Currently, several separation methods are available for the treatment of industrial effluents containing heavy
metals. Several examples of these conventional methods are chemical precipitation, coagulation, electrodialysis, ion exchange, ultrafiltration, etc. These technologies have their advantages and disadvantages, and industrial applications of these techniques in under developing or developing countries often create other problems such as unsustainable, high operational cost, generation of toxic waste sludge, etc.
The utilization of bentonites and its modified forms for the removal of various hazardous pollutants has been explored by our research group [5–11] and the results indi-cate that these material have very potential application for industrial wastewater treatment application. The main problems of using natural bentonites and its chemically modified forms are low adsorption capacity and create another problem to the environment due to the excess of the chemical as modifying agents.
Recent studies indicate that combination of bentonite with other natural materials produced composites, which have high adsorption capacity [12–14]. A combination between bentonite and biochar from water hyacinth to new nanocomposite is presented in this paper. The composite materials called as nanocomposites if the fillers have one dimension in nanoscale (clay minerals), two-dimension in nanoscale (carbon nanotubes, nanofibers, nanowires, etc.), or three dimension in nanoscale (silica nanoparticles, etc.) [15]. This new nanocomposite over several advantages for hazardous substances removal since this material is low-cost and possesses excellent adsorption capability. This new nanocomposite material can be used as the low-cost alter-native adsorbent for the treatment of water or wastewater containing heavy metals.
2. Materials and methods
2.1. Materials
Bentonite used in this study was obtained from benton-ite mining in Pacitan, East Java province, Indonesia. The initial moisture content of the bentonite was around 52%. Before using the bentonite was purified using hydrogen peroxide solution to remove the organic impurities. After the purification process had completed, the bentonite was repeatedly washed with reverse osmosis water to remove excess hydrogen peroxide solution, and subsequently dried in a forced circulation oven at 110°C until its moisture con-tent around 10%. The bentonite was pulverized in a Janke & Kunkel hammer mill until its particle sizes around 180/200 mesh. The powder bentonite was stored in adesiccat or for further use.
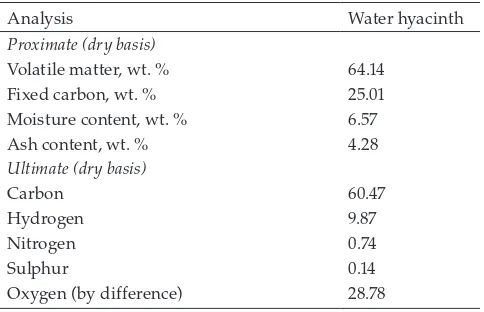
Water hyacinth utilized in this study was obtained from swamp area around Surabaya. Prior to use, the water hya-cinth was repeatedly washed using tap water to remove the impurities such as sands, dirt, etc. Clean water hyacinth was dried in a forced circulation oven at 110°C until its moisture content was around 10%. Dry water hyacinth was pulverized in Janke & Kunkel hammer mill until its particle sizes around 180/200 mesh. Subsequently, the water hya-cinth powder was stored in sealed plastic bags for further used. The proximate analysis of water hyacinth powder was carried out according to the method of ASTM E870-82. Perkin-Elmer 2400 CHNS/O Elemental Analyzer was used for the determination of elemental carbon, hydrogen, nitro-gen, oxynitro-gen, and sulfur in water hyacinth. Proximate and ultimate analyses of water hyacinth are given in Table 1.
All the chemicals used in this study such as hydrogen peroxide, CuSO4, PbCl2, etc. were purchased as an analytical grade from Sigma-Aldrich Singapore and used without any further treatment or purification processes. Carbon dioxide, which was used as the activating agent for bentonite –
bio-char composite activation, was purchased from Aneka Gas and obtained as an industrial grade. Nitrogen gas that was used to maintain the system at the inert condition was also obtained as an industrial grade from Aneka Gas.
2.2. Cation exchange capacity measurement and surface charge The cation exchange capacity (CEC) of the bentonite was measured using methylene blue index. In general, two different mechanisms occur during the dye adsorption on the bentonite. The first mechanism is the cation exchange between methylene blue cations and exchangeable cations from isomorphous substitution in the aluminosilicate lat-tice. The second mechanism is the adsorption mechanism, which might be either chemisorption (hydrogen bonding) with the surface SiOH and AlOH of the aluminosilicate lat-tice or physical (Van der Waals) adsorption. The exchange reaction between methylene blue cations and metal cations from the aluminosilicate lattice is an irreversible reaction.
When methylene blue solution is added in a small amount at a time to the bentonite sample until the cation exchange capacity of the bentonite is reached, the amount of methylene blue adsorbed is equal to the amount of methylene blue added, and the cation exchange capacity of the bentonite sample can be calculated by the following equation:
CEC
mb V N
mb mb
=100 . (1)
where CEC is cation exchange capacity (meq/100 g benton-ite), mb is the weight of bentonite (g), Vmb is the volume of methylene blue added (ml), and Nmb is normality of meth-ylene blue solution (meq/ml). The surface charge of ben-tonite and nanocomposite were determined using a zeta potential analyzer (Brookhaven 90Plus).
2.3. Nanocomposite preparation
The following procedure was used to prepare bentonite – biochar nanocomposite. Fifty gram of bentonite powder was added into 1 L of reverse osmosis water. The bentonite Table 1
Proximate and ultimate analysis of water hyacinth
Analysis Water hyacinth
Proximate (dry basis)
Volatile matter, wt. % 64.14
Fixed carbon, wt. % 25.01
Moisture content, wt. % 6.57
Ash content, wt. % 4.28
Ultimate (dry basis)
Carbon 60.47
Hydrogen 9.87
Nitrogen 0.74
Sulphur 0.14
and water mixture was then sonicated until stable benton-ite suspension was obtained. Subsequently, 25 g of water hyacinth powder was added into the suspension, and the mixture was further sonicated for 120 min. The solid was then separated from the liquid by centrifugation and dried at 110°C for 24 h.
The solid mixture of bentonite and water hyacinth was thermally treated at 400°C under a combination of nitro-gen and carbon dioxide flow. The thermal treatment was conducted in a tubular furnace (Thermolyne F21130-26). The heat treatment of the solid mixture was performed at a heating rate of 10°C. During the heating process of the solid mixture to 400°C, the system was under nitrogen envi-ronment by flowing nitrogen gas at a flow rate of 3 L/min. After the temperature had reached 400°C, the temperature of the furnace was maintained at constant temperature for 60 min. During the thermal treatment at 400°C, in the first 45 min, the system still under a nitrogen environment, and for the rest 15 min, the system was under carbon dioxide environment by switching the nitrogen flow to the carbon dioxide flow. The flow rate of carbon dioxide was 3 L/min. After the thermal process had completed, the resulting solid composite was cooled to room temperature under nitrogen flow condition. The bentonite – biochar nano-composite was subsequently ground until its particle size 100/120 mesh. The composite was stored in the drying chamber for the subsequent experiment.
2.4. Characterization of bentonite and composite
The bentonite and nanocomposite were characterized by nitrogen sorption analysis, X-ray diffraction (XRD), Fourier transform infrared (FTIR), and scanning electron micros-copy (SEM). The nitrogen sorption analysis was conducted on an automated Micromeritics ASAP 2010. The adsorption and desorption data were collected at the boiling point of nitrogen gas (–196°C). Before the sorption measurement, the samples were degassed at 200°C for 48 h at a high vacuum condition to remove water molecules from the structure of the samples. The relative pressures used for sorption mea-surements were 0.0001 to 0.995. The standard BET equation was used to calculate the BET surface area of the samples. The BET surface area calculation was conducted at a relative pressure between 0.05–0.25. The total pore volume of the samples was measured at a relative pressure of 0.995. At this highest relative pressure, all of the pores in the samples were filled with nitrogen gas. The pore size distributions of the samples were determined by the DFT (density functional theory) method using medium regularization.
Philips X’pert X-ray diffractometer was used to obtain the XRD patterns of bentonite and composite. The X-ray diffraction measurements were conducted at 40 kV and 30 mA, and Ni-filtered Cu Kα1 was used as the radiation source. The scanning rate of the diffraction was 1°/min. The qualitative analysis of surface functional groups of the solid samples was conducted in FTIR SHIMADZU 8400S. The potassium bromide (KBr) procedure was used to prepare the solid samples. The FTIR spectra were collected at wave number range of 400–4000 cm–1. Surface morphology of the solids was examined using scanning electron microscopy technique. SEM images of the samples were obtained by JEOL JSM-6500F. SEM analysis was operated at an
acceler-ating voltage of 15 kV. Before the analysis, the solid samples were coated with a ultra-thin layer of conductive platinum.
2.5. Adsorption equilibrium study
The adsorption of Cu(II) and Pb(II) from aqueous solu-tion onto bentonite and nanocomposite were conducted in a static mode at several temperatures (30°C, 40°C and 50°C). A brief description of the adsorption experiments are as follow: a known amount of adsorbents (0.1–1.0 g) were introduced to a series of 250 mL Erlenmeyer flask containing 100 mL of heavy metal solution with an initial concentration of 200 mg/L. Erlenmeyer flasks were placed in thermo-controller shaking water bath (Memmert type WB-14). During the adsorption process, the system was shaken at 200 RPM and the temperature was controlled at the desired temperature.
After the equilibrium condition was reached, the solid was separated from the aqueous solution by centrifugation, and the remaining heavy metal in the solution was ana-lyzed by atomic absorption spectrophotometer (AAS SHI-MADZU AA6200). The amount of heavy metal adsorbed by solid adsorbent was calculated by the following equation:
q C C
adsorbent at equilibrium condition (mg/g), Co and Ce repre-sent the initial and equilibrium concentration respectively. The unit of Co and Ce is mg/L. The symbols m and V repre-sent the mass of adsorbent (g) and the volume of solution (L), respectively.
2.6. Adsorption kinetic study
The procedure of adsorption kinetic study is similar to the equilibrium study. In the adsorption kinetic exper-iment, fixed amount of adsorbent was added to a series of Erlenmeyer containing 100 mL of heavy metal solution with initial concentration 200 mg/L. The Erlenmeyer were shaken in a temperature controlled water bath at a precise temperature. At certain interval of time, the concentration of heavy metal in solution was determined by AAS and the amount of metal adsorbed onto the adsorbent at interval time t, called as qt (mg/g), was calculated by the equation
q C C
m V
t
o t
=
(
−)
(3)where Ct (mg/L) is the concentration of metal in solution at interval time t.
3. Results and discussion
3.1. Characterization of bentonite and nanocomposite
biochar nanocomposite was 43.8 meq/100 g. The decrease of CEC after thermal treatment possibly due to the defor-mation of some 2:1 layers of the bentonite structure. With the deformation of 2:1 layers, some of the exchangeable cations become associated with anouter tetrahedral sheet [16] or attach to some surface functional groups of biochar. Therefore, these exchangeable cations did not have the exchange capability anymore with methylene blue cation in the solution.
The purpose of zeta potential measurement is to obtain the isoelectric point of bentonite and bentonite biochar nanocomposite. From the measurement of zeta potential, the results indicate that the surface charge of both adsor-bents is pH dependent. The isoelectric points for benton-ite and nanocomposbenton-ite are 3.4 and 3.9, respectively. Below these isoelectric points, both of the adsorbents are positively charged while above these points both of the adsorbents are negatively charged. Since the adsorption experiments were conducted at pH 5, the surface of both bentonite and com-posite were negatively charged.
The porosity and surface chemistry of the solid adsor-bents play a significant role during the adsorption process. Therefore, the characterization of these properties in solid adsorbents is essential. In this study, the characterization of bentonite and bentonite – biochar nanocomposite was conducted using nitrogen sorption analysis, X-ray diffrac-tion (XRD), Fourier transform infrared (FTIR), and scanning electron microscopy (SEM).
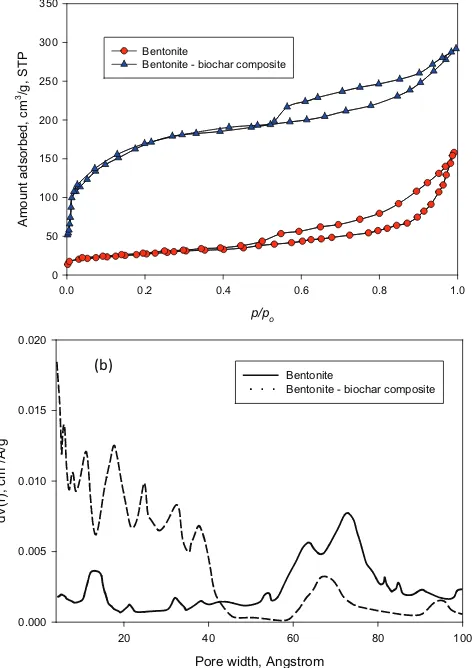
Nitrogen adsorption – desorption measurement is widely used for the characterization of the solid adsorbents. The nitrogen sorption isotherms and pore size distribution of bentonite and bentonite – biochar nanocomposite is given in Fig. 1. The BET-nitrogen surface area and cumulative pore volume for bentonite are 147.4 m2/g and 0.23 cm3/g, while for bentonite – biochar nanocomposite are 381.9 m2/g and 0.36 cm3/g. From Fig. 1a it can be seen that both of these adsorbents possess some amount of micropore struc-ture. The addition of biochar to bentonite structure to form composite increased the number of micropores as indicated in Fig. 1a. The microporous structure in the adsorbents structure is shown by rapid intake of nitrogen gas at a very low relative pressure. During the heat treatment, the break-down of the lignocellulosic structure created some pores in the structure of the nanocomposite. The addition of carbon dioxide gas during the heat treatment oxidized some of the carbon atoms in the biochar structure in composite and gen-erated new pores and large amounts of reactive sites on the biochar basal planes. The combination between type I and H3 hysteresis of the nitrogen sorption isotherm is observed for the composite (Fig. 1). H3 hysteresis indicates that com-posite has slit-shaped pore characteristic. This evidence shows that the nanocomposite possesses a combination between mesoporous and microporous structure.
The statistical representation of the size of the individ-ual pore in the bentonite and bentonite – biochar composite is given as DFT (density functional theory) pore size distri-bution (Fig. 1b). This figure clearly shows that the micro-porous structure is more dominant in the nanocomposite, while the bentonite has mesoporous structure. The presence of micropores and mesopores in bentonite – biochar nano-composite strongly influences its adsorption capability. Large mesopores play a major role in the molecular
trans-port of adsorbates from the bulk liquid into the internal structure of the adsorbent, while the micropores and small mesopores determine the sorption capability and proper-ties of the adsorbent.
X-ray diffraction patterns of bentonite and bentonite – biochar composite is given in Fig. 2. The diffractogram of bentonite – biochar nanocomposite reveals that the amor-phous structure of the biochar more dominant than ben-tonite structure as indicated in Fig. 2. The heat treatment at 400°C gave significant effect on the layered structure of bentonite, the intensity of several reflection peaks decreased due to the release of some structural water molecules from the bentonite interlayer. The evaporation of this structural water leaves space in the bentonite interlayer spacing. As mentioned before, during the heat treatment at 400°C, lig-nin, hemicellulose, and cellulose molecules decomposed into smaller molecular weight, and there was a possibility that these low molecular weight organic substances pene-trated and condensed into the space of the bentonite inter-layer spacing leading to a decrease of the reflection peaks of bentonite.
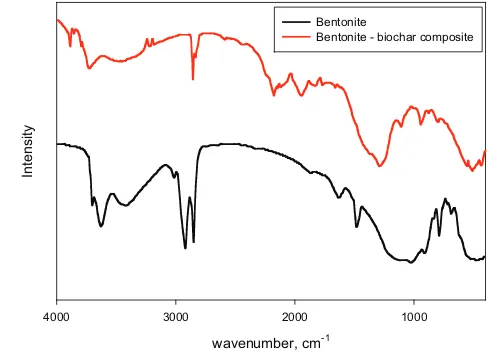
Fourier transform infrared spectroscopy (FTIR) was used for the characterization of surface functional groups of
ben-p/po
Bentonite - biochar composite
Pore width, Angstrom
Bentonite - biochar composite
(b)
tonite and bentonite – biochar nanocomposite. The main clay mineral in the bentonite is montmorillonite, and the charac-teristic absorption bands of this clay mineral are indicated at wave numbers 3620 cm–1 (Al(Mg)–O–H stretching), 3347 cm–1 (intermolecular hydrogen-bonded H–O–H stretching), 1634 cm–1 (H–O–H deformation vibration due to adsorbed water), 1060 cm–1 (Si–O–Si stretching vibration), 904 cm–1 and 621 cm–1 (Al–OH), 841 cm–1 and 790 cm–1 ((Al, Mg)–O), 520 cm–1 and 471 cm–1 (Si–O bending vibration) [5,17]. The FTIR spectra of bentonite – biochar composite (Fig. 3) indicates that several of the characteristic absorption bands of mont-morillonite disappear after heat treatment process, and sev-eral functional groups belong to biochar are present in the nanocomposite such as stretching vibration of C=O (1711 cm–1), The C–H stretching vibration of methyl group(2910 cm–1), C=C aromatic ring stretching (1580 cm–1), etc.
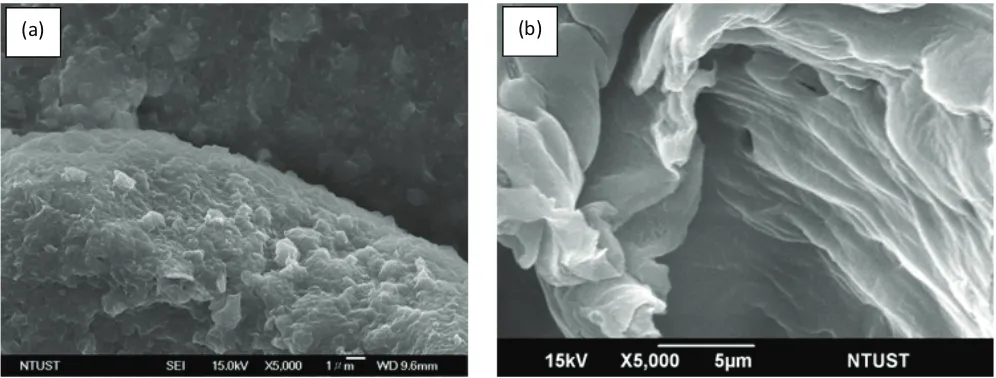
The direct observation of the solid adsorbents morphol-ogy and surface topography was conducted by scanning electron microscopy. Structural information and phase of the solid can be obtained directly through the assessment of the SEM image. The SEM images of bentonite and bentonite – biochar nanocomposite are given in Fig. 4.Totally different surface morphology between bentonite and nanocomposite is observed from this figure. Both of these adsorbents have complex structures.
3.2. Adsorption studies
Adsorption process probably is one of the most prac-tical methods for separation and purification of industrial products or by-products. This process is also one of the most widely used methods in the field of environment protection, especially in water and wastewater treatment system. The adsorption capability of bentonite – biochar nanocomposite prepared in this study was tested for the removal of Cu(II) and Pb(II) from aqueous solution. The adsorption equilibria of Cu(II) and Pb(II) onto bentonite and bentonite – biochar nanocomposite were correlated through adsorption isotherm equations. Several adsorption isotherms are available to correlate the adsorption
experi-mental data [18,19]. Since the adsorption equilibria of these heavy metals were obtained at three different temperatures, therefore, the Langmuir and Freundlich with their tempera-ture dependent forms were used to correlating the adsorp-tion equilibria data.
Langmuir model originally was developed for the adsorption of gas on a flat surface. Kinetic theory princi-ple was employed to develop this model. The mathematical expression of Langmuir model is as follows
q q K C
equilibrium condition. Parameter qmax (mg/g) represents adsorption capacity of the adsorbent. Parameter KL (L/mg) accounts for the adsorption affinity. Both of parameters qmax and KL are temperature dependent and have the
mathe-matic forms as follows
qmax =qoexp
(
β(
To−T)
)
(5)adsorbent at reference temperature To (K). The expansion coefficient of the adsorbate is represented by parameter β (1/K). Parameters KLo and ∆HL represent adsorption affinity at a reference temperature and isosteric heat of adsorption, respectively.
The Freundlich equation is the earliest empirical model to describe the gas phase adsorption data. Since the mathe-matical form of this model is simple, the Freundlich model can also be used for the liquid phase adsorption by only change the term of pressure with equilibrium concentra-tion. Freundlich equation has the form
qe K CF e
Bentonite - biochar composite
Fig. 2. XRD diffraction patterns of bentonite and bentonite – bio-char nanocomposite.
Bentonite - biochar composite
where KF ((mg/g) (L/mg)–n) and n are Freundlich tion capacity and heterogeneity constant for the adsorp-tion system, respectively. Both of these parameters can be extended to temperature dependent forms:
K K RT
Here the parameter KFo is the Freundlich adsorption
capacity at reference temperature To, and α/Fo is the
charac-teristic of the adsorption potential.
The temperature dependent parameters of the Lang-muir and Freundlich were obtained by non-linear least square methods. The fitting process was conducted for all the data at various temperatures simultaneously by mini-mizing Sum Square of Error (SSE) as the objective function
SSE
Here the experimental amount of heavy metal adsorbed indicated by symbol qe(exp), while the calculated amount of heavy metal adsorbed by the adsorbent is qe(cal).
The temperature dependent parameters of the Lang-muir and Freundlich obtained from the fitting process are summarized in Table 2. The adsorption isotherms of Cu(II) and Pb(II) onto bentonite and bentonite – biochar nano-composite are depicted in Figs. 5 and 6. In these figures, the adsorption experimental data are indicated as symbols, while the solid lines represent the theoretical data from the models.
Visually, both of Langmuir and Freundlich equations can represent the adsorption experimental data pretty well as seen in Figs. 5 and 6. However, the correct procedure to determine the applicability of adsorption model to
repre-sent the experimental data is not just only depend on the visual representation of the model and the values of R2, but we must examine the values of fitted parameters. The fitted value of each parameter should be reasonable and consis-tent with its physical meaning.
The parameter qo (Langmuir) and KFo (Freundlich) rep-resent the adsorption capacity of the adsorbent. Based on the adsorption experimental data depicted in Figs. 5, 6, at high equilibrium concentration, the adsorption isotherm of Cu(II) onto bentonite become flat at adsorption capac-ity around 31 mg/g (30°C) and for the composite around 75 mg/g (30°C). For adsorption of Pb(II), the experimen-tal adsorption capacities are around 24 mg/g for bentonite and 42 mg/g for composite. By comparing the experimental adsorption capacity with the parameter qo and KFo, it is clear
that the values of parameter qo for all systems are similar to
experimental results. The failure of Freundlich model and its temperature dependent forms to represent the adsorp-tion experimental data due to the absence of saturaadsorp-tion capacity in the equation. Every adsorbent has a certain limit to accommodate adsorbate molecules, and the Freundlich equation does not capture this phenomenon. Since the parameter KFo in Freundlich equation cannot describe the experimental data correctly, therefore we will not discuss another parameter further.
Parameter βin Eq. (5) is a parameter relates to expan-sion coefficient of adsorbate. This parameter is specific for each adsorbate and independent of the type of adsorbent [20]. The values of parameter β obtained from the fitting of experimental data listed in Table 2 are substantially independent of the adsorbent, reasonable, and consistent. Parameter KLo measures how strong the attraction and attachment of adsorbate molecules onto the surface of the adsorbent. The high value of this parameter indicates that the attraction force is strong and the surface of the adsor-bate is covered with more adsoradsor-bate molecules. The value of this parameter for composite is greater than natural bentonite. The surface of nanocomposite contains various functional groups from either bentonite or biochar, and the presence of these functional groups gives a positive
con-(a)
(b)
(a)
Equilibrium concentration (Ce), mg/L
0 20 40 60 80 100 120 140 160 180
Amount adsorbed
(
qe
), mg/g
0 5 10 15 20 25 30 35
T = 30oC
T = 40oC
T = 50oC
Langmuir
(b)
Equilibrium concentration (Ce), mg/L
0 20 40 60 80 100 120 140 160 180
Amount adsorbed
(
qe
), mg/g
0 5 10 15 20 25 30 35
T = 30oC
T = 40oC
T = 50oC Freundlich
(c)
Equilibrium concentration (Ce), mg/L
0 20 40 60 80 100 120 140 160 180
Amount adsorbed
(
qe
), mg/g
0 20 40 60 80
T = 30oC
T = 40oC
T = 50oC
Langmuir
(d)
Equilibrium concentration (Ce), mg/L
0 20 40 60 80 100 120 140 160 180
Amount adsorbed
(
qe
), mg/g
0 20 40 60 80
T = 30oC T = 40oC
T = 50oC
Freundlich
Fig. 5. Equilibrium data of Cu(II) adsorption onto bentonite and fitting of (a) Langmuir, (b) Freundlich, and equilibrium data of Cu(II) adsorption onto bentonite – biochar nanocomposite and fitting of (c) Langmuir, and (d) Freundlich.
Table 2
The fitted temperature dependent parameters of isotherm models for Cu(II)and Pb (II) adsorption onto bentonite and bentonite – biochar nanocomposite
Isotherm model Bentonite Bentonite – biochar nanocomposite
Parameter Value R2 Parameter Value R2
Cu(II) adsorption
Langmuir qo (mg/g) 32.5 0.998 qo (mg/g) 78.1 0.998
β (1/K) 0.0042 β (1/K) 0.0043
KLo (L/mg) 1.88 × 10⁻⁶ K
Lo (L/mg) 2.14 × 10
–6
∆HL (kJ/mol) 30.7 ∆HL (kJ/mol) 33.2
Freundlich KFo (mg/g)(mg/L)1/n 39.31 0.993 K
Fo (mg/g)(mg/L)1/n 1107.62 0.989
α/Fo(mol/J) 7.584 α/Fo (mol/J) 217.7
Pb(II) adsorption
Langmuir qo (mg/g) 27.2 0.998 qo (mg/g) 44.7 0.997
β (1/K) 0.0053 β (1/K) 0.0051
KLo (L/mg) 1.29 × 10⁻⁶ K
Lo (L/mg) 1.76 × 10⁻⁶
∆HL (kJ/mol) 27.8 ∆HL (kJ/mol) 30.9
Freundlich KFo (mg/g)(mg/L)1/n 5.49 0.923 K
Fo (mg/g)(mg/L)
1/n 32.88 0.988
tribution to the attraction force of the adsorbent. Since the bentonite – biochar composite has higher attraction force so that it can adsorb more adsorbate molecules than ben-tonite. The values of parameter KLo are reasonable and
con-sistent with all systems.
Figs. 5, 6 show that temperature gives an adverse effect on the amount of heavy metal adsorbed by the adsorbent. The uptake of heavy metal decrease with the increase of tem-perature as seen in Figs. 5–6. This phenomenon is belonging to physical adsorption. The isosteric heat of adsorption of physical adsorption is less than 40 kJ/mol. The increase of temperature weakens the interaction between heavy metals (Cu(II) and Pb(II)) and the adsorbents. Therefore the uptake of heavy metals by the adsorbents decreased with increas-ing temperature. The values of isosteric heat of adsorption (∆HL) obtained from the fitting of the experimental data are
consistent with the physical meaning for physical adsorp-tion. Isosteric heat of adsorption of both metals on nano-composite is higher than on bentonite. This phenomenon indicates that other bonding mechanisms between surface
functional groups in the nanocomposite and heavy metals possibly took place during the adsorption process.
Based on the assessment of the physical meaning of the value of fitted parameters of Langmuir and Freundlich, it is evident that Langmuir equation with its temperature dependent forms can represent the adsorption data better than Freundlich equation.
3.3. Kinetic studies
In the design of the adsorption system, it is necessary to have information about the rate at which the adsorbate removal takes place in a given solid/solution system [21]. There is some adsorption kinetic models are available. Some of the models were developed based on fundamen-tal approach, while others are purely empirical with two or more adjustable parameters.
Pseudo-first and pseudo-second order probably the most widely used models to correlate the adsorption kinetic data due to its simplicity. Both of these models were
devel-(a)
Equilibrium concentration (Ce), mg/L
0 20 40 60 80 100 120 140 160
Equilibrium concentration (Ce), mg/L
0 20 40 60 80 100 120 140 160
Equilibrium concentration (Ce), mg/L
0 20 40 60 80 100 120 140 160
Equilibrium concentration (Ce), mg/L
0 20 40 60 80 100 120 140 160
oped based on fundamental of inter facial kinetic approach [21]. The pseudo-first order was initially developed in late of the ninetieth century by Lagergren [22]. The differential form of the pseudo-first order is:
dq
dt k q q
t
e t
= 1
(
−)
(11)The integration of Eq. (11) with the boundary conditions t = 0 → qt = 0, and t = t → qt = qt give the following result
qt=qe
(
1−exp( )
−k t1)
(12) where qt (mg/g) is the amount of adsorbate adsorbed at time t, and k1 is a time constant of pseudo-first-order model.The pseudo-second order kinetic model was first devel-oped by Blanchard et al. [23]. Usually, this kinetic model is associated with the rate of adsorption/desorption directly controls the overall sorption kinetics [21]. The differential form of pseudo-second order is as follows:
dq
dt k q q
t
e t
= 2
(
−)
2
(13)
The boundary conditions used to solve Eq. (13) are: t = 0 → qt = 0, and t = t → qt = qt, and give the result as
follows
q q q k t
q k t
t e
e
e
= +
2
2
1 (14)
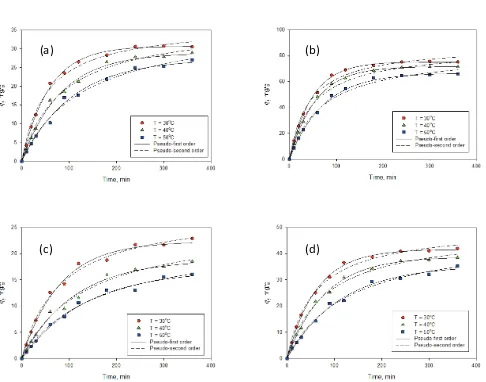
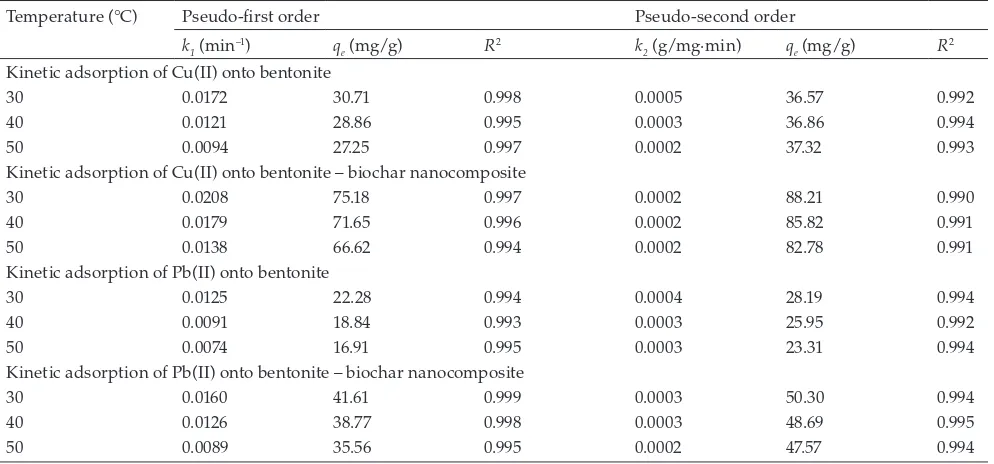
Here k2 is a time constant of pseudo-second order model. Figs. 7a and 7b depict the adsorption experimental kinetic data (as symbols) of Cu(II) onto bentonite and bentonite – biochar nanocomposite, respectively. For the adsorption of Pb(II), the kinetic data are given in Figs. 7c and 7d. The solid lines are the theoretical values of pseu-do-first order while the dash lines are theoretical values of pseudo-second-order equation. The parameters of the pseudo-first and pseudo-second order obtained from the fitting of the experimental data are summarized in Table 3. Both of these models can represent the adsorption kinetic data well with the value of R2 > 0.99. However, if we com-pare the values of qe obtained from the fitting with the experimental results, the pseudo-first order gives smaller deviation than pseudo-second order. This evidence indi-cates that physical adsorption is the primary controlling
(a)
(b)
(c)
(d)
mechanism for the removal of Cu(II) and Pb(II) from aque-ous solution using bentonite and bentonite – biochar com-posite as the adsorbents.
Both parameters k1 and k2 are time scaling factor for pseudo-first and pseudo second order, respectively [21]. These parameters strongly depend on the applied operat-ing conditions such as temperature, initial condition, pH of the solution, and agitation rate. The value of parameter k1 strongly dependent on the temperature of adsorption as indicated in Table 3. It decreases with increasing tempera-ture. This evidence indicates that longer time is required to reach an equilibrium condition. While k1 strongly dependent on the temperature, the parameter k2 essentially independent of temperature. Based on the experimental results (for all adsorption systems), at 30°C, the equilibrium condition was achieved after 360 min, and longer time was required when the temperature of the solution was increased from 30°C to 40 and 50°C. This evidence supports the validity of the pseu-do-first order to represent the adsorption kinetic data.
3.4. Thermodynamic study
To obtain a complete description on the phenomena of adsorption of Cu(II) and Pb(II) onto bentonite and benton-ite – biochar nanocomposbenton-ite, the assessment of several ther-modynamic properties of the adsorption system has also been conducted in this study. The thermodynamic feasibil-ity of the adsorption of Cu(II) and Pb(II) onto bentonite and nanocomposite was accessed through standard Gibb’s free energy change (∆G°), standard of enthalpy change (∆H°), and standard of entropy change (∆S°). Standard Gibb’s free energy change was determined by the following equation
∆Go RT K
D
= − ln (15)
where KD is thermodynamic distribution coefficient. The value of KD was obtained from the plots of ln(qe/Ce) vs Ce
[24] as seen in Fig. 8. The correlation between thermody-namic distribution coefficients with ∆H° and ∆S° is given by the following equation:
lnK S
R H RT D
o o
=∆ −∆ (16)
The values of KD, ∆G°, ∆H° and ∆S°are summarized in Table 4.
The spontaneity of the adsorption process is measured by standard Gibb’s free energy. The negative ∆G° indicates that the adsorption process is spontaneous; the large neg-ative value of ∆G° also indicates that the system has high adsorption affinity. The higher adsorption affinity, more heavy metal molecules will attach to the surface active sites of the adsorbent. The values of ∆G° are consistent with adsorption experimental data depicted in Figs. 5 and 6. For adsorption of Pb(II) onto bentonite, the increase of tempera-ture also increase the value of ∆G° as indicated in Table 4. The positive value of ∆G° indicates that the adsorption of Pb(II) onto bentonite at high temperature (40 and 50°C) is not spontaneous. With this condition, the adsorption and desorption of Pb(II) onto bentonite is not in a thermody-namic equilibrium condition [25].
Standard entropy change (∆S°) measures the random-ness of the adsorption system. The positive value of ∆S° shows the randomness of the interface between the bentonite or nanocomposite and the adsorption medium [26,27], while the negative value of ∆S°indicates an increase of orderliness of the adsorption systems. The more order of the system, less amount of adsorbate molecules are adsorbed on the surface of the adsorbent. The values of ∆S°of all systems (Table 4) are negative, and the lowest one is Pb(II) – bentonite system. Ben-tonite is a clay mineral, which has ordered crystalline layered Table 3
kinetic parameters for pseudo-first and pseudo-second order models
Temperature (°C) Pseudo-first order Pseudo-second order
k1 (min–1) q
e (mg/g) R2 k2 (g/mg·min) qe (mg/g) R2
Kinetic adsorption of Cu(II) onto bentonite
30 0.0172 30.71 0.998 0.0005 36.57 0.992
40 0.0121 28.86 0.995 0.0003 36.86 0.994
50 0.0094 27.25 0.997 0.0002 37.32 0.993
Kinetic adsorption of Cu(II) onto bentonite – biochar nanocomposite
30 0.0208 75.18 0.997 0.0002 88.21 0.990
40 0.0179 71.65 0.996 0.0002 85.82 0.991
50 0.0138 66.62 0.994 0.0002 82.78 0.991
Kinetic adsorption of Pb(II) onto bentonite
30 0.0125 22.28 0.994 0.0004 28.19 0.994
40 0.0091 18.84 0.993 0.0003 25.95 0.992
50 0.0074 16.91 0.995 0.0003 23.31 0.994
Kinetic adsorption of Pb(II) onto bentonite – biochar nanocomposite
30 0.0160 41.61 0.999 0.0003 50.30 0.994
40 0.0126 38.77 0.998 0.0003 48.69 0.995
(a)
C
e
0 20 40 60 80 100 120 140 160 180
ln
(
q/e
Ce
)
-2.5 -2.0 -1.5 -1.0 -0.5 0.0 0.5 1.0 1.5
T = 30o C Plot KD at 30
o C
T = 40o C Plot KDat 40
o C
T = 50o
C Plot KD at 50
o C
(b)
C
e
0 20 40 60 80 100 120 140 160 180
ln
(
q/e Ce
)
-1.5 -1.0 -0.5 0.0 0.5 1.0 1.5 2.0 2.5
(c)
Ce
0 20 40 60 80 100 120 140 160
ln
(
q/e Ce
)
-2.5 -2.0 -1.5 -1.0 -0.5 0.0 0.5
(d)
C
e
0 20 40 60 80 100 120 140 160
ln
(
q/e Ce
)
-2.0 -1.5 -1.0 -0.5 0.0 0.5 1.0 1.5
Fig. 8. Thermodynamic distribution coefficient. (a) Cu(II) – bentonite, (b) Cu(II) – nanocomposite, (c) Pb(II) – bentonite, and (d) Pb(II) – nanocomposite.
Table 4
Thermodynamic parameters of adsorption of Cu(II) and Pb(II) onto bentonite and bentonite – biochar composite
System Temperature, °C Ln KD ∆G°, J/mol ∆S°, J/mol. K ∆H°, J/mol
Cu(II) – bentonite 30 0.648 –1,632 –39.32 –13,688
40 0.611 –1,590
50 0.309 –830
Cu(II) – nanocomposite 30 1.561 –3,932 –17.29 –9,103
40 1.360 –3,539
50 1.339 –3,595
Pb(II) – bentonite 30 0.043 –108 –73.82 –22,505
40 –0.210 546
50 –0.511 1,372
Pb(II) – nanocomposite 30 0.944 –2,378 –32.59 –12,171
40 0.687 –1,787
structure composed of polymeric sheets of SiO4 tetrahedral linked into sheets of (Al, Mg, Fe)(O,OH)6 octahedral [28]. As mentioned in the previous section, during the thermal pro-cess in the preparation of nanocomposite, the breakdown of the lignocellulosic structure created some pores in the struc-ture of the nanocomposite, the creation of these new pores made the structure of the nanocomposite become disorder, and it increased the randomness of the adsorption system. The increase of the randomness of the system also increases the value of ∆S° as indicated in Table 4.
The nature of adsorption mechanism whether the adsorption belongs to physisorption or chemisorption is indicated by the standard of enthalpy change (∆H°). The positive value of ∆H°indicates that the adsorption process is an endothermic process, the uptake of adsorbate mole-cules increase with the increase of temperature. While the negative value of ∆H°indicates that the process is exother-mic, the temperature gives adverse effect on the amount of adsorbate adsorbed by the adsorbent. The uptake of Cu(II) and Pb(II) onto bentonite and nanocomposite decrease with the increasing of temperature as seen in Figs. 5 and 6.
4. Conclusions
Bentonite – biochar nanocomposite was prepared by thermal treatment of natural bentonite and water hyacinth at 400°C under a combination of nitrogen and carbon dioxide environment. Bentonite – biochar nanocomposite has both of microporous and mesoporous structures. The removal of Cu(II) and Pb(II) from aqueous solution using bentonite and bentonite – biochar nanocomposite was carried out isother-mally at 30, 40 and 50°C. The adsorption capability of Ben-tonite – biochar nanocomposite was tested for the removal of Cu(II) and Pb(II) from aqueous solution. Langmuir and Freundlich adsorption equations with their temperature dependent forms were employed to correlate the adsorption experimental data. Langmuir equation and its temperature dependent forms can correlate the experimental data better than Freundlich model. The adsorption capacities of benton-ite towards Cu(II) and Pb(II) are 32.5 mg/g and 27.2 mg/g, respectively. For bentonite-biochar nanocomposite, the max-imum adsorption capacities are 78.1 mg/g and 44.7 mg/g for Cu(II) and Pb(II), respectively. The adsorption kinetic follows the pseudo-first-order kinetic model. Parameter k1 strongly dependent on the temperature. The thermodynamic study indicated that the adsorption of Cu(II) and Pb(II) onto bentonite and nanocomposite were exothermic (physical adsorption) and spontaneous.
Acknowledgement
This research was funded by The Ministry of Research and Technology and the Higher Education Republic of Indonesia through The Competency Grant 2016.
References
[1] B. Ali Fil, A.E. Yilmaz, R. Boncukcuoğlu, S. Bayar, Removal of divalent heavy metal ions from aqueous solutions by Dowex HCR-S synthetic resin, Bulgarian Chem. Com., 44 (2012) 201–207.
[2] R. Mallampati, L. Xuanjun, A. Adin, S. Valiyaveetill, Fruit peels as efficient renewable adsorbents for removal of dis-solved heavy metals and dyes from water, ACS Sustain. Chem. Eng., 3 (2015) 1117–1124.
[3] M.S. Islam, M.S. Rahaman, J.H. Yeum, Electrospun novel super-absorbent based on polysaccharide–polyvinyl alcohol– montmorillonite clay nanocomposites, Carbohydrate Pol., 115 (2015) 69–77.
[4] R. Bhattacharyya, S.K. Ray, Removal of congo red and methyl violet from water using nano clay filled composite hydrogels of poly acrylic acid and polyethylene glycol, Chem. Eng. J., 260 (2015) 269–283.
[5] R. Koswojo, R.P. Utomo, Y.H. Ju, A. Ayucitra, F.E. Soetaredjo, J. Sunarso, S. Ismadji, Acid green 25 removal from wastewater by organo-bentonite from Pacitan, Appl. Clay Sci., 48 (2010) 81–86. [6] Yesi, F.P. Sisnandy, Y.H. Ju, F.E. Soetaredjo, S. Ismadji, Adsorp-tion of acid blue 129 from aqueous soluAdsorp-tions onto raw and surfactant-modified bentonite: application of temperature-de-pendent forms of adsorption isotherm, Adsorp. Sci. Technol., 28 (2010) 847–868.
[7] A. Kurniawan, H. Sutiono, Y.H. Ju, F.E. Soetaredjo, A. Ayucitra, A. Yudha, S. Ismadji, Utilization of rarasaponin natural surfac-tant for organo-bentonite preparation: application for methy-lene blue removal from aqueous effluent, Micropor. Mesopor. Mater., 142 (2011) 184–193.
[8] E. Nathaniel, A. Kurniawan, F.E. Soetaredjo, S. Ismadji, Orga-no-bentonite for the adsorption of Pb(II) from aqueous solu-tion: temperature dependent parameters of several adsorption equations, Desal. Wat. Treat., 36 (2011) 280–288.
[9] A.K. Rahardjo, M.J.J. Susanto, A. Kurniawan, N. Indraswati, S. Ismadji, Modified Ponorogo bentonite for the removal of ampi-cillin from wastewater, J. Hazard. Mater., 190 (2011) 1001–1008. [10] C.H. Zhou, D. Zhang, D.S. Tong, L.M. Wu, W.H. Yu, S. Ismadji,
Paper-like composites of cellulose acetate–organo-montmoril-lonite for removal of hazardous anionic dye in water, Chem. Eng. J., 209 (2012) 223–234.
[11] M. Anggraini, A. Kurniawan, L.K. Ong, M.A. Martin, J.C. Liu, F.E. Soetaredjo, N. Indraswati, S. Ismadji, Antibiotic detoxifi-cation from synthetic and real effluents using a Novel MTAB surfactant-montmorillonite (organoclay) sorbent, RSC Adv., 4 (2014) 16298–16311.
[12] R. Srinivasan, Advances in application of natural clay and its composites in removal of biological, organic, and inorganic contaminants from drinking water. Adv. Mater. Sci. Eng., 2011 (2011) 1–17. http://dx.doi.org/10.1155/2011/872531 (Article ID 872531).
[13] A.B. Dukic, K.R. Kumric, N.S. Vukelic, M.S. Dimitrijevic, Z.D. Bascarevic, S.V. Kurko, L.L. Matovic, Simultaneous removal of Pb2+, Cu2+, Zn2+ and Cd2+ from highly acidic solutions using mechano chemically synthesized montmorillonite–kaolinite/ TiO2 composite, Appl. Clay Sci., 103 (2015) 20–27.
[14] Z.M.O. Rzayev, A. Uzgoren-Baran, U. Bunyatova, Functional organo-Mt/copolymer nano architectures: microwave-as-sisted rapid synthesis and characterisation of ODA–Mt/ poly[NIPAm-co-(MA-alt-2,3-2H-DHP)] nanocomposites, Appl. Clay Sci., 105–106 (2015) 1–13.
[15] A.A. Azeez, K.Y. Rhee, S.J. Park, D. Hui, Epoxy clay nanocom-posites – processing, properties and applications: A review, Composite: B, 45 (2013) 308–320.
[16] H.J. Bray, S.A.T. Redfern, S.M. Clark, The kinetics of dehydra-tion in Ca-montmorillonite: an in situ X-ray diffracdehydra-tion study, Mineral Mag., 62 (1998) 647–656.
[17] C.H. Unlu, E. Gunister, O. Atici, Effect of acidity on xylan– montmorillonite bionanocomposites, Mater. Chem. Phys., 136 (2012) 653–660.
[18] B. Ali Fil, R. Boncukcuoğlu, A.E. Yilmaz, S. Bayar, Adsorption of Ni(II) on ion exchange resin: Kinetics, equilibrium and ther-modynamic studies. Korean J. Chem. Eng., 29 (2012) 1232–1238. [19] B. Ali Fil, M. Korkmaz, O. Gengiz, An empirical model for
[20] S. Ismadji, S.K. Bhatia, A modified pore filling isotherm for liq-uid phase adsorption in activated carbon, Langmuir, 17 (2001) 1488–1498.
[21] W. Plazinski, W. Rudzinski, A. Plazinska, Theoretical models of sorption kinetics including a surface reaction mechanism: a review, Adv. Colloid Interface Sci., 152 (2009) 2–13.
[22] S. Lagergren, Zur theorie der sogenannten adsorption gelo¨ster stoffe Kungliga Svenska Vetenskapsakademiens, Handlingar, 24 (1898) 1–39.
[23] G. Blanchard, M. Maunaye, G. Martin, Removal of heavy met-als from waters by means of natural zeolites, Water Res., 18 (1984) 1501–1507.
[24] A.A. Khan, R.P. Singh, Adsorption thermodynamics of carbo-furan on Sn(IV) arsenosilicate in H+, Na+ and Ca2+ forms, Col-loids Surf., 24 (1987) 33–42.
[25] V.N. Tirtom, A. Dincer, S. Becerik, T. Aydemir, A. Celik, Com-parative adsorption of Ni(II) and Cd(II) ions on epichlorohy-drin crosslinked chitosan–clay composite beads in aqueous solution, Chem. Eng. J., 197 (2012) 379–386.
[26] A. Kara, A. Tuncel, Kinetics, Isotherms and thermodynam-ics of the adsorption of lead(II) ions onto porous mono-sized microspheres possessing imidazole functional groups, Ads. Sci. Technol., 29 (2011) 259–275.
[27] B. Ali Fil, R. Boncukcuoğlu, A.E. Yilmaz, S. Bayar, Adsorption kinetics and isotherms for the removal of zinc ions from aque-ous solutions by an ion-exchange resin, J. Chem. Soc. Pak., 34 (2012) 841–848.