Volume 7 Issue 5, May 2018
Computerized Adaptive Testing (CAT) Using
Triangle Decision Tree Method
Dr. Winarno, S. Si, M. Pd.
1State Institute for Islamic Studies (IAIN) Salatiga Central Java, Indonesia
Abstract: These This paper explains how the procedure of making computerized adaptive testing (CAT) uses a triangle decision tree method that starts from the determination of the number of items based on the many levels used, the placement of items based on the many levels used, the initial item selection procedure, the item selection procedure during test implementation using the triangle decision tree method, the procedure to end the test, up to the estimation ability of test participants.
Keywords: triangle decision tree method, the placement of items, item selection, estimation ability.
1.
Introduction
Evaluation is one of a series of activities to improve the quality, performance or productivity of an institution in implementing its program. The purposes of evaluation areto overview and understand the processes that occur in the learning process. This may help to obtain information about what has/has not been achieved (Mardapi, 2004, P.19). Evaluation provides information for the class and educators to improve the quality of the teaching and learning process. Evaluation as a component of teaching is the process of
knowing the success of a teaching’s program and is a process
of assessment aimed at knowing the inherent difficulties of the learning process (Murshel, 1954, p.373).
One of the ways in conducting evaluation in teaching and learning process is by using test. During this time, most of the tools to measure tests uses paper and pencil test. Recent developments in efforts to improve test execution with the presence of computer technology have been begun to be used for the advancement of testing (Hambleton, Swaminathan, and Rogers: 1991, p. 146). Computerized individual judgments are more efficient and accurate than paper and pencil assessment (Wainer, 1990, p. 273). One of the computerized personalization prototypes developed today is Computerized Adaptive Testing (CAT). CAT is a testing or evaluation method using adaptive information technology. The adaptive here means that the subsequent exam assignment depends on the conduct of the test participants in answering the previous question so that the exams given for each participant can be unique based on the level of ability of each participant.
The advantages offered by CAT include: (1) CAT is more efficient and accurate in measuring the ability of test participants (Weiss, 2004, p. 2). CAT does not require an answer sheet because the score can be immediately known by the test participants once the test has been completed, (2) the given questions have the level of difficulty in accordance with the student's ability which is not too difficult or too easy, (3) the assessment can be done immediately that provides quick feedback to students, (4) the exam security can be improved. The given set of questions will be different for each student so that the next ones will be unpredictable. In
addition, when the number of questions is big, the likelihood of occurring the same questionmore than once is very small that the probability of the student to memorize the questions becomes also very small. The confidentiality of the question can be preserved, since the questions are stored in a data base and only the CAT maker who is able to update it, and (5) the exam can be presented through text, graphics, audio, and even video clips.
CAT requires: (1) question bank; (2) initial item of selection procedure; (3) item selection procedures during test execution; (4) procedures for ending tests; and (5) estimated ability of test participants (Masters & Keeves, 1999, p. 130). In the selection procedure of the starting item, test items are given in a moderate degree of difficulty. The procedure for selecting test items during test execution in CAT is based on the answer pattern of the test participants used as the rules for determining the next test item.
One of the item selection methods during the test execution is using triangle decision tree. It is a graphical decision model. A loopin this method shows test parameters containing IRT three parameters i.e. difficulty level, different power, and guess rate. Each loophas only two branches of twigs and each of this twig that comes out of the loop head to two directions namely the branch to the left and the branch to the right. The direction of the branch will be to the right if the test participant answers the question correctly and the branch direction will go to the left if the test participant gives wrong answers. The procedure of ending the test is given, so that the test is not too long and the estimated ability of the testers
using the maximum likelihood method(MLE).
1) Computerized Adaptive Testing (CAT)
Volume 7 Issue 5, May 2018
Adaptive testing is different from Sequential testing(Kingsbury and Weiss, 1983 in Masters & Keeves, 1999, p. 35). On the latter testing, test items are selected fixed or random from the question bank, while in the adaptive testing, test items are selected from a question bank based on the items selection procedure. Many items on both sequential testing and adaptive testing are the same, but the difference between the two tests lies in the rules of dismissal.
1.1 Bank Item inComputerized Adaptive Testing (CAT)
Bank Item in CAT generally usesItem Response Theory
(IRT) (Lord and Novick, 1968; Lord, 1980). The origin of IRT is the combination of a legal version of phi-gammaand
item factor analysis calledLatent Trait Theory, then currently
known as Item Response Theory (McDonald, 1999, p. 8).
IRT has the following characteristics: (a) IRT is not based on dependent group, (b) student score is described and is not a trait, the learner's estimation ability level is independent, (g) assumptions in the population of difficulty, differentiation, and guessing levels are independent samples that illustrate for the purpose of questions’ calibration, (h) the statistics used to calculate students' level of ability are predicted to be accomplished, (Hambleton and Swaminathan, 1985, p. 11). So IRT is the relationship between the probability of a correct answer to an item and the student's ability or student's level of achievement.
According to Hambleton, Swaminathan, & Rogers (1991, p. 5), the idea of Item Response Theory / IRT is based on two ponsulates: (a) the subject's achievement in a question item can be predicted by a set of factors called latent traits, and (b) the relationship between the subject's achievement on items and the underlying ability device according to a certain monotonic rise function graph called the item characteristic curve (ICC). This item characteristics curve illustrates that the higher the level of testers' ability the more likely the correct answer to an item.
1.2 Assumptions on IRT Approach
The Approach the IRT is based on a mathematical model, where the individual chances of answering a correct item depend on the individual's ability and the items characteristics. This means that high-ability test participants will have a greater probability of responding better compared to low-ability participants. This approach has assumptions about the data on which this model can be applied. Hambleton & Swaminathan (l985, p. 16) and Hambleton, Swaminathan, & Rogers (1991) suggest that there are three underlying assumptions for the IRT, namely unidimension, local independence and parameter invariant. Those three assumptions can be explained as follows.
Unidimension, this means that each test item only measures one ability. For example, in a mathematicsachievement test, the items contained in it only measure students' ability in the
field of mathematics course, not other fields. In practice, unidimensional assumptions can not be met strictly due to cognitive factors, personality and administrative factors in tests, such as anxiety, motivation, and tendency to guess. Taking note of this, unidimensional assumptions can be shown only if the test contains only one dominant component that measures the achievement of a subject.
In IRT, the relationship between the participant's ability and the test score achieved is expressed by a non-linear curve. Figure 2 illustrates a conditional distribution in a part of the ability level in the subpopulations of test participants. Along the regression line, there is a spread of test scores. Variability of measurement error test scores may occur. If the distribution varies across multiple subpopulations, then the test measures not only a single ability (Hambleton &
Swaminathan, l985). Suppose there are 2 subpopulations,
1
G
andthe test score will be presented as the same function graph if the test measures one dimension of ability.If the factors affecting achievement are constant, then the subject's response to any pair of items will be statistically
independent forf each. This condition is called local
independence. It occurs when the factors affecting achievement become constant, so the subject's response to any pair of items will be statistically independent of each other. This assumption will be fulfilled if the participant's answer to an item does not affect the participant's answer to other items. A test to fulfill the assumption of local independence can be done by proving that the chances of the answer pattern of each test participant are the same as the result of the chance of the testee's answer on each item.
According to Hambleton, Swaminathan, and Rogers (1991, p. 10), local independence is mathematically expressed as test takers with ability to answer the -icorrectly.
Parameter invariant is characteristic of the item that does not depend on the distribution of the testers' ability parameters and the characterized parameters of the test takers do not depend on the item feature. A person's abilities will not change simply because of testing different levels of difficulty and the test item parameters will not change simply because they are tested to a different group of test participants.
Volume 7 Issue 5, May 2018
of the test takers is not different even if the tests performed differentlyin degree of difficulty. Invariance of item parameters can be investigated by testing different groups of participants. Item parameter invariant can be proven if the items parameter estimation is not different although it is tested on test takers whose their ability level are different. In the item response theory, besides the assumptions that have been previously described, the most important things to note is the selection of the right model. Choosing the right model will reveal the true state of the test data as a result of measurement.
In addition to these three assumptions expressed by Hambleton et al, Wainer and Mislevy propose four other assumptions of the IRT approach. The assumptions of the IRT approach according to Wainer and Mislevy (1990) are:
a) The order of the test items is irrelevant. In contrast to the
classical approach which provides an easy point at the beginning of the test and then proceeds with a more difficult problem item, the granting of questions to the IRT approach does not need to look at the sequence of difficult questions. Thus, items can be administered according to the ability of the item.
b) The same item parameter is used for all test takers. If a group of test participants will be predicted with a set of test items, then the IRT model used on the items should be the same. The goal is that the scores obtained can be compared with each other.
c) All item parameters are known. To be able to estimate the
proficiency of test participants, the parameters of each item should be known. To know the parameters of each item, calibration or estimations are needed.
d) The response of the test participants is not related to the item parameter. This assumption is similar to local indepedence assumptions put forward by Hambleton, Swaminathan and Rogers before.
2.3. The Approach Model ofItem Response Theory
The models used in the IRT approach are falsifiable models (Hambleton, Swaminathan and Rogers, 1991, p.7). That is, the IRT model used can match or not match the test data being analyzed. In other words, the IRT model used can not explain the test data. Thus, it is necessary to do a goodness of fit analysis of the test data. So if there is a mismatch between the data and the model, it means that the IRT model used can not be applied to the test data being analyzed.
In the item response theory, a probabilistic approach is used to express the relationship between participants' abilities and expectations of correct answers. In this theory, the opportunity density function. Given the ability variables
squared on the normal opportunity density function, it causes more complicated integration. This is what led to the use of logistic models on the item response theory.
There are three logistic models in the item response theory, one logistic model (1P), two-parameter logistics model (2P), and three parameters (3P) logistics model (Hambleton, Swaminathan and Rogers, 1991). The difference of the three models lies in the number of parameters used in describing the item characteristics in the model used. In general, the parameters used are the difficulty index with the symbol (b), the power difference index of the item with the symbol (a) and the pseudoguessing index with the symbol (c). These three models are used on unidimensional assumptions and dichotomous discrete data items.
2.4. Three Parameter Logistics Model (3P)
As the name implies, the three-parameter logistics model is determined by three item characteristics, ie, the difficulty index of the item with the symbol (bi), the item differential
power index with the symbol (ai), and the pseudoguessing
parameter (symbols of the guess rate) with the symbol (ci).
Given the guessing level of the three-parameter logistics model, it is possible to have low-ability subjects having an opportunity to answer the item correctly.
Mathematically, the three-parameter logistics model can be expressed as follows (Hambleton, Swaminathan, and Rogers, 1991, p. 17 and Hambleton, and Swaminathan, 1985, p. 49).
) corresponding to the origin of the normal distribution.This statement is an assumption that underlies value of bi. difficulty index is very high for test participant.
Parameter aiis the differentiation value own by item i. This
parameter illustrates how well an item can differentiate
high-ability and low-high-ability participants. On a characteristic curve,
ai is the slope of the curve at bion a certain ability scale.
Volume 7 Issue 5, May 2018
and +. On a good item this value has a positive relationshipwith performance on items with measured capabilities, and ai
lies between 0.0 and 2.0 (Hambleton dan Swaminathan,
1985, p. 37).
Opportunities to answer correctly by giving a pseudo
guessing answer are denoted by ci, called the guess rate. This
parameter provides a nonzero lower asymtoteon the item
characteristics curve (ICC).This parameter illustrates the probability of participants with low ability to answer correctly on an item that has an index of difficulty that is not in accordance with the ability of the participant. The
magnitude of the ci price is assumed to be less than the value
to be generated if the participant randomly guesses the answer to an item. On a test item, this value ranges between 0.0 and 1.0. An item is said to be good if the value of ci is no having 4 options for each test item, this is said to be good if the value of ci is not more than 0.25.
In a three-parameter logistics model, the ICC model is a rising monotonous curve, the more increasing the level of opportunity ability to answer, the well the item is. The shape of the ICC depends on the measurement model. The ICC presents a graph showing the chance of answering correctly on an item of participants with a certain level of ability
(Embretson dan Reise, 2000).
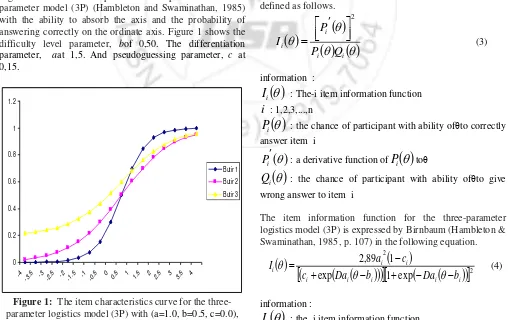
Figure 1 shows an example of an ICC plot for the three-parameter model (3P) (Hambleton and Swaminathan, 1985) with the ability to absorb the axis and the probability of answering correctly on the ordinate axis. Figure 1 shows the
difficulty level parameter, bof 0,50. The differentiation
parameter, aat 1,5. And pseudoguessing parameter, c at
Figure 1: The item characteristics curve for the
three-parameter logistics model (3P) with (a=1.0, b=0.5, c=0.0),
item 2 (a=0.5, b=0.5, c=0) and item 3 (a=0.0, b=0.5, c=0.2)
From the picture above, it can be concluded if the abilityscale
of the test participants is very low (θ = -4), the probability of
answering true point 3 of 0.2, while in point 1 and item 2
close to 0.0.In general, the difficulty level parameter has the
same scale as the ability level (
),with values ranging from-4.0 to +-4.0. In the ICC, the difficulty level parameter is a according to Hambleton and Murray (1983: 74); Hambleton and Swaminathan (1985) are less robust. This method is too sensitive to the sample size of participants and the level of significance. The simulations performed by Hambleton and Rovinelli in 1973 (Hambleton and Murray, 1983, p. 74) with large sample sizes tend to reject more items, whereas small sample sizes tend to accept more items.
2.5.Information Function of Item and Test
Item information functionis a method to explain the strength
of an item on the problem device and expresses the power or contribution of the item in uncovering the latent trail measured by the test. With the item information function can be known which items match the model so that it helps in the selection of items. Mathematically, the item information is defined as follows.
I
: The-i item information functioni
: 1,2,3,...,n
i
P
: the chance of participant with ability ofθto correctly answer item iThe item information function for the three-parameter logistics model (3P) is expressed by Birnbaum (Hambleton & Swaminathan, 1985, p. 107) in the following equation.
Volume 7 Issue 5, May 2018
i
a
: the-i differentiation index parameteri
b
: the-i difficulty level index parameteri
c
: the-i pseudoguessing index parametere
: natural number that reaches 2,718Based on the information function equation above, the information function fulfills the properties: (1) on the response of the logistics model item, the function of the item information is close to the maximum when the value
i
b
approaches θ. In the logistics model three parameters ofthe maximum value are reached when θ is located slightly
above
b
iand the index of the item guess rate ofc
idecreases;(2) the overall information function increases if the parameter
of differentiation power increases.
The function of the test information is the sum of the information functions of the test items (Hambleton & Swaminathan, 1985, p. 94). In this regard, the value of the test device information function will be high if the testers have high information functions as well. The function of test
device information of
I
i
can be mathematically definedas follows
n ii
I
I
1
(5)The values of the item parameter index and the participants' ability are the estimation result. Since it is the result of estimation, the truth is probabilistic and not released by error
measurement. In the item response theory, standard error
measurement (SEM) is closely related to the information function. The information function with SEM has a quadratic inverse relationship, the larger the information function the smaller the SEM or otherwise (Hambleton, Swaminathan, & Rogers, 1991, p. 94). If the value of the information function is expressed by
I
i
and the estimated value of the two relations, according to Hambleton, Swaminathan, & Rogers (199l: 94) is expressed by SEM as follow:
I
SEM
ˆ
1
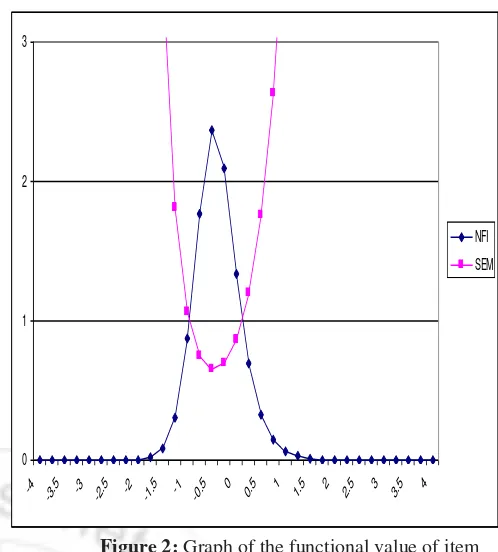
(6)For example, the following figure 2 shows graph on the value of the information function of the grain and the standard measurement error of anitem with parameters a = 2.0, b = -0.5 and c= 0.1
0 1 2 3
-4 -3
.5 -3 -2
.5 -2 -1
.5 -1 -0
.5 0
0.5 1 1.5 2 2.5 3 3.5 4 NFI
SEM
Figure 2: Graph of the functional value of item information and standard measurement error of an item with
parameters a = 2.0, b = -0.5 and c = 0.1
According to Wang & Vispoel (1998), there are three components that contribute to the quality of question banks, namely: (a) the size of the question bank; (b) item parameter; and (c) the content structure. The size of the question bank is minimally influenced by the length of the test and the size of the test participants. Urry (1997) suggests a ratio of 1 to 6 - 8 for the length of the test and the minimal number of items are in the question bank, meaning that if the length of the CAT test is designed as much as 20 questions then the items are about 120 to 160 questions. Bunderson, Inouye & Olsen (1989, p. 301) suggest that the size of the question bank for the purposes of CAT at least as much as 100 items. The item parameters according to Wang & Vispoel (1998) should have items with high power and uniform distributions (rectangulary) at each level of ability.
3.
The CAT procedure uses a triangular tree
method
3.1.Placement of question items in CAT using triangle tree method
The placement of the question items in CAT using the triangle tree method follows the following figure 3.
Volume 7 Issue 5, May 2018
3.2.The number of items in CAT using triangle treemethod
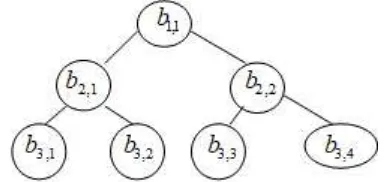
The main problem in CAT that uses triangle tree method is the level of TDT. Meaning, the number items in CAT that uses this triangle tree method depends on the used of TDT level. The illustration follows the following figure 4:
Figure 4: The illustration of items’ number in CAT using triangle tree method
The items’ number on every level in CAT is described in table 1 as follows.
Table 1: The items’ number on every level in CAT that uses triangle tree method
NO Level Items NO Level Items 1 Level - 1 1 11 Level - 11 78 2 Level - 2 3 12 Level - 12 91 3 Level - 3 6 13 Level - 13 105 4 Level - 4 10 14 Level - 14 120 5 Level - 5 15 15 Level - 15 136 6 Level - 6 21 16 Level - 16 153 7 Level - 7 28 17 Level - 17 171 8 Level - 8 45 18 Level - 18 190 9 Level - 9 55 19 Level -19 210 10 Level - 10 66 20 etc… etc… 3.3.The Starting Rule of Item Selection Procedure
In the initial item selection procedure, test takers will be given a set of questions that meet the test design specifications (grid) and it is usually according to the individual ability level. The test begins with queries that are not too difficult or not too easy. If there is no initial performance regarding the initial ability of the test participants then the CAT can be initiated by selecting moderate items (Mills, 1999, p. 123). This means that in the CAT for the initial selection, taken questions are not too difficult or not too easy (medium category) because for test participants with extreme ability, they will be not too long to reach the estimation ability. Each test participant answers the
question and the computer will give the ability score (θ). The
answer to the queries will determine the next displayed problem on screen. Each question answers correctly, test takers will be given a more difficult problem. Conversely, if the answer is wrong, the computer will choose an easier query.
The order of presented questions depends on the answers of the previous questions and on the test grid. In other words, the computer is programmed to provide the corresponding problem with the test grid, simultaneously it continuously searches for queries which level of difficulty matches the level of examinees' ability. In this case the examinee must answer all questions. The advantage, on each screen it will only display one item, so that test participants can concentrate to answer the problem. After answering the questions, examinees will not be able to repeat the previous questions and replace the answer. Selection of the starting
item in CAT using the triangle tree decision method in item selection during the test execution presented in Figure 5 below.
Figure 5: Selection of the starting item in CAT using the triangle decision tree method
3.4.The Selection Procedure Item During Test Execution Using Triangle Decision Tree Method
One of the important procedures in CAT is item selection during test execution. Selection procedure or item selection involves several stages of work. The simplest procedure includes two stages (Syaifudin Azwar, 2003: 55), namely: 1) The first stage, analysis and selection of items based on qualitative evaluation. This evaluation looks at: (a) is the item written in accordance with the blue-print and the indicator of the behavior to which it is expressed ?; (b) whether the item has been written in accordance with the correct rules of writing ?; and (c) if the written items still contain high social desirability ?.
2) The second stage is the item selection procedure based on the empirical data (data of test result items in the subject group whose characteristics are equivalent to the subject to be measured) by performing quantitative analysis of the item parameters. At this stage at least the selection of items based on different power, the level of difficulty of items and the level of guessing. One method to perform item selection procedures during a test run in a CAT based on the difficulty level of item (b), differentiation power (a) and guessing rate (c) is using a triangle decision tree method.
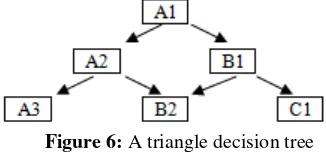
CAT that applies the triangle decision tree method in the item selection procedure during the test execution is using the IRT three-parameter model that consists of the degree of difficulty, differentiation, and guessing rate obtained and kept in a question bank (Phankokkruad, 2008, p. 656). A triangle decision tree is a graphical decision model. A loop showing the reverse test parameter of the branch indicates the target of the next test parameter. Each loop has only two branches, for a branch loop containing IRT three parameters. Branches that come out of the point have only two branches to the left and the branch to the right as well. The branch direction will go right when the test takers answer the question correctly and the branch direction will go to the left when the test taker answers wrong. Figure 6 below shows a decision triangle tree
Figure 6: A triangle decision tree
Volume 7 Issue 5, May 2018
Figure 7: The application of triangle decision treeBy the decision that the difficulty level (b) meets the The fitness function on each test item:
2
2
2w
= the level of differentiationc
a
= the –j level of differentiationi
where
f
iis the –i fitness functionm
m
F
F
1
(11)
is the difference of commulative fitness function between mand m-1. This fitness function is taken from the firness toward the test taker’s ability. If the response is wrong, the next question will be searched with minimumf
iand if theresponse is correct, the next question will be searched with maximum
.3.5.Procedure to End the Test (Stopping Rule)
The decision about when to stop the CAT test is the most important element. If the test is too short, then the estimate of the testers' ability is not accurate. If the test is too long, then a lot of time and cost is wasted and causes the test results to be invalid. The CAT test stops when: (a) the bank item has expired. This happens usually with a small size of item bank when each item has been given to all test takers; (b) all test items have been given. The maximum number of test items allowed to be given to the test taker is usually the same number of items as in the PP test; (c) the ability of test takers to a certain value θ (convergent), if the size is appropriate,
the test stops or the standard error difference used is ≤ 0.01,
(d) The minimum number of items has been given, (e) each
test competency has been done correctly, and (f) time has run out.
3.6.Estimation of Participants’ Abilities
The final step in CAT development is the estimation ability of test participants. One of the methods that can be used in finding the ability of test takers in a CAT is to use
theMaximum LikelihoodMethod (MLE)
When a test participant with a level of ability θ answers a test
containing as many as n multiple choice items with variable parameters (level of difficulty, differentiation power and guessing) that are already known and have been estimated previously, the joint opportunity of the test participants
is
p
U
1,
U
2,U
3....
U
n
. In practice the measurement ofu
1,
u
2,u
3....
u
nis the answer of the test participants.u
i=11 if the testee's answer is true and
u
i=0 if the testee's answeris wrong. If the assumption of local independence is met then
the maximum likelihood probability function is
Maximum Likelihood (MLE) method cannot estimate (Linden & Glas, 2003), so the appropriate method for finding the testers' capabilities is by applying the MLE.4.
Conclusion
CAT is a testing or evaluation method using adaptive information technology. The adaptive one means that the subsequent exam assignment depends on the conduct of the test participants in answering the previous question so that the exams given for each participant can be unique based on the level of ability of each participant. CAT that applies the triangle tree decision method in the item selection procedure during the test execution also uses the abilityfitness function. The CAT model inference system in selecting test items is able to provide that: (a) the test items given to each student vary according to their level of ability; (b) test items are given to students according to their level of ability; (c) students with high abilityobtain items with high difficulty level; (d) students with moderate ability obtain items with moderate difficulty; And (e) students with low ability to obtain items with low difficulty level.
Volume 7 Issue 5, May 2018
test item with a moderate degree of difficulty. The procedure for selecting test items during test execution in CAT is based on the answer pattern of the test participants used as the rules for determining the next test item. Procedure of item selection during test execution uses decision tree triangle method, procedure for ending test, up to estimation ability of
test participant usesmaximum likelihood method (MLE).
References
[1] Aiken, L.R. Psychological testingand assessment
(
8
thed.). Boston: Allyn and Bacon. 1994[2] Allen, M.J. & Yen, W.M. Introductions to measurement
theory. Belmont, CA: Wadsworth, Inc. 1979
[3] Anastasi. A. & Urbina, S. Psycoholological testing. (
7
thed.). New Jersey: Prentice-Hall, Inc. 1997[4] Bejar, I.I. Introduction to item response theory and their assumptions. Hambleton, Ronald K. (Editor).
Applications of Item Response Theory. Canada:
Educational Research Institute of British Columbia. 1983
[5] Borg, W.R. & Gall, M.D. Education research an
introduction. New York: Von Hoffman Press, Inc. 2003
[6] Crocker, L. & Algina, J. Introduction to classical and
modern test, theory. Florida: Holt, Rinehart and
Winston, Inc. 1986
[7] Djemari Mardapi. Teknik penyusunan instrumen tes dan
nontes. Yogyakarta: Mitra Cendikia Press. 2008
[8] Haladyna, T.M., Downing, S. M., & Rodrigues, C. A review of multiple choice item-writing guidelines for classroom assesment. Applied Measurement in
Education, 15, 309-334. 2002
[9] Hambleton, R.K. & Swaminathan, H. & Rogers, H.J.
Fundamental of item response theory. Newbury Park,
CA: Sage Publication Inc. 1991
[10]Hambleton, R.K. & Swaminathan, H. Item response
theory. Boston, MA: Kluwer Inc. 1985
[11]Hambleton, R.K. & Linden, W.J. Handbook of
modernitem response theory. Springer, New York:
Edwards Brothers Inc. 1997
[12]Hopkins, K.D., Stanley, J.C., & Hopkins, B.R.
Educational and psychological measurement and
evaluation. (
7
thed.). Ney Jersey: Prentice Hall. 1990[13]Hullin, C.L., et.al. Item response theory: Application to
psichologycal measurement. Homewood, IL : Dow
Jones-Irwin. 1983
[14]Kendall, K.E., & Kendall, J.E. Systems analysis and
design
5
thed
.
. Englewood Cliffs: Prentice HallInternational, Inc. 2002
[15]Linn, R.L. & Gronlund, N.E. Measurement and
assessment in teaching (
7
thed.). Ohio: Merrill, animmprint of Prentice Hall. 1995
[16]Lord, F.M. Applications of item response theory to
practical testing problems, Hillsdale, NJ : Erlbaum.
1980
[17]Masters, N.G. & Keeves, P.J. Advances in measurement
in educational research and assesment. New York:
Pergamon Press. 1999
[18]Mills, C.N. Development and introduction of a computere adaptive graduate record examinations
general test. In F. Drasgow & J.B. Olson-Buchanan (Eds), Innovations in Computerized Assesment (pp. 117-136). Marwah, NJ: Lawrence Earlbaum Associates Publishers. 1999
[19]McDonald, R.P. Test theory: A unified treatment. Mahwah, NJ: Lawrence Elrbaum. 1999
[20]Mehrens, W.A. & Lehmann, I.J. Measurement and
evaluation in education and psychology. New York :
Hold, Rinehart and Wiston, Inc. 1973
[21]Millman, J. & Greene, J. The spesification and development of tests of achievement and ability in Robert L. Lin (Editor). Educational Measurement
(
3
thed.). Phoenix: American Council on Education, Series on Higher Education Oryx Press1993[22]Murshel, J.L. Successfull teaching, its psychological
principles. New York: Mc. Graw Hill Book Company
Inc. 1954
[23]Nitko, A.J. Educational assessment of students. (
2
nded). Ohio: Merrill an imprint of Prentice Hall Englewood Cliffs. 1996[24]Nunally, J.C. Psychometric theory. (
2
nded). New Delhi: Tata McGrawHill Publishing Company Limited. 1978[25]Phankokkruad, M. & Woraratpanya, K. An automated decision system for computer adaptive testing using genetic algorithms. Ninth ACIS International Conference on Engineering, Artificial Intellegence,
Networking, and Parallel. 2008
[26]Popham, W.J. Classroom assesment: what teachers need
to know. Boston: Allyn and Bacon. 1995
[27]Reckase, M.D. Item pool design for computerized adaptive testing. Annual meeting of the national council
of measurement in education, Chicago, IL, April 2003.
2003
[28]Rolston, D.W. Principles of artificial intelligence and
expert systems development. Singapore: McGraw Hill
Book, Co. 1988
[29]Van der Linden, W.J., Ariel, A., & Veldkamp, B.P. Assembling a computerized adaptive testing item pool as a set of linear tests.Journal of Educational Behavioral
Statistics, 31, 81 – 99. 2006
[30]Van der Linden, W.J., & Glas, C.A. Computerized
adaptive testing theory and practice. Dordrecht: Kluwer
Academic Publishers2003
[31]Van der Linden, W.J., & Veldkamp, B.P. Contraining item exposure in computerized adaptive testing. Journal
of Educational and Behavioral Statistics, 29, 273. 2004
[32]Wainer, H. Computerized adaptive testing : A primer. Hillsdale, NJ: Lawrence Erlbaum Associates, Publisher. 1990
[33]Walpole, R.E., Mers, R.H., Myers, S.L. et al. Probability
and statistics for engineers and scientists. Upper Saddle
River, NJ: Prentice Hall. 2002
[34]Wang, T. & Vispoel, W.P. Properties of ability estimation methods in computerized adaptive testing.
Journal of Educational Measurement, 2, 109-130. 1998
[35]Weiss, D.J. Computerized adaptive testing for effective and efficient measurement in counseling and education.
Measurement and Evaluation in Counseling and
Volume 7 Issue 5, May 2018
[36]Weinberg G.M. & Geller. Computer informationsystems, an introduction to data processing. USA: Little
Brown & Company. Ltd. 1985