This working paper is made available by the Fisheries Centre, University of British
Columbia, Vancouver, BC, V6T 1Z4, Canada.
Fisheries Centre
The University of British Columbia
Working Paper Series
Working Paper #2014 - 05
Beyond the unseen: a �irst collaborative model
towards estimating illegal, unreported, and unregulated
catches off Senegal
Dyhia Belhabib, Viviane Koutob, Vicky Lam,
Christopher Mathews, Najih Lazar, Vaque Ndiaye,
James Tobey and Daniel Pauly
Year: 2014
1
Beyond the unseen: a first collaborative model towards estimating illegal, unreported, and unregulated catches off Senegal
Dyhia Belhabiba, Viviane Koutobb, Vicky Lama, Christopher Mathewsc, Najih Lazard,
Vaque Ndiayec, James Tobeye and Daniel Paulya
aSea around Us Project
Fisheries Centre, 2202 Main Mall, Vancouver BC Canada
bCité Djily Mbaye/Yoff, Dakar, Senegal
cUSAID/COMFISH
Cité Djily Mbaye/Yoff, Dakar, Senegal
dThe University of Rhode Island, Department of Fisheries, CELS, Kingston, RI
02881
eCoastal Resource Center, Graduate School of Oceanography, University of Rhode
Island, Narragansett, RI 02882
ABSTRACT
The marine waters of Senegal are very productive, and thus fisheries have become importance to the economy and food security of local populations in Senegal. Also, Senegalese fisheries resources are exploited by a number of Distant-Water Fleets, both legal (mostly reflagged to Senegal) and illegal. Illegal, Unreported and Unregulated (IUU) fisheries in Senegal, however, have never been formally estimated, nor examined from a historical perspective. Herein, IUU catches along the Senegalese coast between 1999 and 2011 were estimated for the first time at 2.6 million t. Legal catches by the industrial fleets reflagged to Senegal accounted for 1.7 million t between 1999 and 2011, three times the landings reported in the official
reports of the Senegalese ‘Départment des Pêches Maritimes’, and are presently
stagnating. Illegal fisheries, on the other hand, which totalled an estimated catch of 714,000 t from 1996 to
2011, are steadily
increasing. This increasing trend, besides implying a huge loss of potential revenue, threatens the food
security of local
populations in West Africa, many of them heavily
relying on Senegalese
seafood as a primary
source of animal protein.
INTRODUCTION
Senegal is located in
Northwest Africa (Figure 1), and borders Mauritania from the North, Guinea
2
Bissau and The Gambia from the South, and the islands of Cape Verde from the west. Senegal has one of the most important artisanal fleets of West Africa, with around
20,000 pirogues. Similarly, this country’s Exclusive Economic Zone (EEZ) is one of
the most exploited in West Africa in terms of industrial fishing, both by foreign fleets, and fleets reflagged to Senegal. Senegalese fisheries generate over 280 million $US annually, and provide jobs for one out of six Senegalese (Greenpeace 2012). Indeed,
the large EEZ (159,000 km2), including highly productive waters enriched by a
seasonally strong upwelling, and an ever-increasing international demand for seafood have attracted the Distant-Water of several countries, operating under different kinds of access agreements, or simply operating without authorization from Senegalese authorities, i.e., illegally. Not surprisingly, when such operations are coupled with a poor monitoring capacity by the host country, including an inability to regulate quotas (Pramod and Pitcher 2006), it is difficult to assess the impact of these fleets on local stocks and economy. However, there are hints which help understand the dynamics and the extent of this impact. In 50 years, the number of legal industrial vessels grew by a factor of 22 from 1960 to the late 1990s, then
decreased to a third in less than 10 years (Bonfil et al. 1998; DPM 2011), while still
remaining very high. More recently, after 1996, observers were no longer admitted onboard Senegalese flagged vessels (Pramod and Pitcher 2006), which has most
likely encouraged reflagging practices, and the ‘senegalization’ of fishing access
agreements, under which observers were mandatory, to joint venture reflagging (Niasse and Seck 2011). Lack of observers generally produces unreliable catch data, especially when these vessels often land their catches in countries others than the ones in which they fish (Pramod and Pitcher 2006). Evidence of illegal practices by these vessels (UNEP 2004) supports the suggestion that relying only on a catch inspection scheme is not very effective. Indeed, some authors concluded that even with observers onboard, the Senegalese authorities struggled to ensure effective control of legal foreign fleets, including those from EU countries (Kaczynski and Fluharty 2002; Witbooi 2008).
While the legal foreign fishery has declined in the last 20 years (i.e., Russian vessels were asked to leave and EU-Senegal agreements cancelled), continued over-exploitation of the Senegalese fishery resources, all the way to the commercial extinction of some species (Pramod and Pitcher 2006) suggests high, and increasing unrecorded catches by foreign vessels. Numerous accounts by fishers and official reports document illegal vessels of different origins (Vidal 2012). Illegal fishing and unregulated fishing by legal industrial reflagged fleets are known to compete with the artisanal fisheries (Vidal 2012), and thus create conflicts with the local population.
Thus, the problem is that, in one hand, Senegal is reflagging foreign vessels called
`charters’, which have a majority Senegalese ownership that is often nominal (Niasse and Seck 2011), while, on the other hand, Senegal owns a huge domestic artisanal fleet, which ought to be reduced because of overcapacity (Ferraro and Brans 2009). Frequent incursion by industrial fishing vessels into designated artisanal fishing
zones and a large number of artisanal pirogues fishing beyond the limits of these
legally established zones (Deme and Dioh 1994; Diallo 1995; Binet et al. 2012)
3
artisanal fleet, while Senegalese fishers are increasingly dependent on the resources in these neighboring countries for their catches (Niasse and Seck 2011).
Under these conditions, and given the possible impacts of illegal and unregulated activities in Senegalese waters, it is justified to estimate Senegalese illegal and unreported catches, instead of simply assuming them to be low (MRAG 2005; Pramod and Pitcher 2006).
METHODS
In the present work, we attempt to quantify the catch (including discards) of illegal fishing (i.e., by unauthorized foreign vessels), and unregulated and unreported fishing by domestic industrial fleets suspected of regular transhipping. First, we estimated the catch per unit of effort (CPUE) per vessel, by country (or region) of origin of the fleet. Then, using the estimated number of vessels in operations (illegal and legal), we estimated the illegal catch and the unreported unregulated catch by the fleets authorized to operate in Senegal. Discards were then estimated for each fleet segment.
Catch per Unit of Effort (CPUE)
We conducted a survey from the August 22 to September 5, 2012 at the most important fishing and landing harbour in Senegal (Dakar), where most industrial vessels land their catches. Twenty-five skippers representing a quarter of the fleet were randomly selected and interviewed under promise of anonymity. The sample covers vessels fishing in all industrial fishing zones of Senegal (North, South and Central Senegal) and the major targeted sectors, i.e., tuna, other fish and shrimp. These surveys had four major goals, i.e., to (1) identify issues around illegal fishing (2) identify the frequency of illegal activities observed by the skippers while at sea; (3) analyze the real (i.e., beneficial) ownership of the vessels via the nationality of the crew and/or skipper and (4) estimate catch per unit of effort (Appendix table A1).
On the other hand, the average daily catch was estimated at 50 t∙vessel-1 based on
reported landings and the number of days for the Russian vessels during the pelagic
campaign 2011-2012, surveyed by the Direction de la Surveillance et de la protection
de la pêche (DPSP, Department of surveillance and protection of fisheries) (Appendix table A1).
The first step in estimating the CPUE was to determine the unit of effort. Since the effort description for illegal vessels is rarely available, we used the list of licensed
vessels in Senegal from (www.dpm.sgn [2013]; www.dpsp.sn [2013]) to analyze the
profile of vessels operating off Senegal.
We searched for the registration number of each vessel and/or the name in the online
databases www.maritime-connector.com [2013], www.marinetraffic.com [2013],
www.vesselfinder.com [2013] and www.grosstonnage.com [2013], and search for the last reported owner (by default the seat of the company managing the vessel), the
former flag history and the GRT of each vessel documented. Based on each vessel’s
4
operating in Senegalese waters. Indeed, in Senegal, most industrial vessels over 20 m are of foreign origin operating under joint ventures, reflagged, or operating under access agreements. We identified six categories based on their inferred origin and GRT, and estimated the average GRT for each category by dividing the sum of the GRT for each category by the number of vessels from the same category (Table 1).
Herein, the CPUE is calculated as the daily catch for each unit of capacity (in t∙GRT
-1∙day-1∙vessel-1) that characterizes vessels from each fleet (by origin, Table 1). As
suggested by Goffinet (1992) and Johnstone (1996), this measure is appropriate if we assume that fishing vessels would always tend to maximize their catch. The second step was then to establish an optimal CPUE using a Monte-Carlo method. The Monte-Carlo method allows generating the solution (herein the optimal CPUE), many times (10,000 times) by randomly choosing values from the probability distribution of the parameters, here ranging between a predefined maximal and minimal CPUE. The result is an optimal CPUE and an estimate of the uncertainty associated to it (Pauly et al. 2013).
Minimal CPUE
Herein it is reasonable to assume that the minimal CPUE would be that whose
estimation is based on the officially reported catch, i.e., 50 t∙vessel-1∙day-1 for Russian
vessels of an average GRT of 6,560 (Table 1). Therefore by dividing the daily catch by
the average GRT, we obtained a CPUE of 7.6 kg∙GRT-1∙day-1∙vessel-1 set as a minimum
in the Monte-Carlo model.
Maximal CPUE
Maximal CPUE is a difficult parameter to estimate as it sets the upper limit of unreported catches; therefore, it was based on several sources. While reported landings represent the portion of the catch declared by each vessel, Greenpeace (2012) reported that the catch by foreign (e.g., Russian) vessels could be as high as
250 t∙day-1. The CPUE was then calculated at 38.1 kg∙GRT-1∙day-1∙vessel-1. On the
other hand, demersal Chinese vessels catch around 1,200 t∙year-1∙vessel-1 for a GRT of
308 and 313 fishing trips (DPSP 2012), i.e., 12.44 kg∙GRT-1∙day-1∙vessel-1. Finally, ter
Hofstede and Dickey-Collas (2006) observed a daily catch of 102.32 t∙ ∙day-1∙vessel-1
onboard Dutch pelagic trawlers for a GRT of 6,534, i.e., 15.65 kg∙GRT-1∙day-1∙vessel-1.
We averaged the three estimates and obtained a maximal CPUE of 22.06 kg∙GRT
-1∙day-1∙vessel-1.
With a CPUE of 7.6 kg∙GRT-1∙day-1∙vessel-1 as lower bound and a CPUE of 22.06
kg∙GRT-1∙day-1∙vessel-1 as upper bound, the Monte-Carlo method allowed estimation
to estimation of an optimal CPUE of 14.78 kg∙GRT-1∙day-1∙vessel-1 ± 4.2.
We obtained to total daily CPUE by multiplying the CPUE per GRT by the average
GRT for each fleet segment, where the ‘segments’ are the country of origin of the
5
Table 1. Suspected origin of vessels operating in Senegal including the domestic and foreign fleets, their average GRT and the corresponding CPUE for 2011.
Origin Number of vesselsa Average GRT per Vessel CPUE
(t∙vessel-1∙ day-1)
Western Europe 39 240 ± 27.12 03.64
Senegal 18 180 ± 29.86 02.74
Russia 00b 6,560 ± 1439.64 96.98
China 14 308 ± 21.97 04.55
Africa and FOC 02 225 03.33
a) Only vessels whose flag we could identify were taken into consideration, i.e., 66% of the so-called Senegalese fleet;
b) Although absent in the actual datasets of the Département des pêches maritimes (DPM, Department of fisheries), the need to establish a GRT profile to estimate past catches of Russian vessels in herein highlighted.
Estimation of the Illegal effort and illegal catches
Illegal fishing, defined as a crime by INTERPOL (2010), is a fishing activity conducted in waters under a national jurisdiction, but for which a foreign vessel does not hold an authorisation of any kind. This, in the present study, would exclude any activities by domestic and authorized fleets that would be considered illegal under Senegalese law (fishing with un-authorized gear, fishing in prohibited zones etc. by the authorized fleets), these activities are rather considered unregulated. Also, catches of the domestic industrial fleet under 20 m would be already included in the statistics.
Illegal fishing effort in Senegalese waters is mostly occurring in form of incursions by foreign vessels legally or illegally operating in the waters of neighbouring countries (e.g., Russian vessels authorized to fish in Mauritania and operating illegally in Senegal from December to May, i.e. 150 days, which correspond to the North-South
migration of Sardinella spp. and other small pelagics (Deme et al. 2012). Thus,
vessels from Russia, Belize (FoC) and Panama (FoC) perform their incursions into Senegalese waters from the north (i.e., Mauritania), while Japanese, Chinese and Korean vessels, and from other FoC and European countries do this from the south (Gaudin and Groupement GOPA consultants 2011) , where monitoring and control are absent for 305 days per year. Their GRT varies from 1,000 to 7,000 GRT (Gaudin and Groupement GOPA consultants 2011).
A list of these suspected vessels along with their origin was established through direct inspections and observations by the DPSP during the 2012 African Maritime Law
Enforcement Partnership (AMLEP) operation from June 16th to July 07th, as well as a
direct survey addressed to vessel owners alluded above, and summarized in Table 2.
Table 2. Number of suspected/ illegal vessels per flag of origin.
Flag Russia Europe FoCa Total
Observed vessels 9 7 20 36
Percentage (%) 25 19 56 100
a) Mainly Chinese vessels based in Guinea-Bissau and Guinea (Anon. 2013).
6
Jawara, Operation Manager, DPSP, per. comm.), we estimated a total of 60 incursions by different vessels per year. We allocated these vessels per flag of origin using the percentage of incursions per flag (Table 2) and identified a more realistic number of vessels responsible for illegal fishing in the Senegalese EEZ. We multiplied the percentage of contribution of each flag (Table 2) by the total number of vessels (60) and, using the estimated the number of vessels per country per origin (Table 3), we multiplied the CPUE per day by the number of days, then by the number of vessels, and thus obtained the total illegal catch for 2011, by country.
Change through time
The percentage of illegal fishing over total fishing activities was estimated for different years by different sources (Table 4). MRAG (2005) estimated IUU fishing activities in Senegal to be 8% of the total catch, while Kelleher (2002) estimated the total number of infractions to be 1% of the total fishing activities in 1996, 4% in 2000, and 9% in 2001. Although the latter observations were based on aerial surveys, these were occasional (due to limited funding) and covered only a small time period, and therefore could not be used here. On the other hand, data by the DPSP, shows the number of observed vessels involved in illegal activities, and the number of vessels licensed to fish within Senegalese waters, which allowed estimating the fraction f illegal activities over total fishing activities as a proxy to illegal fishing in Senegal from 2002 to 2011 (Table 4).
When numbers were inconsistent (e.g., when the same vessels were inspected and/or arrested several times, which leads to the number of inspections being lower than the number of vessels arrested), they were replaced by another proxy. Thus, for example, when the ratio vessel arrested/vessel inspected was not available, we used the ratio vessel arrested over the total number of authorized vessels. Based on this, we estimated the change in illegal fishing (Vi)from year (t+1) to year (t) using the formula: Vi = [(Illegalt+1-Illegalt)/Illegalt] x 100%. We then applied this variation to
illegal catches in 2011, 2011 being the baseline, backwards and obtained a time-series for illegal and unreported catches from 2000 to present.
Unreported catches by industrial fleets flagged to Senegal
Three transhipments of catches in the Senegalese EEZ were observed over a period of two weeks during the AMLEP surveys, which illustrates the extent of these operations. These transhipments were conducted by vessels authorized to fish in Senegalese waters, and thus it is reasonable to assume that transhipped catches were from the Senegalese EEZ.
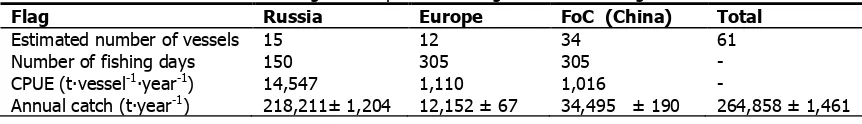
Table 3. Estimation of the annual illegal catch per vessel origin from the Senegalese waters in 2011.
Flag Russia Europe FoC (China) Total
Estimated number of vessels 15 12 34 61
Number of fishing days 150 305 305 -
CPUE (t∙vessel-1∙year-1) 14,547 1,110 1,016 -
Annual catch (t∙year-1
7
Table 4. Historical variation of illegal fishing in the waters of Senegal from 1996 and 2011 from DPSP and Senegalese Navy, (unpub. data.).
b) The number of inspected vessels was higher than the arrests, and thus was not used.
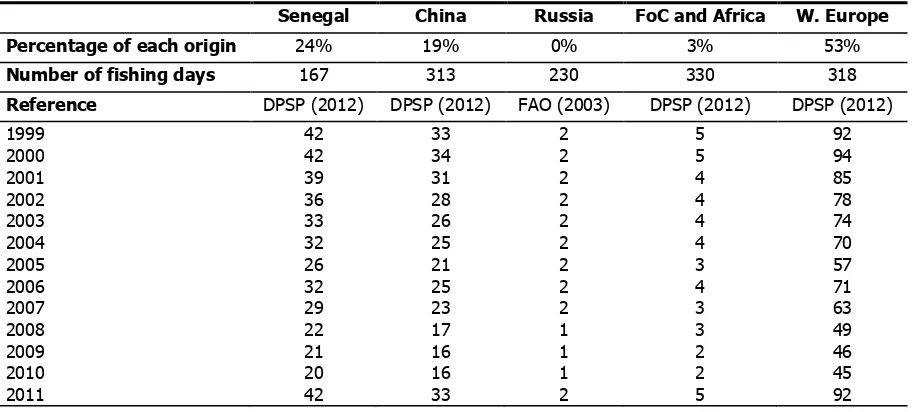
To estimate the segment of catches unreported under transhipments, we used the previous CPUE estimates per GRT per vessel per country of origin (Table 1), the number of fishing days per country of origin and the number of industrial vessels authorized to operate in Senegal from the DPM and DPSP reports (Table 5).
In the present study, only the vessels for which information could be found in the vessel databases cited above could be identified and taken into consideration, i.e., 73 over a total of 113 vessels with a Senegalese flag (65%). We further investigated the origin of some vessels; for example, using the databases mentioned above, we could identify only 5 Chinese vessels reflagged to Senegal, whereas other references (MEGAPESCA 2003; Auregan 2007; Mallory 2012; Vidal 2012) identified the
Senegalese Sénégal Pêcheas a subsidiary of China’s National Fisheries Corporation,
the largest fishing company in Senegal, which owns 12 to 14 industrial trawlers. Therefore, since the rest of the fleet is considered Senegalese, and their landings were not re-estimated, our estimate is likely conservative.
Table 5. Origin of vessels disaggregation per year.
8
Discards
Discards by the industrial sector in West Africa are high. This is particularly true for Senegal, especially by the demersal sectors (Emanuelsson 2008). In Senegal, the two main industrial fishing sectors generate relatively large amount of discards. These are documented in the literature as percentage of the total catch, i.e., total catch = landed catch + discards.
Demersal trawl discards
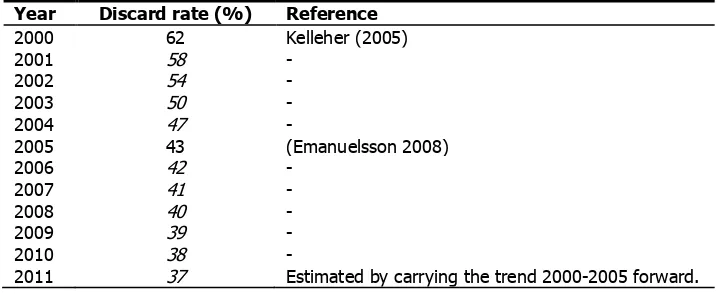
Kelleher (2005) estimated Senegalese demersal trawl discards at 62% of total catches for 2000, which means the discarded catch was 1.6 times the landed catch. Emanuelsson (2008) estimated discards at 43% of total catches for 2005, i.e., discarded catches were equivalent to 74% of landed catches (Table 6). Emanuelsson (2008) suggested that discards were decreasing because of increasing retention of the bycatch. Thus, we extrapolated the trend from 2000-2005 to 2011 and estimated a discard rate of 37% in 2011 (when discards were equivalent to 62% of landed catches). We then interpolated linearly discard rates per year to bridge the anchor points (Table 6).
Table 6. Discard rate and contribution of the demersal trawl sector to total catches. Interpolations are italicized.
Year Discard rate (%) Reference
2000 62 Kelleher (2005)
2001 58 -
2002 54 -
2003 50 -
2004 47 -
2005 43 (Emanuelsson 2008)
2006 42 -
2007 41 -
2008 40 -
2009 39 -
2010 38 -
2011 37 Estimated by carrying the trend 2000-2005 forward.
Assuming that illegal operation generate the same amount of bycatch, we multiplied the illegal demersal illegal catches (i.e., the illegal catches of the EU fleets) by the estimated discard rates, and thus obtained the discards of the illegal demersal fleet.
Similarly, we multiplied our estimated discard rates by the annual catch of the domestic demersal trawler fleet. (The domestic demersal fleet is not really Senegalese; most of the Senegalese vessels are small-pelagic purse seiners).
Pelagic trawl discards
To estimate pelagic trawl discards, we used the discard rate provided by ter Hofstede and Dickey-Collas (2006) for pelagic Dutch trawlers in Mauritania, which is based on
at-sea observations, i.e., 11% of the total pelagic catch of European pilchard (Sardina
pilchardus), jack and horse mackerels (Trachurus spp.) and sardinella (Sardinella
9
from Mauritania (see above). Therefore, we applied the previous discard rate by 94.6% of the pelagic trawl catch, 94.6% being the percentages of the contribution of European pilchard, jack and horse mackerels and sardinella to total catches (ter Hofstede and Dickey-Collas 2006).
Discards of the Senegalese purse-seine fleet, which target small pelagic fishes are considered negligible (Moustapha Deme, CRODT, pers. comm.), and therefore not considered here. Furthermore, on-site observations indicate that, as is the tradition in West Africa, these vessels increasingly sell their low-commercial value bycatch to artisanal fishers.
Sensitivity analysis of illegal catches
Given the furtive nature of illegal fishing, and the assumptions that are involved in its quantification, a sensitivity analysis is conducted here to gain insights into which of these assumptions are most critical, and how they affect the total estimated illegal catch. The CPUE estimated here is optimized based on a robust Monte-Carlo model that re-estimated the latter 10,000 times, which at the end resulted in a reasonable CPUE that fits observations and trends in the literature (e.g. Caverivière and Rabarison Andriamirado 1988). Similarly, the GRT estimated is based on observed effort data collected from different sources. Consequently, the two parameters that draw our attention were the number of fishing days and the number of incursions, i.e., vessels per month. While the latter (5) is based on the observations of the DPSP over 15 days of monitoring, it is reasonable to assume that the minimum number of incursion would not be lower than 4 vessels per month (-20%), as incursions are observed frequently, and over 6 vessels per month (+20%).
We also set the number of days at a minimum of -40% the current value and a maximum of +10% the current value. The number of days cannot be higher, as this would imply that illegal vessels operate all year long in Senegal. The number of days can hardly be lower than the minimum value set for the sensitivity analysis, given that pelagic trawl vessels (for example) follow migrations of small pelagic fish, which implies that their presence in the neighbouring countries would be economically beneficial only if (a) these vessels stopped operating during the time period where fish is migrating south, or (b) their fishing activity continues in the south (i.e., Senegal). These scenarios allow assessing the effect of two variable on illegal catches (Table 7).
Table 7. Parameter changes used in the Sensitivity Analysis.
10 Results
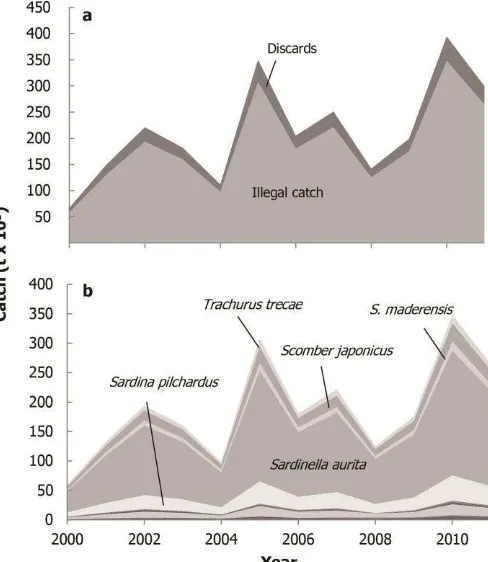
Illegal catches
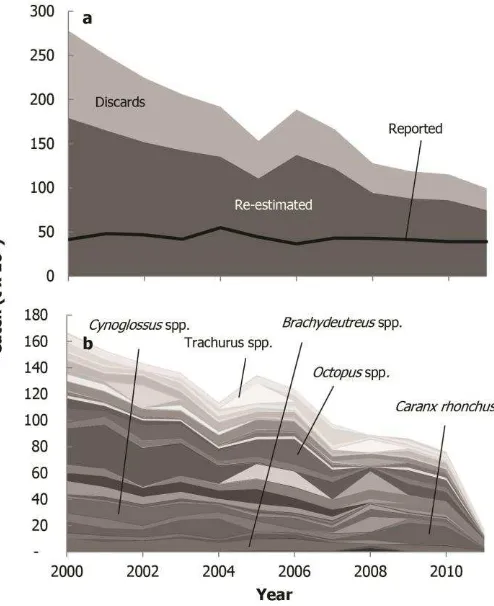
Illegal catches and their corresponding discards were estimated at around 2.6 million tonnes in the period from 2000 to 2011. Illegal catches increased by a factor of 5, after the cancellation of Senegal-Russia agreements in 1999, from about 67,000
t∙year-1 in 2000 (of which
8,400 t∙year-1 were discarded)
to 400,000 t∙year-1 in 2010
(of which 46,000 were
discarded).
Illegal catches declined in 2011 by around 100,000
t∙year-1, after the
re-authorization of Russian
vessels (Figure 2a).
Of over 170 taxa identified in
Senegalese catches (DPM 1999-2011), catches of sardinella, European pilchard and mackerels dominate illegal catches with over 2 million tonnes between 2000 and
2011, i.e., 39,000 t∙year-1 annually (Figure 2b).
Domestic industrial catches by the fleet (re-)flagged to Senegal
Industrial catches by the fleet flagged or reflagged to Senegal were estimated at 1.5 million tonnes between 2000 and 2011, compared to 572,000 t in official reports of the DPM during the same period, i.e., 1 million tonnes went unreported. Catches
decreased overall from around 179,000 t∙year-1 in 2000 to a minimum of 75,000
t∙year-1 in 2011 (Figure 3a). Re-estimated landed catches were herein twice to 4 times
the reported catches to the DPM (Figure 3a). However, the under-reported component was higher in the early 2000s, when the re-estimated catch was over 3 times the reported catch on average, and decreased gradually to less than 2.2 times the reported catch in the late 2000s, which implies improvement in reporting (Figure 3a).
Discards on the other hand, were estimated at 633,000 tonnes between 2000 and 2011, which is the equivalent of 42% of the industrial retained catch by the fleet flying the Senegalese flag. Discards show a declining trend overall between 2000 and 2011
from 100,000 t∙year-1 to 25,000 t∙year-1 respectively, which is also applies when
comparing the rate of discards, 55% of retained catches in 2000, with that in 2011, i.e., 14% (Figure 3a).
11
The retained catch includes many taxa; however, demersal
compared to 305,000 tonnes by the illegal fleets (Figure 4).
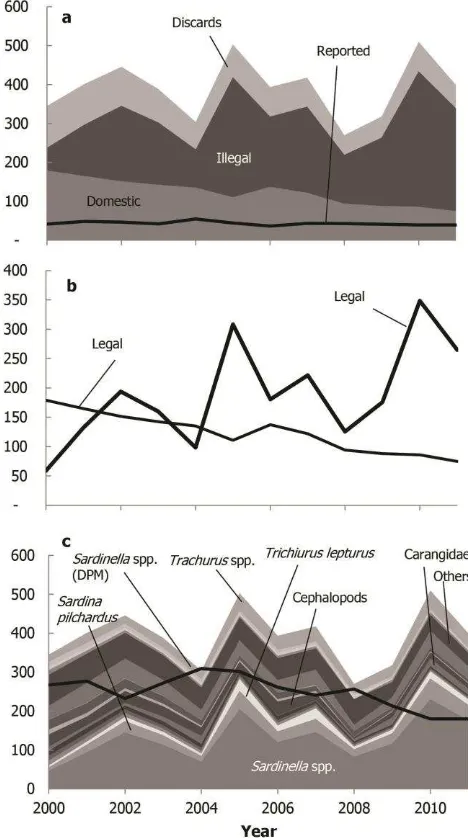
Total illegal unreported unregulated catches
Total IUU catches, i.e. the sum of illegal catches, unreported catches by the fleet reflagged to Senegal and discards, totalled 4.2 million tonnes between 2000 and 2011. Although IUU catches remained relatively constant over time (Figure 5a), illegal catches are shown to increase in contrast with catches by the legal fleet flying the Senegalese flag (Figure 5b).
Figure 3. Estimated total catches by the legal domestic fleet of foreign origin from the Senegalese waters and their corresponding discards a) compared to the industrial landing data supplied by DPM, and b) by taxon, 1999-2011.
12 catches, while the remaining 66% of the catch consisted a large number of taxa (Figure 5c).
Illegal industrial catches of
sardinella were earlier
showed that illegal catches are impacted strongly by the
estimated number of
incursions, but not the
number of days these
incursions last. The scenario of Table 7 that drove illegal Total illegal, unreported unregulated industrial catches; b) Comparison of legal and illegal catches; c) Comparison of the illegal catch with artisanal reconstructed catches of sardinella estimated by Belhabib et al. (2013), 2000-2011.
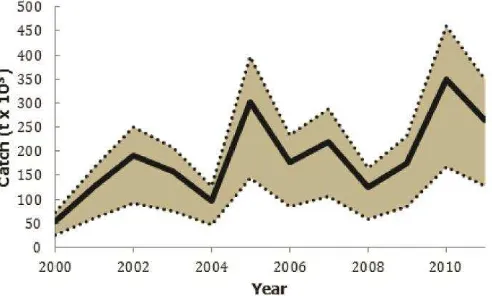
Figure 6. Total catches from the Senegalese waters, 1950-2010. The maximum sustainable yield (450,000 to 600,000 t∙year-1)
13
days. In contrast, catches were at a minimum of 127,000
t∙year-1 when the number of
incursions was lowered by 20% (to 4 incursions monthly) and the number of days was lowered by 40% (Figure 7).
This scenario, although
possible, is unlikely, given the low monitoring intensity in
Senegalese waters, fish
migrations which provides a
good incentive for large
pelagic trawl vessels to follow them, and a large almost entirely unmonitored continental shelf along with relatively high abundance compared to the southern neighbours of Senegal
Value of Illegal Unreported and Unregulated catches
Total industrial catches in Senegal and the discards generated were estimated at
412,000 t∙year-1 in 2011, which when multiplied by the ex-vessel price of catches (on
average) estimated at
366 CFAFr/kg (DPM, 2010)
1would land a total value of $300
million US annually. Illegal catches alone were worth $194 million US ranging
between at least $93 million US and $256 million US. The value of the transhipped
catch and that of foreign flagged vessels was around $33 million US.
DISCUSSION
This work is the first attempt to estimate the IUU catches by industrial fishing fleets in Senegalese water and their temporal variation, and the countries of origin of the
fleets in question. This illegal catches were estimated at around 350,000 t∙year-1 on
average caught by both the illegal fleets and the legal fleet of foreign origin reflagged
to Senegal, compared to official figures of 44,000 t∙year-1 on average during the
2000-2011 time period. When total removals are considered (including both the artisanal and industrial sectors), catches are dangerously above the potential yield estimated for Senegal (CRODT 2001). This endangers not only the already over-exploited stocks of Senegal (Diallo 2000), but also imperils an entire fisheries-based sector of the economy. This is particularly true for the artisanal sector, whose fishing ground overlaps the areas frequented by illegal industrial fishing vessels (Niasse and Seck 2011).
It is evident that the increase in illegal fishing is strongly related to the decrease in the number of vessels of foreign origin authorized to fish in Senegal. This suggests that the fleet formerly authorized to fish in Senegal, and which transferred parts of their operation to neighbouring countries (mainly Mauritania, The Gambia and Guinea-Bissau), also converted itself into an illegal fleet operating in Senegalese
1 We used a conversion where
1000 francs CFA = $ 2.25 US.
14
waters. On the other hand, the increase in illegal catches demonstrates the limited capacity for adequate control and monitoring along the Senegalese coast.
The assumptions made herein, and our estimates of illegal catches, are conservative for many reasons, notably because we did not consider numerous undocumented Chinese, Korean and Japanese vessels operating illegally in Senegalese waters. Secondly, the 2010 profile of fishing vessels likely underestimated unreported catches by the reflagged fleet, since vessels reflagged to Senegal in the past (before the expiration of the EU-Senegal fishing agreement in 2006) originated in countries outside of the EU, which would have contributed to the under-estimation of mean GRT and therefore CPUEs. Furthermore, the baseline CPUE used in the present
study was conservative. For example, it generated a CPUE of 1,100 t∙vessel-1∙year-1 for the fleet of Chinese origin, while other estimates using the Monte-Carlo method
estimated the average Chinese CPUE in West Africa at 1,252 t∙vessel-1∙year-1 for the demersal fleet showed higher a higher CPUE for the Chinese demersal trawl fleet (Pauly et al. 2013).
The high value of industrial illegal and unreported industrial catches estimated here at around $300 million US annually would justify a rethinking of the monitoring policies of Senegal, which should aim at recovering at least a fraction of these $ 300 million US per year.
The present study highlights the clear conflict between the industrial fleet and the artisanal fleet in Senegalese waters, notably as if affects the species most targeted by the illegal fleets, i.e., sardinella. This, along with increasing artisanal catches from
outside Senegal (Belhabib et al. 2013) suggests that over-capacity by the artisanal
fleet is not the only cause of increasing migrations by fisheries. Rather, our results suggest that the high level of competition for the same resources over the same fishing grounds caused the enormous increase of capacity in the artisanal fleet of Senegal, which then spilled over into the neighboring countries further North and South. This led to a the relationship between the foreign host to Senegalese fishers,
which may be have been characterized as ‘symbiotic’ to turn into a parasitic
relationship, which then created conflicts between the domestic sector of the neighbouring host countries and migrant Senegalese artisanal fishers.
Considering the role that foreign fishing plays in these negative developments, we are heartened by the recent decision by the President of Senegal to maintain a ban on fishing for sardinella by Russian vessels. Furthermore, at the time this study was being finalized, Senegal is strengthening its Monitoring, Control and Surveillance capacity by acquiring new efficient monitoring vessels, one of which for the offshore waters of the Senegalese EEZ.
ACKNOWLEDGEMENTS
We thank the MAVA foundation for supporting the project “Sea Around Us Project in
West Africa, research and collaboration”, and also acknowledge the support of the
15
Resources Center at the Graduate School of Oceanography, University of Rhode Island. The contents are the responsibility of the authors and do not necessarily reflect the views of USAID or the United States Government. The authors thank the DPSP and the DPM for the precious data and the availability of their team. Finally, D.B. thanks her Senegalese hosts for their kindness during an April 2013 visit. The authors thank Dr. Dirk Zeller for his precious advice, Dr. Earl Meredith for the valuable input, and Duncan Copeland for the coordination of the project.
REFERENCES
Anon. (2013) Industrial fisheries in Guinea Bissau. TransparentSea. Available at:
http://transparentsea.co/index.php?title=Guinea,Bissau:Industrial_fisheries
[Accessed: 17/05/2013].
Auregan X (2007) Les enjeux géopolitiques de la "percée" chinoise au Sénégal. Master thesis, University of Institut Français de Géopolitique, Paris. 200 p.
Belhabib D, Koutob V, Gueye N, Mbaye L, Mathews C, Lam V and Pauly D (2013) Lots of boats and fewer fishes: catch reconstruction for Senegal, 1950-2010. Fisheries Centre Working Paper #2013-03, Fisheries Centre, Vancouver. 34 p.
Binet T, Failler P and Thorpe A (2012) Migration of Senegalese fishers: a case for regional approach to management. Maritime Studies 11(1): 1-14.
Bonfil R, Munro G, Sumaila UR, Valtysson H, Wright M, Pitcher T, Preikshot N, Haggan N and Pauly D (1998) Impacts of distant water fleets: an ecological, economic and social assessment. pp. 11-111 In The footprint of distant water fleet on world
fisheries. Endangered Seas Campaign. WWF International, Surrey.
Caverivière A and Rabarison Andriamirado GA (1988) Captures secondaires et rejets de la pêche crevettière à Penaeus notialis du Sénégal 111, CRODT, Dakar. 113 p. CRODT (2001) Potentiel et état d’exploitation des ressources halieutiques au Sénégal. p.
215 In Portudal S (ed.) Fisheries Access in West Africa. The promotion of
sustainable and equitable fishing access agreements. Dakar.
Deme M and Dioh BC (1994) Aménagement, législation et développement des pêches artisanales au Sénégal : bilan et analyse d'impact. pp. 25-42 (424) In
Barry-Gérard M, Diouf T and Fonteneau A (eds.), L'évaluation des ressources exploitables par la pêche artisanale Sénégalaise: documents scientifiques présentés lors du symposium. Institut Français de Recherche Scientifique pour le Développement en Coopération, Symposium, Dakar, February 8-13, 1993. Diallo A (2000) Statut of fish stocks in Senegal. pp. 38-40 In Abban E, Casal C, Falk T and
Pullin R (eds.), Biodiversity and sustainable use of fish in the coastal zone. ICLARM.
Diallo M (1995) Analyse des interactions entre la pêche artisanale et la pêche industrielle. 199, CRODT, Dakar. 31 p.
DPM (2011) Résultats généraux de la pêche maritime 2010. Direction des Pêches Maritimes Dakar. 93 p.
DPSP (2012) Données sur les navires pelagiques: Compagne 2012. DPSP, Dakar. 1 p. Emanuelsson A (2008) Bycatch and discard in Senegalese artisanal and industrial
fisheries for Southern pink shrimp (Penaeus notialis). SIK-report, University of
Cothenburg. 26 p.
FAO (2003) Rapport et documentation de l'Atelier de réflexion sur la gestion des capacités de pêche en Afrique de l'Ouest. Saly Portudal, Sénégal, 25-28 septembre 2001. Rapports sur les pêches 707, FAO, Rome. 89 p.
16
Gaudin C and Groupement GOPA consultants (2011) Assistance aux pays en voie de
développement dans l’application du règlement 5/ 8 sur la pêche illicite non déclarée et non réglementée. Rapport d’évaluation du pays Sénégal, Juin
2011 Europeaid/129609/C/SER/MULTI, Groupements GOPA consultants. 3 p. Goffinet T (1992) Development and fisheries management: The case of northwest Africa.
Ocean & Coastal Management 17(2): 105-136.
Greenpeace The Plunder of a nation’s birthright. The fishing license scandal: a drama in five acts: A survey on the looting of Senegal’s maritime riches between
March 2010 – April 2012. Greenpeace. 22 p.
INTERPOL (2010) Resolution: sustainable environmental crime programme. General Assembly 79th session. Doha, Qata. 1 p.
Johnstone N (1996) The economics of Fisheries Access Agreements: perspectives on the EU-Senegal case. Discussion Paper 96-02, IIED, London. 43 p.
Kaczynski VM and Fluharty DL (2002) European policies in West Africa: who benefits from fisheries agreements? Marine Policy 26(2002): 75-93.
Kelleher K (2002) Robbers, reefers and ramasseurs. A review of selected aspects of fisheries MCS in seven West African countries. Project FAO/GCP/INT/722/LUX (AFR/013). Sub-Regional Fisheries Commission, Dakar. 107 p.
Kelleher K (2005) Discards in world's marine fisheries, an update. FAO Fisheries Technical Paper 470, FAO, Rome. 131 p.
Mallory T (2012) China as a Distant Water Fishing Nation. Johns Hopkins School of Advanced International Studies. 12 p.
MEGAPESCA (2003) Evaluation ex-post du protocole d'accord de pêche entre le Senegal et la Communauté européenne, et analyse de l'impact du futur protocole sur la durabilité, incluant une évaluation ex-ante. 169 p.
MRAG (2005) Review of impacts of illegal, unreported and unregulated fishing on developing countries. Marine Resources Assessment Group Ltd, London. 170 p.
Niasse M and Seck M L’accaparement des ressources marines ouest africaines: Sociétés mixtes de façade et licences de complaisance. Expériences du Sénégal et de la Mauritanie. CAOPA, Dakar. 32 p.
Pauly D, Belhabib D, Blomeyer R, Cheung WWWL, Cisneros-Montemayor AM, Copeland D, Harper S, Lam VWY, Mai Y, Le Manach F, Österblom H, Mok KM, van der Meer L, Sanz A, Shon S, Sumaila UR, Swartz W, Watson R, Zhai Y and Zeller D (2013) China's distant-water fisheries in the 21st century. Fish and Fisheries doi: 10.1111/faf.12032.
Pramod G and Pitcher TJ (2006) An Estimation of Compliance of the Fisheries of Senegal with Article 7 (Fisheries Management) of the UN Code of Conduct for Responsible Fishing. p. 25 In Pitcher TJ, Kaliloski D and Pramod G (eds.),
Evaluations of ompliance with FAO (UN) Code of Conduct for responsible fisheries. Vancouver.
ter Hofstede R and Dickey-Collas M (2006) An investigation of seasonal and annual catches and discards of the Dutch pelagic freezer-trawlers in Mauritania, Northwest Africa. Fisheries Research 77(2): 184-191.
UNEP (2004) Policy implementation and Fisheries Resource Management: Lessons from Senegal, Fisheries and Environment. 4, UNEP. 72 p.
Vidal J (2012) Will overfishing by foreigners drive Senegalese fishermen to piracy? , The Guardian. Available at: http://www.guardian.co.uk/global- development/poverty-matters/2012/apr/03/overfishing-foreigners-senegal-fishermen-piracy [Accessed: 15/05/2012].
17
Appendix Table A1. Estimation of the average CPUE by the fleet landing in Senegal (2011-2012, DPSP 2012).
Vessel name Departure Landing date Landings (t) Fish meal (t)
RIBALKA SEVASTOPOL 09/03/12 02/04/12 1,158,330 56,800 24 75.87
18 Appendix Table A1. Cont.
ADMIRAL STARIKOV 08/02/12 29/02/12 1,546 10 21 73.61
ALEX KOSAREV 16/02/12 08/03/12 1,254 13 21 59.71
GLORIA 28/01/12 16/02/12 1,305 0 19 68.68
KOVAS 03/02/12 21/02/12 672 8 18 37.33
RIBALKA SEVASTOPOL 10/04/12 26/04/12 657 82 16 41.06
THOR 12/03/12 28/03/12 477 0 16 29.81
IRVINGA 18/01/12 02/02/12 1,597 0 15 106.46
KING KLIP 10/03/12 02/04/12 1,158 62 13 89.07
KAP BOGOMOLOV 23/02/12 06/03/12 779 44 12 64.91
CORAL 10/02/12 18/02/12 601 113 8 75.12
KING DORY 25/02/12 04/03/12 303 28 8 37.87
KIYEVSKA RUS 02/04/12 08/04/12 162 9 6 27.00
Average CPUE 54.17
KOVAS 21/02/12 29/03/12 1,410 38 37 38.10
ADMIRAL STARIKOV 29/02/12 04/04/12 2,058 62 35 58.80
BLUE WAVE 19/03/12 22/04/12 1,641 34 33 49.70
VASILY LOZOVSKY 28/03/12 29/04/12 1,784 87 32 55.75
CORAL 18/02/12 20/03/12 1,157 88 31 37.32
GLORIA 16/02/12 16/03/12 1,184 28 30 42.28
ALEX KOSAREV 08/03/12 04/04/12 1,586 83 27 58.74
KAP BOGOMOLOV 06/03/12 31/03/12 1,900 50 25 76.00
M VERBESKY 09/03/12 02/04/12 751 29 24 32.50
IRVINGA 02/02/12 25/02/12 986 49 23 42.86
SOLEY 28/02/12 21/03/12 1,730 22 78.63
KING FISHER 27/02/12 17/03/12 690 57 19 36.31
KING KLIP 02/04/12 16/04/12 574 106 14 41.00
KING RAY 18/04/12 30/04/12 461 36 12 41.43
VOLOPAS 23/03/12 03/04/12 373 0 9 41.44
OLEG NAYDENOV 04/04/12 2,059 36 57.19
Average CPUE 51.98
19
Appendix Table A2. Vessels reported by DPM and DPSP, their suspected flags and GRT for 2011-2012.
Vessel name Vessel flag Registration Vessel type Vessel origin GRT
ADJA FATOU SAKHO Spain DAK 865 Shrimp trawl - -
ASBIYALAHOU Senegal DAK 596 Small pelagic Senegal -
BADAOUI ex A. Amadou Senegal DAK 490 Small pelagic Senegal -
BAKURUS Senegal DAK 1008 Shrimp trawl Senegal 249
BATTERIE Senegal DAK 753 Shrimp trawl Senegal 179
BERRIZ SAN FRANCISCO Spain SS-1-7/03 Tuna Spain 241
Betty Senegal DAK 706 Shrimp trawl Senegal 228
CAP ROUGE Senegal DAK 427 Shrimp trawl Senegal 139
CAPO TRAMONTANA Senegal DAK 1075 Shrimp trawl Italy 317
CARVISA DOS Senegal DAK 1120 Shrimp trawl Senegal 235
CHARDON BLEU II Senegal DAK 1038 Shrimp trawl Senegal -
CHIQUITA Senegal DAK 990 Shrimp trawl Spain 237
CORONA DEL MAR Senegal BA 724 048 Tuna France 370
DAHLIA Senegal DAK 781 Shrimp trawl Senegal 155
DAVID MANSOUR ex MARIE ROSE Senegal DAK 1190 Tuna Senegal -
DOMENICA MADRE Senegal DAK 989 Shrimp trawl Italy 160
DONAKS Senegal Shrimp trawl Senegal 249
ELODIE/AISSATOU Senegal DAK 680 Shrimp trawl Senegal 120
20
NUEVO NOSO LAR Senegal DAK 1133 Shrimp trawl Spain/Portugal 294
NUEVO SAN LUIS Spain - Shrimp trawl Spain 116
ALEXANDER KOSAREV Russia 8607153 - Russia 7765
ALEXANDER MIRONENKO - - -
IRVINGA Lithuania 8834639 - Lithuania 4407
KABITAN BOGOMOLOV Russia 8607402 - Russia 7765
KING BORA 8033297 - Ukraine 4378
KING DORI - - -
21 Appendix Table A2. Cont.
KING KLIP St Vinc. & Grenad. 8721208 - Ukraine 4407
KING RAY St Vinc. & Grenad. 8730132 - Ukraine 4407
KIYEVSKA RUS Ukraine 8138695 - Ukraine 4407
KOVAS Comoros 7610426 - Poland 5955
LAZURNYY Russia 8729664 - Russia 4407
MARSHAL VASILEVSKY St Kitts & Nevis 8033869 - Ukraine 4378
MIKHAIL VERBITSKIY - - -
OLEG NAYDENOV Russia 8607309 - Russia 7765
RIBALKA SEVASTOPOL Ukraine 8826151 - Ukraine 4407
SOLEY Belize 8607270 - Russia 7765
STARK - - - - -
THOR - - - - -
VASILY LOZOVSKY - - - - -
VOLOPAS Russia 6405147 - Russia 2435
ZAHAR SOROKIN Russia 8607256 - Russia 7765