TEST ITEM ANALYSIS OF FINAL EXAMINATION ON ECONOMIC SUBJECT IN GRADE XI IPS SMA NEGERI 10 YOGYAKARTA
ACADEMIC YEAR 2014/2015
UNDERGRADUATE THESIS
This undergraduate thesis is submitted to fulfill the requirements to obtain the degree of Bachelor of Education in Faculty of Economics
Yogyakarta State University
By:
Dila Puspa Kencana 11403244045
ACCOUNTING EDUCATION DEPARTMENT FACULTY OF ECONOMICS
YOGYAKARTA STATE UNIVERSITY 2015
DECLARATION OF AUTHENTICITY
I, the undersigned below,
Name : Dila Puspa Kencana
Sudent ID : 11403244045
Study Program : Accounting Education
Faculty : Economics
Undergraduate Thesis Tittle : TEST ITEM ANALYSIS OF FINAL
EXAMINATION ON ECONOMIC
SUBJECT IN GRADE XI IPS SMA NEGERI 10 YOGYAKARTA ACADEMIC YEAR 2014/2015
Hereby declare that this undergraduate thesis is my own and original work. According to my knowledge, there is no work or opinion written or published by other, except as reference or citation by following the prevalent procedure
of scientific writing.
This statement is made consciously and not enforced.
Yogyakarta, November 18th, 2015 The Researcher,
MOTTO
Pray, Play, Try, and Cry. (Author)
DEDICATION
With mercy of Allah the Almighty, this simple work is dedicated to:
Alm. Sanjoto Pamungkas
TEST ITEM ANALYSIS OF FINAL EXAMINATION ON ECONOMIC SUBJECT IN GRADE XI IPS SMA NEGERI 10 YOGYAKARTA
ACADEMIC YEAR 2014/2015
By:
Dila Puspa Kencana 11403244045
ABSTRACT
This research aims to know the quality of Final Examination of Economic Subject in Grade XI IPS SMA Negeri 10 Yogyakarta Academic Year of 2014/2015 based on the validity, reliability, discrimination index, level of difficulty, and the effectiveness of distractor.
This research was a descriptive-quantitative research. The Final Examination of Economic Subject in Grade XI IPS SMA Negeri 10 Yogyakarta Academic Year of 2014/2015 consisted of 40 multiple choices. The subject in this research was students at Grade XI IPS SMA Negeri 10 Yogyakarta. The data collection technique in this study used documentation. The data was analyzed by using Anates program version 4.0.
The result of this research showed that: (1) Based on the validity, the multiple-choice showed that 17 test items (42,5%) were valid and 23 test items were invalid (57,5%). (2) Based on the reliability, the multiple choices had low reliability level about 0,41. (3) Based on the discrimination index, showed that test items which had poor discrimination index were 27 items (62,5%), test items which had moderate discrimination index were 4 items (10%), test items which had good discrimination index were 10 items (25%), and test items which had excellent discrimination index were 1 item (2,5%). (4) Based on the level of difficulty, viewed in term level of difficulty showed that test item which had high level of difficulty were 12 items (30%), 10 items (25%) had medium level of difficulty, and 18 items (45%) had low level of difficulty. (5) Based on the effectiveness of distractor, showed that 1 test item (2,5%) had very good distractor, 12 test items (30%) had good distractor, 14 test items (35%) had moderate distractor, 8 test items (20%) had less good distractor, and 5 test items (12,5%) had bad distractor. (6) Based on the quality of the items, the multiple choices test showed that 5 items (12,5%) had good quality, 7 items (17,5%) had moderate quality, and 28 items (70%) had bad quality. Based on the data above, it concluded that Final Examination of Economic Subject in Grade XI IPS SMA Negeri 10 Yogyakarta Academic Year of 2014/2015 have bad quality.
ANALISIS BUTIR SOAL UJIAN AKHIR SEMESTER GENAP (UKK) MATA PELAJARAN EKONOMI KELAS XI IPS SMA NEGERI 10
YOGYAKARTA TAHUN AJARAN 2014/205
Oleh:
Dila Puspa Kencana 11403244045
ABSTRAK
Penelitian ini bertujuan untuk mengetahui kualitas Soal Ujian Akhir Semester Gasap Mata Pelajaran Ekonomi Kelas XI IPS Ekonomi SMA Negeri 10 Yogyakarta Tahun Ajaran 2014/2015 yang ditinjau dari segi validitas, reliabilitas, tingkat kesukaran, daya pembeda dan efektivitas pengecoh/distractor.
Penelitian ini merupakan suatu penelitian deskriptif kuantitatif. Soal Ujian Akhir Semester Gasap Mata Pelajaran Ekonomi Kelas XI IPS Ekonomi SMA Negeri 10 Yogyakarta Tahun Ajaran 2014/2015 terdiri dari 40 butir soal pilihan ganda. Subjek penelitian ini adalah peserta didik kelas XI IPS di SMA Negeri 10 Yogyakarta. Teknik pengumpulan data menggunakan metode dokumentasi. Data kemudian dianalisis dengan menggunakan bantuan program Anates Versi 4.0.9.
Hasil penelitian menunjukkan bahwa: (1) Ditinjau dari segi validitas, bentuk soal pilihan ganda soal yang valid berjumlah 17 butir soal (42,5%), tidak valid 23 butir soal (57,5%). (2) Ditinjau dari segi reliabilitas, bentuk soal pilihan ganda memiliki reliabilitas yang rendah yaitu sebesar 0,41. (3) Ditinjau dari segi daya pembeda, bentuk soal pilihan ganda buruk 27 butir soal (62,5%), sedang 4 butir soal (10%), baik 10 butir soal (25%), dan sangat baik 1 butir soal (2,5%). (4)Ditinjau dari segi tingkat kesukaran, bentuk soal pilihan ganda yang memiliki tingkat kesukaran tinggi berjumlah 12 butir soal (30%), tingkat kesukaran sedang 10 butir soal (25%), dan tingkat kesukaran rendah 18 butir soal (45%). (5)Ditinjau dari efektivitas pengecoh/distractor berfungsi sangat baik 1 butir soal (2,5%), berfungsi baik 12 butir soal (30%), berfungsi cukup 14 butir soal (35%), berfungsi kurang baik 8 butir soal (20%), dan berfungsi tidak baik 5 butir soal (12,5%). (6)Kualitas butir soal pada soal pilihan ganda termasuk kualitas baik berjumlah 5 butir soal (12,5%), kualitas sedang sebanyak 7 soal (17,5 %), dan kualitas tidak baik 28 soal (70%). Hal ini menunjukkan bahwa kualitas soal yang dibuat kurang baik.
FOREWORD
I would like to thank to the Almighty, Allah SWT which has given me
bless, mercy, and guidance so this undergraduate thesis entitled “TEST ITEM
ANALYSIS OF FINAL EXAMINATION ON ECONOMIC SUBJECT IN
GRADE XI IPS SMA NEGERI 10 YOGYAKARTA ACADEMIC YEAR
2014/2015” finally finished. I realize that it would have been not possible without
the support of many people. Therefore, I would like to express my deepest
gratitude to the following:
1. My super beloved mom, Murti Sutariatmi and my dad, Muhammad Muljono,
thanks for the struggle, supports, prayers and your endless love.
2. Prof. Dr. Rochmat Wahab, M.Pd., M.A, Rector of Yogyakarta State
University.
3. Dr. Sugiharsono, M.Si., Dean of Faculty of Economics Yogyakarta State
University who had gave the research permission for the undergraduate
thesis.
4. Prof. Sukirno, M.Si., Ph.D., the Chairman of the Department of Accounting
Education who becomes inspiring lecturer.
5. Abdullah Taman, S.E., M.Si., Ak., as my Main Examiner who give me advice
for this undergraduate thesis.
6. Mahendra Adhi Nugroho, M.Sc., as my the Chairman of Examiner who gave
sugestions to this undergraduate thesis.
7. Andian Ari Istiningrum, M.Com., my deepest gratitude to my undergraduate
thesis Supervisor who had provided guidance, help, and correction in the
accomplishment of my undergraduate thesis.
8. Annisa Ratna Sari, M.S.Ed., as my previous supervisor who provided
guidance, correction and help me until my proposal seminar.
9. Diana Rahmawati M.Si., my academic supervisor who had provided
assistance, guidance and advice during the study period in Yogyakarta State
10. The entire Yogyakarta State University lecturer who had provided guidance
to be able to master the subjects needed in the work place.
11. Mrs. Nunung Agustina S.Pd.Ek., the teacher of economic subject in SMA
Negeri 10 Yogyakarta who gave me time and help me to this research in
SMA Negeri 10 Yogyakarta.
12. Depi Putri Mursanti, S.IP., Hasna Difa Salisa, Ghania Rifqa Fazila, and
Hanifa Fika Ardina, thanks for being my nice sisters and being my
cheerleaders at home.
13. Big family L.S. Wardoyo who always supported me to finish this
undergraduate thesis.
14. My fantastic storyteller, Yasir Ramadhan S. Pd,. thanks for being so choosey
and has a lot of things to share. Let’s reach your, mine, and our dreams!
15. My beloved babes, Ana Marlina Yolanda, S.E.I., Mayya Nur Lailiya, S.E.,
Rere (Dian) Anita Arwanti Putri, thanks for never stop keep in touch. I hope
it will be last forever.
16. My beloved girls, Mella Retnaningdyah, S.Pd., Devita Tri Kusumawanti,
S.Pd., Indriyani, S.Pd., Mutia Arini Putri, S.Pd., and Noorochma Chandra
Novianti, S.Pd., who had accompanied, given supports, and togetherness.
17. My beloved friends, Muhammad Zaenal, S.Pd., Dian Nurliyanto, S.Pd., Rizki
Romadityo, S.Pd., Adif Anityo Sigit S.Pd., Faris Syaifuddin, S.Pd., and Sigit
Muammar. Thanks for being my friend at the earlier semester when I have
not any friends yet and when I have not meet those girls.
18. My beloved classmates, 2011 International Accounting Education Class.
19. Those who helped me and supported me in completing this undergraduate
thesis but can not be mention one by one. Whithout their help this thesis
The researcher hopes that their kindess gets a better reward by Allah SWT.
Finally researcher hopes that this work will be useful for the readers.
Yogyakarta, November 18th 2015 Researcher,
Dila Puspa Kencana
TABLE OF CONTENT
COVER PAGE ... i
SUPERVISOR VALIDATION PAGE ... ii
VALIDATION PAGE ... iii
AUTHEBTICITY STATEMENT PAGE ... iv
MOTTO AND DEDICATION PAGE ... v
CHAPTER II LITERATURE REVIEW ... 8
A. Theoretical Review ... 8
1. Evaluation ... 8
2. Test As an Instrument Evaluation ... 10
a. Definition of Test ... 10
b. Forms of Test ... 11
c. The Characteristic of Good Test ... 12
3. Test Item Analysis ... 14
a. Validity ... 14
b. Reliability ... 19
c. Discrimination Index ... 24
d. Level of Difficulty ... 27
e. Effectiveness of Distractors ... 28
B. Relevant Research ... 30
C. Conceptual Framework ... 33
D. Research Paradigm ... 36
CHAPTER III RESEARCH METHOD ... 38
A. Research Design ... 38
B. Place and Time of Research ... 38
C. Subject and Object of the Research ... 38
D. Research Variable ... 39
E. Operational Definition of Research Variables ... 39
F. Data Collection Technique ... 40
G. Data Analysis Technique ... 41
CHAPTER IV RESEARCH RESULT AND DISCUSSION ... 49
A. Overview of Research Location ... 49
B. Description of Research Result ... 51
C. Research Result ... 51
D. Discussion ... 62
E. Research Limitation ... 74
CHAPTER V CONCLUSSION AND SUGGESTION ... 75
A. Conclusion ... 75
B. Implications ... 76
C. Suggestion ... 79
REFERENCE ... 81
LIST OF TABLE
Table Page 1. The Number of Research Subject ……… 38 2. The Criterias of Distractor Index ……….... 46 3. The Criterias of Overall Quality of The Test ….……… 47 4. Distribution of Final Examination based on Content Validity 51 5. Distribution of the test items in Final Examination on
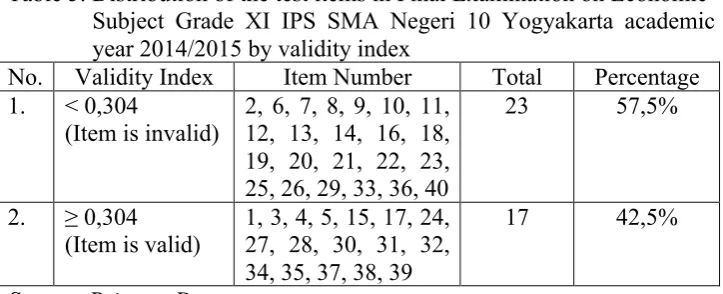
Economic Subject Grade XI IPS SMA Negeri 10 Yogyakarta
Academic year 2014/2015 by validity index ………... 55 6. Distribution of the test items in Final Examination on
Economic Subject Grade XI IPS SMA Negeri 10 Yogyakarta
Academic year 2014/2015 based on discrimination index.…. 57 7. Distribution of the test items in Final Examination on
Economic Subject Grade XI IPS SMA Negeri 10 Yogyakarta
Academic year 2014/2015 based on level of difficulty ...… 59 8. Distribution of the test items in Final Examination on
Economic Subject Grade XI IPS SMA Negeri 10 Yogyakarta
Academic year 2014/2015 based on effectiveness of distractor 60 9. Distribution of the test items in Final Examination on
Economic Subject Grade XI IPS SMA Negeri 10 Yogyakarta Academic year 2014/2015 Based on Validity, Discrimination Index, Level of Difficulty, and Effectiveness of Distractor ... 62 10. Distribution Distribution of test item in Final Examination
of Economic Subject in Grade XI IPS SMA Negeri 10
LIST OF FIGURE
Figure Page
1. Research Framework Scheme ... 36 2. Distribution of the test item in Final Examination on Economic Subject Grade XI IPS SMA Negeri 10 Yogyakarta academic year of 2014/2015
by validity index ... 56 3. Distribution of the test item in Final Examination on Economic Subject
Grade XI IPS SMA Negeri 10 Yogyakarta academic year of 2014/2015 based on discrimination index ... 58 4. Distribution of the test item in Final Examination on Economic Subject
Grade XI IPS SMA Negeri 10 Yogyakarta academic year of 2014/2015 based on level of difficulty ... 59 5. Distribution of the test item in Final Examination on Economic Subject
Grade XI IPS SMA Negeri 10 Yogyakarta academic year of 2014/2015 based on level of difficulty ... 60 6. Distribution of the test item in Final Examination on Economic Subject
Grade XI IPS SMA Negeri 10 Yogyakarta academic year of 2014/2015 based on based on validity, discrimination index, level of difficulty,
LIST OF APPENDIX
Appendix Page
1. Question Test And Answer Key ... 84
2. Data Score ... 93
3. Students’ Answer Distribution ... 99
4. Data Analysis Result ... 104
5. Upper and Lower Group ... 110
6. Test Participants Name ... 114
7. The Summary of Analysis Result ... 117
8. The Summary Data of Quality Test ... 120
9. Question Framework ... 123
CHAPTER I INTRODUCTION
A. Research Background
According to the Constitution of Indonesia 1945, ". . .mencerdaskan
kehidupan bangsa. . . " Indonesian Government always make improvements
to have better quality of education. One way to improve the quality of
education is by having a good education management. According to
Muhaimin (2012: 5) education management is the process of planning,
organizing, directing, controlling and evaluating in the context of educational
organizations. Education management can be started in a small scope, for
example, in a classroom environment.
Teachers as managers in the classroom not only teach the students, but
also planning, organizing, directing, controlling and evaluating. Teachers plan
learning activities include finding out the learners’ needs, determining the
learning objectives, writing the syllabus, finding out the topics that will be
studied, allocating time, and determining the learning resources (Wina
Sanjaya, 2013: 25). The planning of learning activites are contained in lesson
plan. If the lesson plan are made properly, then the learning activities are
more focused. The organizing is done by teach in the classroom or have a
learning activities accordance to the lesson plan already made. The directing
is used by teachers to influance, help, encourage, guide learners to be active,
teachers also control the ongoing activities and evaluate the activites that
have been done.
Teachers are required to have a good classroom management, in other
words, the teacher should be able to do all the processes of planning,
organizing, directing and evaluating. By evaluating the learning process,
teachers can analyze and assess learning processes, if there are advantages
and disadvantages, teachers can make corrections. Evaluation is very
important in order to provide the results of a teachers' success in teaching
students and used as a self-correction for the future.
Evaluation is one of the important components and steps that must be
taken by the teacher to determine the effectiveness of learning. Evaluation is a
systematic and sustainable process to determine the learning quality of the
various learning components based on certain considerations and criteria
(Zainal Arifin, 2013: 10). From the evaluation, especially evaluation of
learning outcomes, teachers can measure whether students have mastered the
material that has been studied or not. Thus, the evaluation is able to become
a benchmark in making decision which contains of measurement and
assessment. Measurement is a comparison between something and a
quantitative measure (Zainal Arifin, 2013: 4).
The technique that can be used for assessment is by using the test. The
test is a technique in the form of daily exam, midterm exam, and final exam.
According to Ngalim Purwanto (2010: 33), achievement test is a test used to
exam commonly use written test, which has two forms there are subjective
test and objective test. Subjective test also known as describtion test, because
the answer of the question in subjective test contains description, perception,
technique, and language style owned by each students (Zainal Arifin, 2013:
125). While objective test such as true-false, multiple choice, matching test,
and complete with short answer (Zainal Arifin, 2013: 125).
The test preparation is divided into two types, there are standardized
test and teacher-made test. Standardized test is a test that already had a high
degree of validity and reliability based on experiments on a large and
representative sample (Zainal Arifin, 2013: 120). Standardized test have been
analyzed statistically and empirically by experts, therefore the test is valid
and can be used generally (Zainal Arifin, 2013: 120). Then, teacher-made test
is test that prepared by teachers who teach the lesson. This test is usually
used for daily exam, formative test or school exam (Zainal Arifin, 2013: 119).
Teacher-made test is temporary, which means it only can be applied at certain
times and certain situation (Zainal Arifin, 2013: 120). A professional teacher
prepared the test properly and analiyzed the test to determine whether the test
have good quality or not.
The qualified test can describe and produce an objective and accurate
values (Zainal Arifin, 2013: 246). The qualified test should have the
characteristic of validity, realiability, objectivity, practically, and
economically (Suharsimi Arikunto, 2012: 72). A valid test can measure or
2012: 73). The test that revealed reliable if the test is able to povide consistent
result (Suharsimi Arikunto, 2012: 74). The test that have qualify of
objectivity if the test does not have any factors that may be affect the
assessment (Suharsimi Arikunto, 2012: 75). The test that have qualify the
practically is easy to prepare, easy to implementation, easy to control, and
guidded by clear instruction (Suharsimi Arikunto, 2012: 77). An economical
test does not require high cost, does not require a lot of effort, and does not
take a long time (Suharsimi Arikunto, 2012: 77).
To determine whether the quality of the tests that have been tested
well, it is necessary to analyze the item that also known as test item analysis.
According Ngalim Purwanto (2010: 118) the purpose of test item analysis is
to find out the information about the good items and not good test item. Not
good test item should not to be used on the next assessment or test, while the
good item will be saved in storage test and it can be tested on the next
assessment.
The limited ability of the teacher is did not master the education
management in the classroom, so the evaluation process did not implemented
properly. Teacher did not analyze the test items that have been created and
tested to students. The teacher should analyze the test item because the
quality of test items made by teacher is not known yet. The teacher did not
analyze the test item caused by the lack of teacher’s capability in analyze the
thinks that test item analysis is complicated, take a long time, and requaire a
lot of effort.
That case occur to the teacher in SMA Negeri 10 Yogyakarta,
especially Economics teacher who did not conduct test item analysis as well.
Economics teacher at SMA Negeri 10 feels overburdened to do test item
analysis, because the teacher does not know to analyze the test item, takes a
lot of time and effort, the teacher often feels overburdened by duty hours at
school for about 20 hours in a week, and teacher analyze the test by using
simple analysis, teacher just looking at students’ test result. Based on the
background of the study above, researcher interested in conducted reseacrh to
find out the quality of final exam in SMA Negeri 10 Yogyakarta with the
tittle, “Test Item Analysis of Final Examination on Economics Subject in
Grade XI IPS SMA Negeri 10 Yogyakarta Academic Year of 2014/2015”.
B. Problem Identification
Based on the research background above, can be identified several
problems that can be researched:
1. Teacher did not conduct test item analysis that used to evaluate as well
because teacher just did simple analysis by looking at students’ result.
2. The overall quality of final examination as evaluation instrument on
Economics subject Grade XI IPS in SMAN 10 Yogyakarta was not
3. The lack of terachers’ information about the technique of test item
analysis to determine the quality of teacher-made test.
4. The teacher feels overburden to analyze the test item because the process
of test item analysis is complicated, take a long time, and requires a lot
effort.
C. Problem Restriction
Based on the problem identification above, this research needed
problem restriction. This research was restricted to determine the quality of
final examination test item as evaluation tool on Economics subject Grade XI
IPS in SMAN 10 Yogyakarta in terms of validity, reliability, level of
dificulty, discrimination index, and effectiveness of distractors.
D. Problem Formulation
Based on the probelm restriction above, the formulation of this
probelm in this research was: “How is the quality of the Final Examination
Test Item on Accounting Economic Subject in Grade XI IPS SMA Negeri 10
Yogyakarta Academic Year of 2014/2015 in terms of validity, reliability,
level of dificulty, discrimination index, and effectiveness of distractors?”.
E. Research Objectives
Based on the problem formulation above, the purpose of this research
Subject in terms of validity, reliability, level of dificulty, discrimination
index, and effectiveness of distractors in Grade XI IPS SMA Negeri 10
Yogyakarta Academic Year of 2014/2015.
F. Reseacrh Benefits
The result of this research are expected to give benefits as follows:
1. Theoritical Benefits
Results of this study were expected to give contribution to the
improvement and refinement theory about learning outcomes evaluation,
and can be considered for further research.
2. Practical Benefits
a. For The Researcher
As implementation and development of knowledge that has been
gained during studying in Yogyakarta State University and it can be
used as apreparation which can be applied in the future.
b. For School
This research is expected to give a consideration for educational
institution in organizing education management, especially in
analyzing test item in order to evaluate teachers’ performance.
c. For The Teacher
The result of this research is expected to guide the teachers to have a
good classroom management, have a good quality for themselves so
CHAPTER II LITERATURE REVIEW
A. Theoretical Description
1. Evaluation
Evaluation, according to Mahrens & Lehmann in “Evaluasi
Pengajaran” written by Ngalim Purwanto (2010: 3), is a process of
planning, acquiring, and providing the necessary information to make an
alternatives decision. Another opinion by Norman E. Gronlund quoted by
Ngalim Purwanto (2010: 3) said that evaluation is a systematic process of
determining the extent to which instructional objectives are achieved by
pupils. Other definition of evaluation according to Ralph Tyler quoted by
Suharsimi Arikunto (2012: 3) said that evaluation is a process of
collecting data to determine how far, what case, and which part of
educational objectives have been achieved. From some explanations
about evaluation according to the experts above, can be concluded that
the evaluation is a systematic process to obtain information how far the
success of activities has been achieved.
Educational evaluation scope in school includes three components,
there are an evaluation of teaching program, an evaluation of teaching
implementation process, and an evaluation of learning outcomes (Anas
a. An evaluation of teaching program
This evaluation includes three cases, those are the evaluation of
teaching purposes, evaluation the content of the teaching program,
and evaluation of teaching and learning strategies (Anas Sudijono,
2009: 30).
b. An evaluation of teaching implementation process
An evaluation of teaching implementation process will be adapted to
the evaluation of teaching program. Therefore, an evaluation of
implementation process will be more focused on activities in the
classroom including learning process, the communication between
teacher and students, giving assignments motivation to students
(Anas Sudijono 2009: 30).
c. An evaluation of learning outcomes
This evaluation conducted to determine the understanding and
mastery of students towards the material that being studied. An
evaluation of learning outcomes is teacher’s responsibility in order
to know the learning outcomes and can be used to make decision for
the other teaching program in the future (Anas Sudijono, 2009: 30).
Anas Sudijono (2009: 59 – 60) describes the main steps in the
evaluation of learning outcomes is a set of learning process which begin
with planing the evaluation of learning outcomes, collecting data or
having tests, verifying data, processing and analyzing data, interpretating
follow-up, decision-making and formulating a policy for further
evaluation program. Evaluation of learning outcomes conducted by
teachers to measure the success of learners. Measuring the success of
learning is using a quantitative measure or using numeric symbols (Anas
Sudijono, 2009: 34).
Evaluation techniques of learning outcomes that can be used are a
test and non-test technique (Anas Sudijono, 2009: 62). A test is tests that
can be taken or used in measurement and assessment, in the form of
giving tasks that can generate value that symbolizes students’ behavior
and students’ achievement (Anas Sudijono, 2009: 67). While non test
technique is an assessment without testing the students, but it used to
have systematic observation, interview, questionnaire spreading, and
documentary analysis (Anas Sudijono, 2009: 76).
2. Test As an Instrument Evaluation
a. Definition of Test
According to M. Ngalim Purwanto (2010: 33), achievement
test is a test used to assess learning outcomes which have been given
by the teacher in the classroom. Another opinion according to Anas
Sudijono (2009: 67) stated that the test is a method or procedure of
measurement and assessment in the education sector, in the form of
giving tasks that can generate value and symbolize students’
behavior and students’ achievement. In Suharsimi Arikunto’s book
information collection instrument, but when it compared to the other
instruments, the test is more formal because it full of restrictions.
The test is generally used to measure students’ learning outcomes,
especially cognitive learning outcomes related to mastery the
learning materials accordance the education goals (Nana Sudjana
2011: 25). Based on the description above it can be concluded that
the test is one of the instruments that used to measure the students’
learning outcomes based on subject matter given by the teacher.
b. Forms of Test
Test based on the preparation:
1) Standardized Test
A standardized tests is a test that examined repeatedly in a
large group of students, and the items are relevant and have a
high discrimination (Zainal Arifin, 2013: 120). Standardized
tests have a high degree of validity and reliability, so the
standardized tests used to measure students’ ability in three
aspects, namely the learning position, learning ability, and
diagnostic (Zainal Arifin, 2013: 120).
2) Teacher-made Test
According to Zainal Arifin (2013: 19) teacher-made test is
a test that is compiled by teachers who teach the subjects for
daily exam, formative exam, and summative exam. The quality
and it is temporary, which mean that it is valid only at certain
times and certain situations (Zainal Arifin, 2013: 119).
Teacher-made tests can be in the form of written test, an
oral test and a practical test/performance test (Zainal Arifin,
2013: 124). The written test is a test that requires students to
answer by writing on paper (Zainal Arifin, 2013: 124). The
written test has two forms, there are essay and objective test.
Zainal Arifin (2013: 125) describes an essay also called as
subjective test because the answer is a description that explain
based on students’ thinking and knowledge, while objective test
assessed objectively, it means that the correct answer scores 1
and the wrong answer scores 0. Example of objective tests can
be true-false, or yes-no question, multiple choice, matching, and
short answer or completion (Zainal Arifin, 2013: 135).
c. The Characteristic of Good Test
Test has good quality if it requires validity, reliability,
objectivity, practicality and economical (Suharsimi Arikunto, 2012:
72).
1) Validity
According to Zainal Arifin (2013: 247), there are two
important elements in the validity of the test, the first is validity
refers into a degree and the validity which associated with
measure what should be measured. Another opinion from Anas
Sudijono (2009: 93-94) said that achievement test can be said to
be valid if it can measure learning outcomes appropriately,
correctly, and valid.
2) Reliability
Reliability is the level of consistency degree from an
instrument. A test said to be reliable if it gives the same result
when tested in the same group at a different time or different
opportunity (Zainal Arifin, 2013: 258).
3) Objectivity
The test is objective if when the test were held, there is no
subjective factors that affecting, especially in scoring the test
(Suharsimi Arikunto, 2012: 75).
4) Practicality
According to Zainal Arifin (2013: 264) practicality in a
test is an ease of the test in preparation, use, processing, and
interpretation.
5) Economical
The test is considered economical if the implementation
does not requires high cost, does not take a long time, effective
3. Test Item Analysis
The quality of a test can be known after the test is analyzed. The
analysis of quality test can determine the test that has good quality in
overall test or in each items of the test (Zainal Arifin, 2013: 266). The
test quality is tested through test items which is called test item analysis.
According to Suharsimi Arikunto (2012: 222) test item analysis aims to
identify the good items, less good items, and bad items. After the teacher
knows the quality test item, teacher can improve the less good items. The
test item analysis is done by reviewing validity, reliability, discrimination
index, level of difficulty and the effectiveness of distractors.
a. Validity
Validity is a capability of measure what should be measured
appropriately. Validity is used to measure the achievement test
whether the test is good to measure students’ learning outcomes. To
know the validity of the achievement test, the test should be
analyzed. The analysis test can be held from two aspects (Anas
Sudijono, 2009: 163):
1) Test as a totality of the test
Analysing test as a totality of the test can be conducted in
two ways, the first is analysing test rationally or logically and
the second is analyzes based on the empirical validity (Anas
a) Logical validity
Logical validity is obtained by thinking logically, then
the evaluation instrument can be valid if the planning based
on logical thought as planned (Anas Sudijono, 2009: 164).
A good evaluation instrument can be viewed from the
content validity and construct validity.
A content validity on achievement test is a validity
obtained from overall analysis toward the content of the
achievement test. A content validity in achievement test is
expected to provide a representative measurement on
students’ learning outcomes (Anas Sudijono, 2009: 164). A
content of validity in achievement test will be known by
comparing between the content in each items and
instructional goals (Anas Sudijono, 2009: 165).
Instructional goals is related to the curriculum that being
used. Those curriculum became a foundation to make an
instructional goals, so that content validity notice the test
items that accordance to the curriculum in order that
learning objectives can be achieved. From the description
above, the content validity is also called curriculum validity
(Zainal Arifin, 2013: 248). In preparing the achievement
test, the test item created based on the question framework
to be valid if the test item were made based on rational
thought based on the test guidelines.
Construct validity on achievement test is seen from
structure of the test (Anas Sudijono, 2009: 164). Construct
validity on achievement test consider at the suitability of the
test item which is made based on the question framework
(Purwanto, 2014: 128). Furthermore, a construct validity
emphasized on the structure of test item, it means that the
test item of achievement test can measure some aspects
appropriately such as cognitive, affective, psychomotor etc
(Anas Sudijono, 2009: 166). In order to obtain the test result
that fulfill a construct validity, the test should be made as
well based on logical and rational thought (Anas Sudijono,
2009: 167). Therefore, this validity is included in the logical
validity.
b) Empirical validity
The empirical validity is a measurement based on the
analysis that has been done in the earlier research
(Suharsimi Arikunto, 2012: 81). Empirical in Indonesian
Dictionary is based on experience which is obtained from
discovery, experiments, observation that has been done, so
that the empirical validity comes from experience and
based on data analysis of the result of proven experience
(Anas Sudijono, 2009: 168). In order to get valid
measurement, so the test preparation must be done based on
the provision as well as logical validity, but it must be
proven by experience on the empirical validity (Suharsimi
Arikunto, 2012: 81).
In order to find out the empirical validity of
achievement test can be conducted an observation in two
aspects, namely predictive validity and concurrent validity
(Anas Sudijono, 2009: 168). A predictive validity is a
prediction about what will happen later (Anas Sudijono,
2009: 168). A predictive validity in achievement test is a
condition that shows the extent of the test that used
appropriately to know what will happen by predicted it
(Anas Sudijono, 2009: 168). To determine whether
achievement test have had a predictive validity is by look
out the correlations between achievement test with an
existing criterion (Anas Sudijono, 2009: 170).
A concurrent validity is also known as a moment
validity (Anas Sudijono, 2009: 170). A concurrent validity
shows unidirectional relation when it used to measure the
test that was tested in the past, now and the next test (Anas
concurrent validity requires criterion to determine the
validity of a test. The criterion that used is a data from the
past which compared with the data from the present (Anas
Sudijono, 2009: 177). If a concurrent validity is associated
to predictive validity, both are validity that require a
criterion as an instrument to determine the level of validity
which is being studied (Anas Sudijono, 200: 177). It can be
concluded if the criterion is obtained from the future is
called as predictive validity, otherwise if the criterion is
obtained from the present or in the same period by
instrument that used, so the validity is called as concurrent
validity.
2) Test based on each items
The test item is an integral part of test as a totality. A
validity of achievement test is a accuracy of the test item in
measure what should be measured (Anas Sudijono, 2009: 182).
The total of the items affects validity of the test. The test items
compose the test, if the answered is mostly correct so the total
score is high. The validity level of test can be determined by
using a point biserial correlation technique:
�!"#
�!−�!
�!
notes:
ypbi = biserial correlation coefficient
Mp = the mean score of students who answered correctly
for test item that looking for
Mt = the mean of total score
St = the standard deviation of the total score
p = the proportion of students who answered correctly
� = !"!#$ !"#$%&"! !!! !"#$%&%' !"##$!%&'
!"!#$ !"#$%&"!
q = the proportion of students who answered
incorrectly (q = 1 – p)
(Suharsimi Arikunto, 2012: 93)
The result of the calculations can be interpreted in two
ways:
a) See the value of r and it is interpreted as an explanation
which has a high correlation, high enough, etc.
b) Comparing to the product moment r table then it can be
known whether significant or not that correlation. If the
value of r is smaller than r table then the correlation is not
significant and the otherwise.
(Suharsimi Arikunto, 2012: 89)
b. Reliability
Reliability is required in making a good achievement test.
can support the validity of the test. A test may be reliable but not
always valid, but if the test is valid, that test is also reliable. The
reliable test according to Purwanto (2014: 154) means trust and
associated with precision and consistency. An achievement test said
to be trusted if the measurement result is relatively stable and
consistent. Another opinion from Zainal Arifin (2013: 258) that
reliability is the level of consistency from an instrument. A test said
to be reliable if it always gives the same results when it tested in the
same group at a different time or different situation (Zainal Arifin,
2013: 258)
The concept of reliability is underlying the error measurement
which may be occur in a measurement process or occur on particular
value, then it causing the changes in the composition of the group
(Zainal Arifin, 2013: 259). Errors that affect the test can occur for
various reasons, but it can be classified into three causes (Suharsimi
Arikunto, 2012: 101-104), namely:
1) The things related to test itself, that are test’s length and the
quality of test item.
The test consist of many items have higher validity than
the test that consist of less items. The degree of validity
indicates the level of reliability. But a long test could be less
a) The clarity of the formulation item
b) The quality of question toward the answer, so does not
make a wrong answer.
c) The clear instructions can make the test easily and quickly
done.
2) The things related with the testee.
A test that tested to groups consist of many students will
reflect the diversity of results that describe the degree of
reliability of a test.
3) The things related to the implementation of the test.
The factors that affected implementation of the test are the
test instruction, test supervisor, and the situation test. The test
result that obtained indirectly will be affected the reliability of
the test.
The determination reliability of the objective test could be
done by using three methods, there are (Anas Sudijono, 2009:
213-278):
1) Single test – single trial method
Reliability of the achievement test by using this method is
determined by measuring on a group of subjects using one
instrument and tested once (Anas Sudijono, 2009: 214). To find
the reliability of the achievement test can be used the five
formula, Flanagan formula, Rulon formula, Kuder-Richardson
formula, and C. Hyot formula (Anas Sudijono, 2009: 214).
The Spearman-Brown formula, Flanagan formula, Rulon
formula are also known as split-half technique, while the
Kuder-Richardson formula and C. Hoyt formula did not use the that
technique.
a) Spearman-Brown formula
This formula is also known as split-half technique. A
split-half technique is done by splitting the items into two
equal parts, the each testee has two kinds of scores (Anas
Sudijono, 2009: 216). Split-half technique can be divided
by item number such as even-odd number and left-right
number.
b) Flanagan formula
To know the reliability of the test using this formula
by looking at the sum of deviation quadrant on the part I,
the sum of deviation quadrant on the part II, and the sum of
total quadrant (Anas, Sudijono 2009: 231).
c) Rulon formula
In this formula, the level of reliability of the test can
be obtained from the difference scores between the scores
that have been achieved by the testee on the part I and part
formula and Flanagan formula, this formula can be divided
by item number such as even-odd number and left-right
number.
d) Kuder-Richardson formula
Kuder-Richardson formula is different from the three
formulas above. Determination reliability of the test using
Kuder-Richardson formula is based on the half of the first
part and the half of the second part (Anas Sudijono, 2009:
252). There are two formulas in this, that are KR20 formula
and KR21 formula. KR20 gives more accurate calculation
than KR21 but the process is more difficult. The opposite
from KR20 formula, the KR21 calculation is more simple but
the result is less accurate.
e) C. Hoyt formula
Different from the previous formula, the C. Hoyt
formula determine the reliability of the test by looking at
the data like scores of the result which is considered as the
result of an experiment, which the first factor is subject and
the second factor is item (Anas Sudijono, 2009: 259). The
analysis technique that used in this formula is variance
analysis technique or Anava. Anava technique have each
cell consist of one subject and then find out the interaction
2) Single test – double trial method
Single test – double trial method is also known as
repetition method. Determination the reliability of the test was
done by using repetition, where the tester uses only one series of
tests, but experiments is done twice (Anas Sudijono, 2009: 268).
If both of the tests have positive correlation which the both of
test give significant score, then achievement test is stated as
reliable because the first score result and the second score result
show the consistency or stability.
3) Double test – double trial method
Different from the previous methods, double test – double
trial method is looking for the reliability of the test by using two
test that given to a group of subject simultaneously with a
similar test (Anas Sudijono, 2009: 272). This approach is
considered better that the two previous methods, because the test
item is created similar but not same at all and this test is
implemented in the same time.
c. Discrimination Index
According to Suharsimi Arikunto (2012: 226), discrimination
index is the ability of the test item to distinguish between the smart
students with the less smart students. Similar with Anas Sudijino’s
opinion (2009: 385-386), the discrimination index is an ability of test
high capability and testee who have a low capability. Meanwhile,
according to Zainal Arifin (2013: 273) argued that the calculation of
discrimination index is measurement about the extent of test item
can distinguish the students who have mastered the competency with
the students who have less mastered the competency based on
certain criteria. From some statements above, discrimination index is
very important in an achievement test. It is because of the ability of
each students is different, so that achievement test item can reflect
the differences between the students who have mastered the material
who can answered the test correctly and the students who have not
enough mastered the material can not answer the question.
Discrimination index in test item can be known by looking at
the size of the discrimination index number of the test item.
Discrimination index number is a number that indicates the size of
the discriminant power in a test item (Anas Sudijono, 2009: 387).
Discrimination index indicated with D symbol. The negative sign on
the discrimination index is used if a test item reverse shows the
quality the tester. The negative sign shows that the test item more
answered by lower group than the upper group. Before calculating
the quality of discriminant power, the participants were grouped into
1) Small group
In small group, the participants divided into two equal
groups, 50% upper group and 50% lower group. Then, all the
participants are sorted starting from top scores to bottom scores,
after that each group is divided into two and put into upper
group or bottom group.
2) Big group
In big group use the group by taking both of the poles, the
top poles and the bottom poles about 27% due to cost and time
efficiency. Discrimination index can be determined by formula:
� = �!
�! −
�!
�! = �!− �!
notes:
D = the number of participants test
JA =the number of upper group
JB = the number of lower group
BA = the number of upper group that answer the question
correctly
BB = the number of lower group that answer the question
correctly
PA = proportion of the upper group who answered correctly
(P is difficulty index)
PB = proportion of the lower group who answered correctly
The result of the calculation above is interpreted based on
the following criteria:
D : 0,00 – 0,20 : bad
D : 0,20 – 0,40 : fair
D : 0,41 – 0,70 : good
D : 0,71 – 1,00 : very good
D : negative, all is bad. So, all of the test item which have
negative D value should be discarded.
(Suharsimi Arikunto, 2012: 232)
d. Level of Difficulty
Level of difficulty is measurement the level of difficulty test
item (Zainal Arifin, 2013: 266). Level of difficulty of the test
showed how is the quality of achievement test. An achievement test
that has good quality is a test that is not too easy or too difficult. Test
item that too easy or too difficult make an achievement test could not
distinguish the students’ ability. Test item that too easy could not
stimulate students to develop their effort to solve the test. While the
test item that too difficult makes students give up and less exited to
resolve the test.
The number show the test that the test is difficult and easy is
called difficulty index (Suharsimi Arikunto, 2012: 223). The amount
of difficulty index between 0,00 to 1,00. Difficulty index indicates
index 0,00 indicates that the test item is too difficult, otherwise if
difficulty index is 1,00 indicates that the test item is too easy.
Symbol for difficulty index is P from proportion. Proportion index
can be determined by this formula:
� = �
��
notes:
P = difficulty index
B = total students who answered the questions correctly
JS = the total students who participate the test
(Suharsimi Arikunto, 2012: 223)
The result of the difficulty index calculation of achievement
test is interpreted based on this criteria:
Test item with P score about 0,00 to 0,30 is difficult
Test item with P score about 0,31 to 0,70 is moderate
Test item with P score about 0,71 to 1,00 is easy
(Suharsimi Arikunto, 2012: 225)
e. Effectiveness of Distractors
Distractors is necessary to mislead the test participants do not
choose the correct answer (Purwanto, 2014: 108). Distractors usually
used in objective test which in each item have been provided some
option or alternative answers (Anas Sudijono, 2009: 409).
Effectiveness analysis is related to the distribution pattern of the
describe how is the testee determine the answer to the alternative
answers that have been attached to each item (Anas Sudijono, 2009:
409). Thereby, distractors have relation with distribution pattern
because distribution pattern can be used as distractor, moreover the
distractor can be placed spread and evenly on the test item.
Distractor is successful if there is some test participants who chose
the distractor answer. The amount of test participants who choose
distractor answer is equal or close to the ideal amount. If the test
participants answered correctly on one item, then IP = 0 which
means the test item is bad because distractor in the question is not
working. Distractor index can be calculated by formula:
�� = �
�−� / �−1 x 100%
notes:
IP = distractor index
P = the amount of students who choose distractors
N = the amount of students who take the test
B = the amount of students who answered correctly on very
item
n = the amount of alternative answers or option
1 = fix numbers
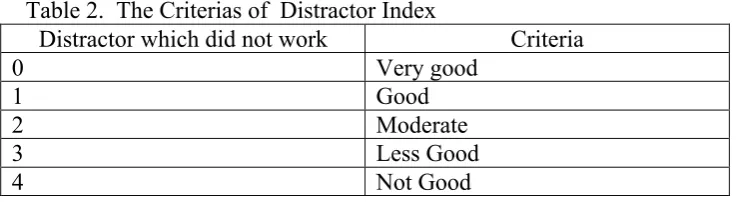
The interpretation from calculation of distractor index is
adapted based on this criterias as follows:
Very good = 0 distractor which did not work
Good = 1 distractor which did not work
Moderate = 2 distractor which did not work
Less good = 3 distractor which did not work
Not good = 4 distractor which did not work
(Sugiyono, 2010: 134-1350)
B. Relevant Research
1. The research by Tri Srtya Ernawati in 2013 entitled “Analisis Butir Soal
Akhir Semester Ganjil Buatan Guru Akuntansi Program Keahlian
Akuntansi Kelas X SMK Negeri 1 Bantul Tahun Ajaran 2012/2013”. The
result of the 80 multiple-choice items are:
a. The total of valid test item are 61 items (76,25%)
b. The question items has very high reliability as 0,820
c. The items that have fair level of difficulty are 19 items (23,75%)
d. The items that have good discrimination index are 12 items (15%)
e. The distractor item which work very well are 6 items (7,5%) and the
distractor item which work well are 9 items (11,25%)
f. The total of item that have good quality is11 items (13,75%)
The similarities between this research and my research are conducted
used in Tri’s research is using same program namely Anates program
Version 4.00. The difference between this research and my research are
research subject, and place of research.
2. The research by Muslikah Purwanti in 2014 with the title “Analisis Butir
Soal Ujian Akhir Semester Ganjil Mata Pelajaran Akuntansi Keuangan
Kelas XI Akuntansi Menggunakan Microsoft Office Excel 2010 di SMK
Negeri 1 Yogyakarta Tahun Ajaran 2013/2014”. The result from 40
multiple-choice items and 4 essay test item are:
a. The total of valid test items in multiple-choice test are 19 (63,33%)
and in essay test are 3 items (75%).
b. Both of the tests have low reliability that are 0,660 for
multiple-choice test and 0,50 for essay test.
c. The difficulty level of multiple-choice test is moderate which have 9
items (30%)
d. The total of multiple-choice test that have good discrimination index
is 10 items (33,33%) and the total of multiple-choice test that have
very good discrimination index is 6 items (20%). The total of essay
test that have good discrimination index is 2 items (50%).
e. The distractor item which work very well are 3 items (10%) and the
distractor item which work well are 10 items.
The similarities between this research and my research are conducted
quantitative descriptive research and analyze test item. The difference
research, and the program that used in Muslikah’s research is using
Microsoft Excel while my research is using Anates program Version
4.00.
3. The research by Sony Irawan in 2015 with the title “Analisis Butir Soal
Ujian Akhir Semester Gasal Mata Pelajaran Komputer Akuntansi Siswa
Kelas XI Akuntansi SMK YPKK 2 Sleman Tahun Ajaran 2014/2015.”
The result from 40 multiple-choice items and 5 essay test item are:
a. Total validity of multiple-choice test is 33 items (82.5%) and 7 items
(17.5%) is invalid, then the total validity of the essay test is 4 items
(80%) and 1 item (20%) is not valid.
b. Reliability of multiple-choice test is about 0,75 and for essay test is
about 0,31 which means that the essay test is not reliable.
c. The difficulty level of multiple–choice test showed that 4 items are
very difficult (10%), 1 item is difficult (2,5%), 19 items are
moderate (47,5%), 11 items are easy (40%), and 5 items are very
easy (12,5). Then, the difficulty level of essay test showed that all of
the items are moderate.
d. Discrimination index of multiple-choice test showed that 6 items are
very bad (15%), 4 items are bad (10%), 6 items are moderate (15%),
20 items are good (50%), and 4 items are very good (10%). Then,
the essay test showed that 1 item is very bad (20%), 1 item is
moderate (20%), 2 items are good (40%), and 1 items is very good
e. The distractor in multiple-choice test showed that 4 items are very
good (10%), 15 items are good (37,5%), 13 items is moderate
(32,5%) 6 items are bad (15%), and 2 items are very bad (5%).
f. The analysis based on the validity, reliability, level of difficulty,
discrimination index, and distribution pattern are showed that 12
items are qualified (30%), 9 items are less qualified (22,5%), 19
items are not qualified (47%), while the essay test showed that 4
items are qualified (80%) and 1 item is not qualified (20%).
The similarities between this research and my research are conducted
quantitative descriptive research, analyze test item, and is using same
program namely Anates program Version 4.00. The difference between
this research and my research are research subject, and place of research.
C. Research Framework
Teacher must have enough knowledge and skills in learning activities.
Learning activities is a process of planning, implementation, and evaluating
in the classroom. Planning and implementation must be balance with the
evaluation of learning outcomes. Evaluation of learning outcomes is
important because, by evaluation teachers are able to measure the extent of
learners in understanding the material that has been given and the results can
be used as a decision maker to determine the students’ value and improve the
Evaluation of learning outcomes can be done by test technique. The test
that made by teacher must have a good quality in order to measure accurately
the students’ learning outcome. To determine the quality of the test, the
teacher can analyze the quality of the test. Analysis the quality of the test may
also called as test item analysis. The analysis is done by reviewing the entire
test and on every item which is a integral part of the test. Test item analysis
on the evaluation of learning outcomes is based on the validity, reliability,
discrimination index, level of difficulty, and effectiveness of distractors.
Validity provides a description the ability of a test can measure
accurately what will be measured. The validity of test item shows that the test
is able to measure the achievement of learning objective. The achievement of
learning objective is listed in each test item according with the question
framework.
Besides the validity, qualified measurement test is also based on
reliability. Reliability is level of consistency of test item. Consistency of the
test is based on the students’ score that expected to remain consistent on the
next test. A test is said to be reliable if the test is consistent in assessment
although the test is tested many times in a different situation.
Discrimination index on achievement test is used to distinguish the
capabilities of each student. Calculation of discrimination index is used to
measure the extent of a test item that capable to distinguish the students who
understand the material with the students who less understand the material.
discrimination index. Discrimination index is a number that indicates the
amount of discrimination index in every test item.
The level of difficulty in the test is needed to analyze in order to know
the students’ ability. The good achievement test is a test that has moderate
degree of difficulty, not too difficult and not too easy. If the test is too easy
then the test could not distinguish between students’ who have high-ability
with the students’ who have low-ability because the test item can be answered
correctly by all students.
The distractor is usually found in the objective test or multiple-choice
test, which multiple-choice test have the correct answer and distractor
answers. Distractors are used to mislead the test participants to choose the
correct answer. The good test item is the test that will be answered evenly by
students who choose the wrong answer.
The aspect of test item such as validity, reliability, discrimination
index, level of difficulty and the effectiveness of distractor is analyzed to
know the quality of the test that made by the teacher. The result of analysis is
used to assess the students and give achievement to students. The results of
analysis can indicate the overall quality of the test. The good test item can be
saved and archived in to storage test/question bank, moderate test item is
D. Research Paradigm
Figure 1. Research Framework Scheme Final Examination Economics
Subject in Grade XI IPS
Question Framework, Final Exam Question Test, Answer Key, and
Students’ Answer Sheet
Test Item Analysis
Discrimination index
Moderate Test Item (question)
Difficulty Level
Distractors Effectiveness Reliability
Validity
Analysis Result
Good Test Item (questions)
Poor Test Item (questions)
Revised Saved in
Question Bank
E. Research Questions
Based on research framework and research paradigm above, the
research questions are:
1. How does the validity level of the test item in the Final Examination at
Economics Subject in Grade XI IPS SMA Negeri 10 Yogyakarta
Academic Year of 2014/2015?
2. How does the reliability level of the test item in the Final Examination at
Economics Subject in Grade XI IPS SMA Negeri 10 Yogyakarta
Academic Year of 2014/2015?
3. How does the discrimination index of the test item in the Final
Examination at Economics Subject in Grade XI IPS SMA Negeri 10
Yogyakarta Academic Year of 2014/2015?
4. How does the difficulty level of the test item in the Final Examination at
Economics Subject in Grade XI IPS SMA Negeri 10 Yogyakarta
Academic Year of 2014/2015?
5. How does the effectiveness of distractors of the test item in the Final
Examination at Economics Subject in Grade XI IPS SMA Negeri 10
Yogyakarta Academic Year of 2014/2015?
6. How does the quality of Final Examination at Economics Subject in
Grade XI IPS SMA Negeri 10 Yogyakarta Academic Year of 2014/2015
CHAPTER III RESEARCH METHODS
A. Research Design
This research was a quantitative descriptive research. The aim of this
research was to find the information and data that could be used to describe
the quality of test item in SMA Negeri 10 Yogyakarta, especially on
Economic Subject. This study used a quantitative approach because the data
obtained in numerical, so there was no manipulation or alteration of data. The
data obtained were analyzed using Anates program version 4.0.
B. Place and Time of The Research
This research was conducted in SMA Negeri 10 Yogyakarta which is
located at Jalan Gadean No. 5 Yogyakarta in April until November 2015.
C. Subject and Object of The Research
Subject in this research were the students of class XI IPS in SMA 10
Yogyakarta that consist of two classes. Detail the number of research subject
as follows:
Table 1. The Number of Research Subject
Grade Number of Students
XI IPS 1 22
XI IPS 2 21
While the object of this research was the question test Final
Examination in Economics Subject in Grade XI IPS SMA Negeri 10
Yogyakarta Academic Year of 2014/2015.
D. Research Variables
The variables in this research was test item analysis of final
examination on Economics subject that viewed from the aspect of validity,
reliability, discrimination index, level of difficulty, and effectiveness of
distractor.
E. Operational Definition of Research Variables
Based on the research variables above, there was the explanation for
each variable:
1. Validity
Validity is a level of test whether the test result obtained meet all of
the requirements qualified test. A good test is a test that has high validity.
A valid test can measure accurately what should be measured. The
validity of the test is seen from the overall test and each test item.
2. Reliability
Reliability of achievement test is consistency level of an
instrument. The test is said to be reliable if test shows the consistency
when it tested more than once time in the same group but in different