Full Terms & Conditions of access and use can be found at
http://www.tandfonline.com/action/journalInformation?journalCode=cbie20
Download by: [Universitas Maritim Raja Ali Haji] Date: 19 January 2016, At: 20:20
Bulletin of Indonesian Economic Studies
ISSN: 0007-4918 (Print) 1472-7234 (Online) Journal homepage: http://www.tandfonline.com/loi/cbie20
Survey of recent developments
David J. Ray
To cite this article: David J. Ray (2003) Survey of recent developments, Bulletin of Indonesian Economic Studies, 39:3, 245-270, DOI: 10.1080/0007491032000142746
To link to this article: http://dx.doi.org/10.1080/0007491032000142746
Published online: 03 Jun 2010.
Submit your article to this journal
Article views: 77
View related articles
SURVEY OF RECENT DEVELOPMENTS
David J. Ray*
Nathan Associates, Jakarta
ISSN 0007-4918 print/ISSN 1472-7234 online/03/030245-26 © 2003 Indonesia Project ANU
DOI: 10.1080/0007491032000142746
SUMMARY
Despite a bomb attack in Jakarta in August, the main financial indicators of macroeconomic health have contin-ued to improve. Inflation is much lower than in 2002, and the exchange rate has remained fairly stable. Public debt as a percentage of GDP continues to fall, and foreign exchange reserves to increase. Deposit and money market interest rates have declined further, although this has yet to translate into significantly lower lending rates. Share prices have also been increasing rap-idly, and Moody’s recently upgraded Indonesia’s credit ratings. The markets responded calmly to the largely politi-cal decision to terminate the IMF pro-gram at the end of 2003, reassured by a relatively conservative budget for 2004, and by the articulation of a longer-term strategy of balancing the budget by 2005.
Market optimism may be running ahead of reality, however. Growth remains modest at around 3.5–4% and has been driven largely by consump-tion spending. New investment contin-ues to lag, mainly because of ongoing legal and political uncertainty, although there are signs of increased activity in the property sector. Recent export performance has been relatively strong, but growth has been driven by just a few primary commodities. Within manufacturing, the share of labour-intensive exports has fallen
from about one-half in 1995 to a third in 2002, providing cause for concern in relation to the expansion of job oppor-tunities—and thus poverty reduction.
There have been signs of resurgent protectionism in trade policy. New bar-riers were imposed on imports of tex-tiles and exports of wood products, while new cartel arrangements for key agricultural commodities were for-malised with other regional producers. Many other protectionist measures have also been proposed, including further restrictions on large-scale retailers, tariff increases for soybeans and steel, and new non-tariff barriers on key agricultural imports.
The complex impact of decentralisa-tion on the welfare of the public can be seen in the often contradictory responses of the central and regional governments to this process. The latter continue to introduce problematic new regulations that are inefficient and dis-torting, or that conflict with higher-level legislation. Although the centre is entitled to require rescission in such cases, it has been relatively ineffective in doing so. On the other hand, in the case of ports sector regulation, it is the regional governments that are show-ing themselves to be more concerned to implement policy changes likely to improve the performance of this cru-cially important part of Indonesia’s physical infrastructure.
TERRORISM AND ITS IMPACT
Terrorism again left its mark on the political landscape in Jakarta during the period covered by this survey. After a series of smaller explosions ear-lier this year, on 5 August a suicide bombing attack at the Marriott Hotel in Jakarta left 11 people dead and dozens injured. This was the most serious ter-rorist incident since the Bali bombing in October 2002. The blast was also unexpected, as the Marriott was con-sidered to have one of the best security systems of the capital’s five-star hotels and, notably, had been the venue for the US Embassy’s Independence Day celebrations a few weeks earlier.
Initially, concerns focused on the economic impact of the blast. These were fuelled by expectations of a slump in the retail and hotel sector as well as by concerns that manufactur-ing orders would be diverted else-where, that a ratings review by Moody’s Investor Service would be delayed and that the recent impressive gains on the Jakarta Stock Exchange (JSX) would be wiped out. However, within a few weeks it became clear that the direct economic impact would be minimal. The retail and hotel sector bounced back quickly. There was no real evidence of orders lost in manu-facturing, and the review by Moody’s went ahead as planned. Moreover the JSX composite index recovered quickly, with the bombing seen as creating a buying opportunity in an otherwise bullish market. On the other hand, the impact on investor perceptions, although unquantifiable, is unlikely to have been insignificant. In an economy in which investment in new capital continues to languish, this new attack was a further setback to economic recovery.
The main impact of the bombing appears to be more political than
eco-nomic. Immediately afterwards the Minister of Defence, with the support of senior military officers, announced a proposal for a Singapore-styled Inter-nal Security Act. The proposal was widely opposed, mainly due to fears of a return to Soeharto-era authoritarian-ism.1It was later abandoned in favour
of another to revise the newly enacted anti-terror law (Law 15/2003) to give more power to the military to deal with the ongoing terrorist threat (JP, 21/8/03).
More generally, the public’s abhor-rence of the bombing (most killed at the Marriott were Indonesian nation-als, mainly taxi drivers and security guards) appears to have strengthened the resolve of the government to deal with the problem of terrorism. Presum-ably because of concern about political sensitivities, the government has yet to publicly acknowledge the existence of Jemaah Islamiah, the group that appears to have been responsible for both this and the Bali bombings.
THE MACROECONOMY Improving Macroeconomic Fundamentals
Improvements in Indonesia’s macro-economic fundamentals have both driven and been driven by stronger market sentiment. These improve-ments are evident across a wide range of macroeconomic indicators.
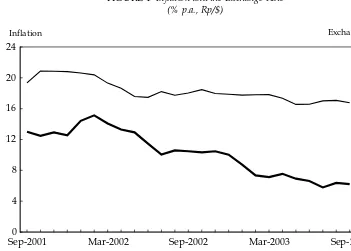
Inflation continued its downward trend through July, and then increased over the next two months to 6.2% by the end of September, down from 10.5% in the same month in the previ-ous year (figure 1). It is expected to be in the 6–7% range for the calendar year. The exchange rateweakened slightly in mid-year before strengthening again; by September the rupiah had appreci-ated by about 7% against the US dollar
in the preceding 12 months (figure 1).
Public debtis down from an average of 94.4% of GDP in 2000 to 72% in mid 2003, largely as a result of the strength-ening of the currency, which reduced the rupiah value of foreign debt. The target ‘safe level’ as specified in the new State Finance Law (17/2003) is 60% of GDP (see Ginting, this issue).
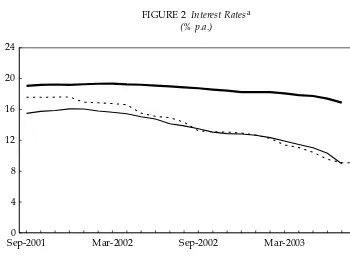
International reserveshave been increas-ing considerably, from $27.7 billion in January 2002 to $34.0 billion in Sep-tember 2003. Nominal interest rateshave continued to fall with declining infla-tion (figure 2). The one-month Indone-sia Bank Certificate (SBI) rate, which was once an administered rate but now reflects market rates fairly closely, has fallen steadily from 17.6% in December 2001 to 8.7% in September 2003, and is expected to fall even further by year end.
Economic Growth
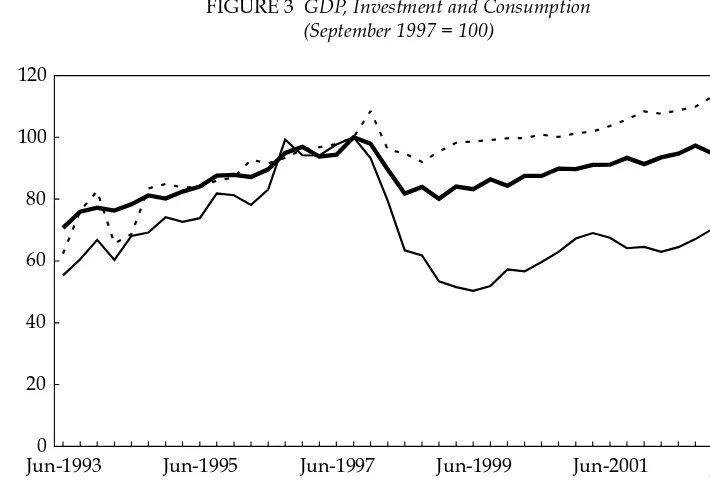
Since June 2002, GDP growth has remained relatively stable, recording year-on-year quarterly growth rates in the 3.5–4.4% range, and leading Waslin (2003) to note the ‘worrying sign’ that Indonesia may be settling into a medium–low growth equilibrium. In the first six months of 2003, this trend toward stable but modest growth con-tinued (figure 3). Year-on-year growth in the second quarter of 2003 was 3.8%, or 3.6% for the first semester.
This could be viewed as disappoint-ing given the improvements in vari-ous macroeconomic indicators noted above. On the other hand, the fact that growth remains relatively consistent and stable in the face of serious inter-nal and exterinter-nal shocks—such as the outbreak of Severe Acute Respira-tory Syndrome (SARS) and the rising FIGURE 1 Inflation and the Exchange Rate
(% p.a., Rp/$)
Sep-2001 Mar-2002 Sep-2002 Mar-2003 Sep-2003
0 4 8 12 16 20 24
0 2,000 4,000 6,000 8,000 10,000 12,000
CPI inflation Exchange rate
Inflation Exchange rate
Source: CEIC Asia Database.
threat of terrorism—can be seen as a reflection of the economy’s continuing resilience.
Interpretations aside, there is little argument that Indonesia needs to raise its rate of growth in a sustained manner if it is to reduce poverty. The government itself has noted in the announcement of its post-IMF eco-nomic strategy (encapsulated in a doc-ument known as the White Paper; GOI 2003) that 4% annual growth is insuffi-cient to achieve its economic and social goals. Waslin (2003) mentions the widely accepted rule of thumb that Indonesia needs to grow at about 6% p.a. if it is to absorb the 2–2.5 million new labour market entrants each year. In a more considered variation of this rule, Islam and Nazara (2000) argue that the employment elasticity ranges from 0.50 to 0.66, depending upon
assumptions. This means that generat-ing employment for 2 million new labour market entrants each year only requires growth in the 3.5–4.7% range. The notion that there is a fixed relation-ship between output and employment is somewhat misleading, however, as it implicitly takes real wages as given. The labour market overall (especially the informal sector) is highly flexible (Manning 2000), so that any lack of growth in the economy in the face of an increasing labour force tends to result in lower real wages rather than unemployment. The point remains, however, that poverty cannot be over-come unless growth is accelerated.
Consumption. Growth continues to be driven in most part by consumption (table 1). Although government con-sumption has been growing rapidly, private consumption commands about FIGURE 2 Interest Ratesa
(% p.a.)
Sep-2001 Mar-2002 Sep-2002 Mar-2003 Sep-2003
0 4 8 12 16 20 24
SBIs Time deposits (ave.) Working capital loans (ave.)
aAll rates are for one-month maturities.
Source: CEIC Asia Database.
70% of GDP, and accounted for almost all (88%) of GDP growth in the year to June 2003. It is expected that private consumption will continue to drive GDP growth into 2004, fuelled by declining interest rates as well as spending by the political parties in support of their election campaigns.
Various other indicators suggest that private consumption remains robust. Motor vehicle sales as reported by Gaikindo, the automobile produc-ers’ association, were up 10% year-on-year in the first semester of 2003. Even more striking, during the January– August period motorcycle sales increased by 20% year-on-year, sug-gesting that increased spending is not limited to the urban middle and wealthy classes. Retail sales fell at the beginning of the year but rebounded strongly (by 14%) over February–July,
according to the Bank Indonesia (BI) retail sales index. Domestic sales of electronic goods were reported to be particularly robust in the latter months of the first semester (Bisnis Indonesia, 20/6/03).
Investment. In first semester 2003, investment spending (that is, gross fixed capital formation) was up 13.0% year-on-year, although it is still at much the same level as in the first half of 2001, and only about two-thirds of the levels achieved just before the com-mencement of the crisis in mid 1997. At around 21–22% of GDP, investment is still far below the 30–35% range typical of the mid 1990s. There are reports of a pick-up in housing investment spurred by lending rate cuts and expectations of further cuts in the near future, given that housing loans usually have vari-able rates that adjust in line with rates FIGURE 3 GDP, Investment and Consumption
(September 1997 = 100)
Jun-19930 Jun-1995 Jun-1997 Jun-1999 Jun-2001 Jun-2003
20 40 60 80 100 120
GDP Investment Private consumption
a‘Investment’ is gross fixed capital formation.
Source: CEIC Asia Database.
in the market (Kompas, 29/7/03; Asia Pulse/Antara, 13/8/03). However, most other indicators suggest that invest-ment is continuing to lag.
• Although foreign investment ap-provals for the first eight months of 2003 were up 23.4% year-on-year to $5.0 billion (from a relatively low base), the Investment Coordinating Board (BKPM) reports that much of this reflects a change of status of companies from domestic to foreign-owned, rather than investments in new projects or expansions. Offset-ting this increase in foreign direct investment (FDI) was a 14.1% fall in domestic approvals over the same period to Rp 14.0 trillion.
• There has been considerable fund-raising activity in the local bond
market over the past year, but this has not translated into higher invest-ment. Data issued by Bapepam, the capital market supervisory agency, show that over the year to June 2003 bond issuances increased by 49.7%. However capital market players interviewed for this survey estimate that over 80% of new issues have been for refinancing purposes rather than for expansions or new invest-ment.
• A business perceptions survey of 693 CEOs conducted by the Dana-reksa Research Institute in July 2003 shows that the index of current cap-ital investment fell significantly dur-ing the first five months of 2003, from 110.9 in January to 99.7 in May. The index measuring expectations TABLE 1 Components of GDP Growth
(1993 prices; % p.a. year-on-year)
Mar-02 Jun-02 Sep-02 Dec-02 Mar-03 Jun-03
GDP 2.7 3.9 4.3 3.8 3.5 3.8
By expenditure
Private consumption 5.6 4.9 3.9 4.5 3.9 4.7
Government consumption 6.6 9.0 16.9 17.9 7.0 9.2
Investment –8.9 –4.6 4.6 8.9 6.9 4.9
Exports –4.5 –6.5 2.6 4.4 0.7 0.2
Imports –25.7 –20.8 2.9 19.8 9.4 –2.2
By industry sector
Agriculture, livestock, forestry
& fisheries –3.1 3.9 3.8 2.4 4.3 1.6
Mining & quarrying –1.5 2.2 2.7 5.7 –0.8 4.4
Manufacturing 5.6 3.9 4.1 2.4 2.3 2.8
Manuf. excl. petroleum & gas 6.3 4.1 4.2 2.4 3.6 4.1
Electricity, gas & water supply 8.0 3.1 4.5 9.1 5.7 7.5
Construction 1.9 3.2 5.4 5.9 5.3 5.2
Trade, hotels & restaurants 2.7 3.3 4.7 3.7 4.3 4.6
Transport & communication 8.9 8.8 7.5 6.2 6.8 7.3
Financial, rental & business
services 4.4 5.2 5.8 6.8 6.2 5.8
Services 2.7 1.8 1.6 1.8 2.0 2.2
of capital expenditure six months ahead also fell slightly during this period, from 119.3 to 116.6.
• Flat growth in capital goods imports also suggests little or no growth in new investment. The Standard International Trade Classification (SITC) import categories 71–74 cover many of the key capital goods required for Indonesia’s manufac-turing industry. For the period January–April 2003, such imports in aggregate fell 3% year-on-year, to $1.34 billion.2
There is continuing evidence that more investment is flowing out of than into Indonesia. News of factory reloca-tions to other countries continues to appear in the media (see, for example,
JP, 27/8/03). The Chinese authorities reported a 113% year-on-year increase in Indonesian investment in China during the January–May period, with approvals valued at $264 million. More significantly, the World Investment Report released in September shows that Indonesia was the only country in the region to record a net outflow of FDI ($1.5 billion) in 2002, with some consolation to be found in the fact that this had fallen considerably from $3.2 billion in 2001 (UNCTAD 2003).
One common explanation for the low level of investment is that it is being discouraged by downwardly sticky lending rates. As can be seen from figure 2, while SBI rates have fallen below 9%, lending rates remain stubbornly high at around 16–17%. This could be the result of a number of factors.3First, it may be a function of
continuing bank trauma following the crisis, with banks preferring to increase their interest spreads as deposit rates fall—at least in the short term—in order to strengthen their relatively fragile balance sheets, rather than expanding them. Second, and also as a
result of the high level of defaults experienced during the crisis, banks may now be building higher risk pre-miums into their corporate loan pric-ing. Third, given the relatively fragile nature of the recovery in Indonesia, banks may be wary of a sudden rever-sal in sentiment resulting in large capi-tal outflows, leading to a disruptive fall in the value of the rupiah. Finally, banks are presumably reluctant to expand their lending significantly when it has been demonstrated clearly that the courts cannot be relied upon to protect their property rights, and when the political environment is in a state of flux. In this sense, the explanation for the failure of the banking system to be more supportive of new investment does not lie entirely within the banking sector itself.
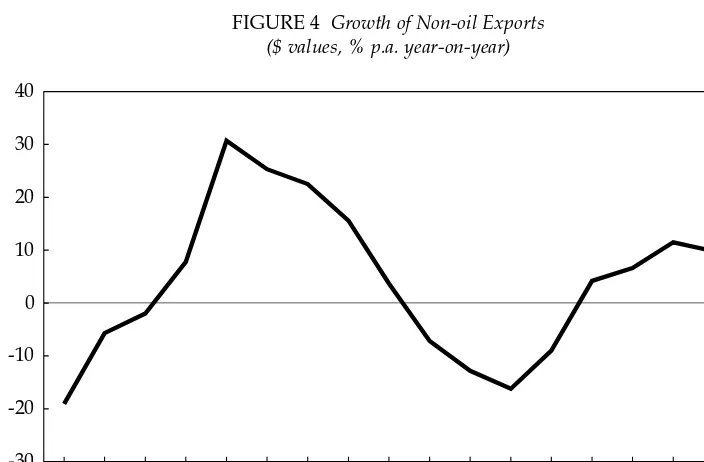
Exports. For the period January–July 2003, exports were up 9.8% year-on-year to $35.6 billion. Oil and gas exports grew very rapidly, by 20.2%; non-oil exports also grew quite strongly, by 7.2%, over the same period. This tends to overstate recent performance, however, because non-oil exports were well below trend in the first quarter of 2002, thereby enhancing year-on-year growth in the following year. It is worth noting that although the recovery from the 2001 downturn gathered momentum in the second half of 2002, by the second quarter of 2003 this had tapered off, with year-on-year quarterly growth falling to 3.4% (figure 4).
Comparison of more highly disag-gregated data for the first semester of 2003 and the corresponding period in 2002 shows that non-oil export growth, amounting to $1.2 billion (5.4% year-on-year), has been driven by just a few commodities. Using Harmonised Sys-tem (HS) two-digit trade data covering some 97 export categories, the largest
absolute increases were in animal and vegetable oils (HS 15) (essentially palm oil, $424 million); metal ores (HS26) (mainly nickel, $350 million); rubber (HS 40) ($294 million); and copper (HS 70) ($131 million). These impressive results were driven by both price and volume increases. Growth in these four categories alone accounted for the entire increase in total non-oil exports.4
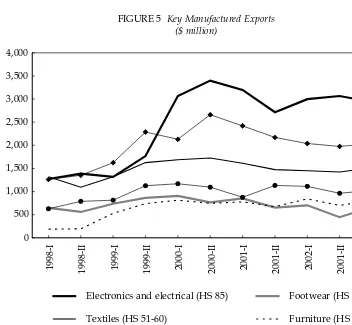
Of considerable concern is the fact that Indonesia’s key manufacturing exports continue to struggle (figure 5). Labour-intensive exports of textiles, garments and footwear in the first semester of 2003 were all up slightly year-on-year, but well below levels achieved in 2000 and 2001. Other key manufacturing exports such as furni-ture, paper and plastics were also up slightly, but exhibit flat or declining levels over a two to three year period.5
Electronics and electrical products (HS 85), which were a key driver of export growth during 1998–2000, have remained flat subsequently, rising at
first but then falling by 2% year-on-year in the first semester of 2003. If comparisons are made over longer time periods, a similar story emerges: growth has been driven by just a few key primary commodities—palm oil, rubber, cocoa, copper ore—while man-ufacturing exports have remained flat or have declined.
The out-performance of primary sector exports over manufacturing (albeit driven by just a few commodity groups) has important implications for the overall structure of Indonesia’s exports. In 1998, primary commodities accounted for 38.2% of total exports (including oil and gas). By January– April 2003 this had increased to 45.8%.6
To put it another way, manufacturing as a share of total exports fell from 61.8% to 54.2% over the same period.
Within manufacturing there has also been an important change in structure. Unskilled labour-intensive industries, encompassing mainly the textile, gar-ment, footwear and furniture sectors, FIGURE 4 Growth of Non-oil Exports
($ values, % p.a. year-on-year)
Mar-1999 Mar-2000 Mar-2001 Mar-2002 Mar-2003
-30 -20 -10 0 10 20 30 40
Source: BPS.
constituted 43.4% of manufactured exports in 1995.7 This had fallen to
33.9% by 2002. Almost all of the decline in the unskilled labour-intensive cate-gory over the 2000–02 period was driven by falls in garments, textiles, footwear and toys. This appears to confirm earlier reports, such as that of James, Ray and Minor (2003) on tex-tiles and garments, that various supply-side constraints are now seriously undermining competitiveness in these important industries.
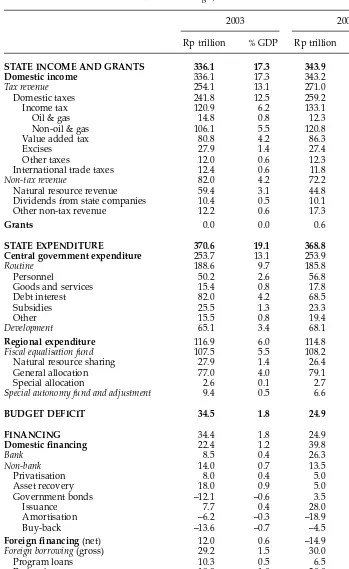
2004 Budget
The 2004 budget announced on 16 August is an important element in the post-IMF strategy to ensure fiscal sustainability in the medium term
(table 2). According to Finance Minis-ter Boediono, fiscal sustainability requires returning the budget to bal-ance by 2005 from a budgeted deficit of 1.8% of GDP in 2003 and 1.2% in 2004 (Bisnis Indonesia, 4/7/03).
The budget also makes clear the var-ious pressures and constraints con-fronting the government in the imme-diate post-IMF period. Most notable is the requirement to make large amorti-sation payments on foreign borrow-ings that, following cessation of the IMF program later this year, can no longer be subject to Paris Club resched-uling. Last year this facility allowed over Rp 27 trillion (roughly 1.4% of GDP) in foreign borrowings to be re-scheduled. In 2004, without this facil-FIGURE 5 Key Manufactured Exports
($ million)
F F
F F
F F
F
F F
F F
J J J
J J J
J
J J
J J
1998-I 1998-II 1999-I 1999-II 2000-I 2000-II 2001-I 2001-II 2002-I 2001-II 2003-I 0
500 1,000 1,500 2,000 2,500 3,000 3,500 4,000
Electronics and electrical (HS 85)
Textiles (HS 51-60)
F Garments (HS 61-63)
Footwear (HS 64)
Furniture (HS 94)
J Paper (HS 48)
Source: BPS.
TABLE 2 State Budget, 2003 and 2004
2003 2004
Rp trillion % GDP Rp trillion % GDP
STATE INCOME AND GRANTS 336.1 17.3 343.9 17.2
Domestic income 336.1 17.3 343.2 17.1
Tax revenue 254.1 13.1 271.0 13.5
Domestic taxes 241.8 12.5 259.2 12.9
Income tax 120.9 6.2 133.1 6.6
Oil & gas 14.8 0.8 12.3 0.6
Non-oil & gas 106.1 5.5 120.8 6.0
Value added tax 80.8 4.2 86.3 4.3
Excises 27.9 1.4 27.4 1.4
Other taxes 12.0 0.6 12.3 0.6
International trade taxes 12.4 0.6 11.8 0.6
Non-tax revenue 82.0 4.2 72.2 3.6
Natural resource revenue 59.4 3.1 44.8 2.2
Dividends from state companies 10.4 0.5 10.1 0.5
Other non-tax revenue 12.2 0.6 17.3 0.9
Grants 0.0 0.0 0.6 0.0
STATE EXPENDITURE 370.6 19.1 368.8 18.4
Central government expenditure 253.7 13.1 253.9 12.7
Routine 188.6 9.7 185.8 9.3
Personnel 50.2 2.6 56.8 2.8
Goods and services 15.4 0.8 17.8 0.9
Debt interest 82.0 4.2 68.5 3.4
Subsidies 25.5 1.3 23.3 1.2
Other 15.5 0.8 19.4 1.0
Development 65.1 3.4 68.1 3.4
Regional expenditure 116.9 6.0 114.8 5.7
Fiscal equalisation fund 107.5 5.5 108.2 5.4
Natural resource sharing 27.9 1.4 26.4 1.3
General allocation 77.0 4.0 79.1 3.9
Special allocation 2.6 0.1 2.7 0.1
Special autonomy fund and adjustment 9.4 0.5 6.6 0.3
BUDGET DEFICIT 34.5 1.8 24.9 1.2
FINANCING 34.4 1.8 24.9 1.2
Domestic financing 22.4 1.2 39.8 2.0
Bank 8.5 0.4 26.3 1.3
Non-bank 14.0 0.7 13.5 0.7
Privatisation 8.0 0.4 5.0 0.2
Asset recovery 18.0 0.9 5.0 0.2
Government bonds –12.1 –0.6 3.5 0.2
Issuance 7.7 0.4 28.0 1.4
Amortisation –6.2 –0.3 –18.9 –1.0
Buy-back –13.6 –0.7 –4.5 –0.2
Foreign financing (net) 12.0 0.6 –14.9 –0.7
Foreign borrowing(gross) 29.2 1.5 30.0 1.5
Program loans 10.3 0.5 6.5 0.3
Project loans 18.9 1.0 20.0 1.0
International bonds 0.0 0.0 3.5 0.2
Net instalments on principal –17.3 –0.9 –44.9 –2.2
Due –44.3 –2.3 –44.9 –2.2
Rescheduling 27.0 1.4 0.0 0.0
ity, amortisation of foreign debt will increase by 160% to Rp 44.9 trillion (2.2% of GDP) from Rp 17.3 trillion (0.9% of GDP) in 2003. Moreover, a large portion of government bonds issued in 1999 to recapitalise banks will also be maturing in the coming fiscal year, driving amortisation payments of domestic debt from Rp 6.2 trillion in 2003 to Rp 18.9 trillion in 2004.
With much larger debt-servicing requirements, and with no access to IMF loans or the rescheduling facility, the financing plan for the 2004 budget is very different from that of the previ-ous year. The primary source of fund-ing will be through drawfund-ing down Rp 26.3 trillion in government deposits in domestic banks, up from Rp 8.5 tril-lion in 2003.8Domestic bond issuance
will also increase sharply, but after rolling over the bank recapitalisation bonds that mature in 2004, net issuance will be limited to Rp 3.5 trillion. A fur-ther Rp 3.5 trillion (about $400 million) will be sourced through issuance of government bonds internationally. Other elements of the financing plan reflect a healthy degree of realism and pragmatism. For example, pledges from official sources (program loans plus project loans in table 2) fall from Rp 29.2 trillion to Rp 26.5 trillion, sug-gesting no presumption of improved access to soft loans through official sources such as the Consultative Group on Indonesia (CGI). Receipts from pri-vatisation and other asset sales are down from a budgeted Rp 26 trillion in 2003 to Rp 10 trillion in 2004, reflecting in part the difficult political environ-ment for asset sales in the period approaching the 2004 election, and also the fact that the Indonesian Bank Restructuring Agency (IBRA) will be wound up at the end of 2003.
Given the strategy of achieving fis-cal sustainability in the medium term,
the budget is necessarily conservative. Overall expenditure is projected to fall 0.5% from Rp 370.6 trillion in 2003 to Rp 368.8 trillion in 2004. Lower interest and subsidy payments have been offset to a certain extent by modest increases in routine expenditure on personnel, goods and services and other items. Development expenditure has increased only marginally, while transfers to the regions have fallen slightly.
As expected, critics of the budget have complained that it fails to provide sufficient fiscal stimulus (Bisnis Indone-sia, 21/7/03; JP, 21/8/03). Minister Boediono responded that under the country’s present straitened circum-stances the only way to accommodate any substantial expansion in expendi-ture would be through an increase in debt, which would be contrary to the core objective of the budget and to the government’s longer-term fiscal strat-egy as set out in the post-IMF program White Paper. The best and ‘safest’ form of economic stimulus, he maintained, would be private investment spurred by improved macroeconomic funda-mentals (Kompas, 22/7/03: 13).
IMF Exit and Post-program Monitoring
With elections looming in the first half of 2004, it came as no surprise that the government announced in late July that it would not extend the current IMF program, which is scheduled to finish at the end of 2003. The announce-ment brings to a close one of the IMF’s more controversial assistance programs—its only remaining pro-gram from the 1997–98 Asian financial crisis.
Within days of this decision the gov-ernment also announced that it would accept post-program monitoring by the IMF, under which Indonesia would
exit stand-by status but would engage in a policy dialogue with the IMF, which would continue to send teams to Jakarta twice a year to review progress toward achieving the set of reforms and targets articulated in the White Paper. All remaining debts to the IMF, now totalling $9.2 billion, would be paid off over a period of seven years.
As with the question of whether to discontinue the IMF program, there was considerable and sometimes emo-tional public debate surrounding the choice of an appropriate exit strategy. The anti-IMF position—most publicly represented by the chair of the Na-tional Development Planning Agency (Bappenas), Kwik Kian Gie, various elements in parliament (particularly the budgetary commission) and a vocal group of nationalist economists under the banner of the Indonesia Bangkit group9—was to emphasise
that the government does not need post-program monitoring to ensure credible economic policy making. To escape the need for IMF monitoring, this group lobbied in favour of using some of the country’s large foreign exchange reserves to repay the entire outstanding debt to the IMF.10
While the idea of full repayment has not been dismissed outright, the gov-ernment is averse to changing the maturity profile of its IMF debts. Aware of the fragile nature of market sentiment toward Indonesia and the likely political turbulence ahead, it is reluctant to run down its foreign exchange reserves when they might be required if the rupiah comes under selling pressure (JP, 29/7/03). More-over, various officials have noted that it makes little economic sense to repay these low-interest loans when they are generating positive spreads in the cap-ital markets (Kompas, 31/7/03).
Market Sentiment: Short versus Long Run
One of the more interesting aspects of the Indonesian economy in 2003 is the strength of financial market sentiment in the face of ongoing political con-cerns. As a direct result of improve-ments in many of the main macro-economic indicators described earlier, Moody’s upgraded Indonesia’s sover-eign debt ratings from B3 to B2 on 30 September 2003. Yet by most calcula-tions, the increased threat of terrorism and the escalating military campaign against separatists in the resource-rich province of Aceh should have had a negative impact on the markets. The same could be said of the largely polit-ical decision to end the IMF assistance program at the end of 2003, and the prospect of a long and potentially dis-ruptive national election program in 2004. It is therefore perhaps surprising that Indonesia had one of the strongest equity markets worldwide in the January–mid October 2003 period, with the composite share price index increasing by 67% in rupiah terms, and by over 76% in US dollar terms. How-ever some key points need to be made with regard to this strong performance. First,it has been driven for the most part by large inflows of portfolio investment, the nature of which is inherently short-term in outlook. Sec-ond, investors are buying Indonesian equities due to a perceived reduction in risk—not because of more rapid eco-nomic growth or stronger earnings fundamentals. The lower risk premium simply means that investors are now more prepared to take advantage of low price–earnings ratios in equities, and of attractive interest rates (even after recent declines). Third and most importantly, with no pick-up in eco-nomic growth or physical investment and with company earnings remaining
flat or depressed, there is a sense that the market is getting ahead of itself. The Danareksa Research Institute sur-vey mentioned earlier found that all indicators of performance were down over the January–May period. These include indexes measuring perceptions of sales, profits, liquidity, utilisation rates, employment, capital expendi-ture, inventories and stocks of raw materials. The survey showed overall business sentiment falling, as was con-fidence in the government. Perhaps more significantly, all indexes measur-ing future prospects were also down.
What this suggests is that there is now a sharp contradiction between short and long-run sentiment and, per-haps, between local and foreign senti-ment. Short-run investment in existing equities is buoyant but, as noted ear-lier, longer-run investment in new physical capital continues to lag. The important lesson to be drawn from the economy’s performance over the past 12 months, therefore, is that macro-economic stability is a necessary, but not sufficient, condition for growth. Stronger growth also requires action across a broad range of other policy areas, such as efforts to improve both legal and political certainty. On the economic policy front, greater empha-sis is needed at the microeconomic level, in particular in areas involving competition and regulatory reforms to stimulate trade and investment activi-ties. Two such areas in urgent need of reform—sea ports and the supervisory arrangements governing local regula-tions—are discussed later.
TRADE POLICY
Continuing Signs of Resurgent Protectionism
Previous surveys have noted the trend toward protectionist and other
inter-ventionist measures in agricultural trade (Athukorala 2002; Alisjahbana and Manning 2002; MacIntyre and Resosudarmo 2003). This trend is con-tinuing in 2003, with new measures being extended to key industrial goods. Attracting most but not all of the attention with regard to these meas-ures is the Ministry of Industry and Trade and, in particular, its minister, Rini Suwandi.11 Over the past two
years the ministry has issued a number of new regulations and rulings on international and domestic trade pol-icy matters. These include a host of new restrictive import-licensing arrangements, export bans and licences, controls on domestic trade, proposals for re-regulating modern, large-scale retailing, and support and facilitation of cartel-like arrangements for key export commodities. The most common form of intervention is to impose non-tariff barriers rather than taxes and tariffs; the latter are the responsibility of the Ministry of Finance, which is much less inclined to protectionism, whereas non-tariff bar-riers fall directly under the authority of the Ministry of Industry and Trade.
In a review of Indonesia’s trade pol-icy over the past four years, the WTO praised the government’s efforts to lib-eralise in an adverse environment. However, the same report raised ques-tions about the recent move to re-impose a number of non-tariff barriers (in particular on imports of textiles), as well as requesting clarification of other measures such as valuation procedures as goods pass through customs, import licensing, and anti-dumping measures (JP, 2/7/03).
In 2003 the Ministry of Industry and Trade has introduced more restrictive measures on textile and clothing imports. These include the re-imposi-tion of an earlier ban on imports of
used clothing, which met fierce resist-ance from the provincial government of North Sumatra, where importing used clothes from Malaysia and other Asian countries is a major activity for the local trade sector (Bisnis Indonesia, 11/4/03). Another recent measure is a new ministerial ruling requiring textile imports to be verified at the port of ori-gin (by way of surveyor pre-shipment inspections). In the months following the implementation of this measure in June 2003 there were frequent reports of large consignments being held up at ports. This was due to coordination problems between the ministry, the customs service and the two inspection companies, PT Sucofindo and PT Sur-veyor Indonesia, as well as a general lack of understanding by importers of the new verification requirements (Bisnis Indonesia, 14/6/03: 1).
The Indonesian importers’ associa-tion, Ginsi, has argued that the verifi-cation measures for textiles have helped reduce smuggling (JP, 28/8/03: 13). However, textile and garment pro-ducers continue to complain that the new requirements have resulted in dis-ruptive delays in the shipping process, and that they have significantly raised the cost of imports, particularly for small consignments containing multi-ple items, since there is a flat inspec-tion fee for each item.12Producers are
also questioning the necessity of the procedures when there are already restrictive import-licensing arrange-ments, introduced in 2002, that pro-hibit non-producers (that is, traders) from importing textiles.
To protect soybean farmers, the Ministry of Agriculture has recently proposed increasing the tariff on imported soybeans from 0% to 27% (the current bound tariff rate). This raises concerns for the 2–3 million small-scale tahu (soybean curd) and
tempe (soybean cake) producers that tend to favour soybeans imported from the US over local soybeans because of their larger size and better taste. A recent study for the Partner-ship for Economic Growth (PEG) by Suriadinata (2003) argues that this group has little capacity to absorb any rise in the price of imported soybeans beyond 10–12%, since most consumers have little tolerance for higher tahuand
tempeprices. The study concludes that a hike in soybean tariffs could lead to widespread closures in the small-scale
tempe industry, and thus seriously restrict access to an important source of protein for poor and low-income groups.13
The Ministry of Industry and Trade has also been supportive of industry efforts to develop cartel-like arrange-ments for the export of key commodi-ties. In June 2003, for example, during a visit to Vietnam, Minister Suwandi oversaw the signing of an agreement between the Indonesian and Viet-namese coffee producer associations to cut coffee exports in an attempt to shore up international coffee prices (Bisnis Indonesia, 27/6/03).14 This
fol-lowed the formalisation of a similar arrangement with Malaysia and Thai-land in August 2002 to better control international rubber prices (Media Industri dan Perdagangan, 10.IX.2002: 11–12). In addition, the ministry has been working recently with white pep-per producers to form a joint market-ing board to better exploit Indonesia’s dominant position in the international market (Bisnis Indonesia, 11/6/03: 3).15
The ministry is also working on a new presidential decree to re-regulate large-scale modern retailing. The stated rationale for the decree is that present regulatory arrangements are no longer appropriate post-decentrali-sation, and that there is a need to
ensure that the licensing of large mod-ern retailers remains in the hands of the central government. The general concern is that local governments will deal directly with large retailers to the possible detriment of small-scale and traditional retailers, whom the min-istry would prefer to protect through zoning and other restrictions (Kompas, 9/8/03). It is interesting to note, how-ever, that a recent study by Akademika (2003) for PEG found that the impact of large modern retailers on traditional and small-scale retailers was relatively small, and that there was a strong posi-tive spillover effect for small retailers located within a radius of 1 km of a large modern retailer.
In an attempt to restrict trade in ille-gally cut timber, the Ministry of Indus-try and Trade introduced new export-licensing arrangements for wood prod-ucts in March (Ministerial Instruction 32/2003). This regulation states that only producers holding a current forestry product export licence issued by the ministry, and who are endorsed by a new body known as the Forestry Industry Revitalisation Board, may export such products. This is particu-larly burdensome for small producers who do not have established distribu-tion channels offshore, and who there-fore tend to rely on traders to export for them. These producers must now find a way of exporting directly— although many are now reclassifying their exports as non-wood products to circumvent the new regulations—so the regulations represent yet another unwelcome layer of bureaucracy for the struggling wood product export sector (Suriadinata 2003). The primary impact would appear to be to reallo-cate production from small firms to large, rather than to reduce the con-sumption of illegally cut timber.
Other proposals being considered
by the Ministries of Industry and Trade, Agriculture, and Finance include:
• an increase in tariffs on downstream steel products, following an increase in upstream tariffs in 2002 (Media Industri dan Perdagangan, No. 12.V. 2003);
• a three-month ban on rice imports (Kompas, 18/6/03);
• further restrictions on sugar imports (Kompas, 19/7/03);
• an export tax on leather, cocoa and rubber (Bisnis Indonesia, 23/7/03;
Kompas, 31/7/03); and
• non-tariff barriers on shallot imports (Bisnis Indonesia, 15/8/03).
Drivers of Protectionism
A confluence of factors drives the push toward more protectionist and distor-tionary trade policies. A common justi-fication for such trade interventions is the need to combat smuggling, but it is hard to imagine how measures such as import-licensing can be expected to help in this regard. Smuggling is sim-ply arbitrage driven by policy-induced price differentials between the world and domestic markets, so measures of this type—which increase these differ-entials—can be expected to result in more, not less, smuggling. Thus there are continuing reports that smugglers are simply finding new locations and different ways of bringing smuggled goods into the country (Kompas, 3/9/03). Over the past 18 months the Ministry of Industry and Trade has pushed for the re-introduction of pre-shipment inspections of all imports. Such a measure would probably reduce the extent of administrative smuggling (that is, through under-invoicing), but to the extent that it succeeds it also increases the incentive to switch to physical smuggling, avoiding the cus-toms service altogether.
Politics is another important factor. As the 2004 elections approach, the issue of protectionism is becoming increasingly politicised. One vocal pro-tectionist is the head of the Indonesian farmers’ association, Siswono Yudo-husodo—a seasoned Soeharto-era politician—who appears to be using the association to provide a political platform for his populist views. He argues that the present government has neglected agriculture and that con-siderably more protection for farmers is needed, following the example of Japan—regardless, apparently, of the detrimental impact on consumers of rice and other food commodities (edi-torial, Laksamana.Net, 29/8/03).
In recent months, calls from pro-ducer groups for increased agricultural protection are receiving greater atten-tion from key ministries. Soybean pro-tection is one example. Since the aboli-tion of tariffs on soybeans in early 1998 there have been persistent calls by farmer groups for increased protection, but it is only now as the election approaches that firm proposals for tar-iff increases have been submitted to the Ministry of Finance.
There is also a seemingly genuine concern within key ministries that Indonesia may have gone too far in lowering its tariffs and that, as a result, local farmers and other producers are too exposed to competition from lower-priced imports. This view in favour of increased protection is but-tressed by the fact that Indonesia’s average tariff level, at 7.2% in 2002, is well below the bound tariff level of around 40%. This leaves some scope for raising tariffs without falling foul of the WTO, and also allows greater flex-ibility in negotiating tariffs and other market access issues in the Doha round of trade negotiations (if this still pro-ceeds after the failure at Cancun) (Economist, 20–26 September 2003).
Feeding in to this argument that cur-rent tariff levels are not high enough is the populist view that recent tariff reductions have mostly been driven by outsiders, in particular the IMF, with the implication that these have not been in Indonesia’s best interests. Un-surprisingly, there are already calls for agricultural tariffs to be reviewed once the IMF program winds up at the end of the year (Kompas, 25/7/03). The post-IMF White Paper calls for Indone-sia to strive for self-sufficiency in key agricultural commodities such as corn and soybeans, and talks of setting tar-iffs, in effect, to enable the relevant industries to compete (GOI 2003: 52).
Losers and Gainers from Protectionist Policies
The underlying reality of many recent trade policy interventions is that they are being implemented to satisfy cer-tain sectoral interests rather than the interests of the broader community, including consumers and other pro-ducer groups (for example, down-stream users). The key test of trade pol-icy, like all forms of public polpol-icy, is its ability to generate a net benefit for the community as a whole, not just certain elements within it at the expense of others.
Consider, for example, the ban on the import of used clothing mentioned above. While in the interests of local factories producing for the domestic market, the ban is nevertheless detri-mental to the large population of low-income consumers whose expenditure on clothing represents an important claim on their disposable income. Like-wise, raising tariffs on soybeans may encourage farmers to substitute soy-beans for other crops, but it generates enormous costs for downstream pro-ducers and, of course, consumers of soybean products.
The capture of trade policy to
fit certain groups at the expense of the broader community is also evident in the new regulatory barriers to import-ing. There are now over 800 import lines governed by non-tariff barriers, in most cases import licences. A com-mon approach is to allow only licensed producers to import. However, this tends to disadvantage smaller firms (such as specialised garment produc-ers) that, given their smaller input requirements, find it more efficient to use traders than to import their inputs directly.
LOCAL GOVERNMENT REGULATIONS UNDER DECENTRALISATION
In 1999 Indonesia embarked on a com-prehensive and ambitious decentrali-sation program (Alm, Aten and Bahl 2001). Two laws were passed: Law 22/1999 on the devolution of govern-ment authority and Law 22/1999 on fiscal decentralisation. Both came into force in January 2001. Concerned to raise the level of own-source revenues within this new decentralised frame-work, local governments have been quick to legislate new taxes and charges and other types of exactions. Before decentralisation, local govern-ments had been constrained to a pre-scribed set of local taxes and charges as listed in Law 18/1997. SMERU (1999) and others noted that this helped to reduce distribution, transport and other business costs, particularly in the regions. Under pressure from local governments, Law 18/1997 was amended in 2000 to become Law 34/2000. The amended law gave local governments greater scope to develop new taxes and charges beyond those previously permitted.
A number of new local taxes and charges that have emerged since decentralisation are legally valid and
set at appropriate levels. Many others, however, are inefficient and distorting, and often conflict with higher-level legislation. In most such cases they are either user charges (retribusi) for which no tangible service is provided in exchange for payment or whose pric-ing is well above that required for cost recovery, or they are some form of reg-ulatory instrument (such as a licence or permit) for which there is no real pub-lic interest justification (Ray 2003).16
The distorting nature of problematic local regulations, or perda bermasalahas they are known, has been well docu-mented elsewhere (see, for example, Saad 2003; Pambudhi 2003), and the emergence of new perda bermasalahon virtually a weekly basis ensures that this issue is accorded continuous cov-erage in the press. While there is wide-spread awareness of the problem, little attention has been given to improving the institutional arrangements for supervision of local regulations.
Problems in the Present Supervisory Arrangements for Local Regulations
Under Law 34/2000 the onus for deter-mining the legality of local regulations on taxes and charges resides with the central government. Local govern-ments are required to submit new reg-ulations on local taxes and charges for review by an inter-ministerial team based at the Ministry of Finance, within 15 days of issuance.17The team
then sends its recommendations to the Ministry of Home Affairs, which has final authority to rescind problematic regulations and, if necessary, to instruct local governments to make stipulated amendments.
If a period of one month elapses without an objection from the Ministry of Home Affairs, the local regulation becomes effective immediately. If there is an objection, however—typically on public interest grounds, or on the
grounds that the local regulation duplicates or conflicts with higher-level legislation—then the regional government has one week to rescind the regulation upon notification by the centre. There are a number of problems with this system, however.
First, not all new local regulations are actually being submitted to the central government, partly because there are no sanctions for non-compli-ance. Lewis (2003) estimates the com-pliance rate to be around 40%.
Second, too much of the review bur-den is placed on the central govern-ment. As of August 2003, the inter-ministerial team had reviewed 1,528 local regulations on taxes and charges. At a typical weekly meeting, 20–30 reg-ulations are reviewed in just a few hours. The weight of numbers effec-tively precludes thorough analysis of the impact of new local taxes and charges. Moreover, reviews of regula-tions are rarely carried out within the stipulated time frame of one month. This complicates the rescission/revi-sion process, as the regulation in ques-tion has usually already been imple-mented by the time the review has been completed.
Third, many local governments are ignoring rulings from the centre on problematic local regulations.Only 22 of the 206 regulations rejected by the central government have been offi-cially rescinded at the local level; all others remain active. This is a matter of some tension between the Ministry of Finance and the Ministry of Home Affairs. The former is concerned that many distorting local taxes and charges that have been reviewed and recommended for cancellation never-theless remain in force; it would like to have the authority to impose economic sanctions on recalcitrant local govern-ments when and if necessary. The
Min-istry of Home Affairs prefers a more conciliatory approach, in most cases requesting—as opposed to instruct-ing—local governments to cancel local regulations.
Fourth, arrangements for the review of non-tariff regulations are inade-quate. Historically, non-tariff barriers in domestic trade, such as forced monopsonies, price controls, regional allocation of markets, and investment and export restrictions, have been very destructive of both the regional and national economies (SMERU 1999). Under decentralisation there are signs that some local governments are begin-ning to use non-tariff instruments to discriminate in favour of locals or cer-tain business groups and/or sectors (Ray 2003), but the inter-ministerial team is only authorised to review and make recommendations on regulations involving taxes and charges. Hence many discriminative local regulations and stipulations remain active.
PRIVATISATION,
DECENTRALISATION AND COMPETITION: THE CASE OF THE PORTS SECTOR
The development of any economy depends crucially on the extent to which the public sector complements— or hinders—the activities of the private sector. Many governments waste large amounts of productive resources by engaging in business activities that the private sector could otherwise be expected to undertake with much greater efficiency. At the same time, they often fail to devote sufficient resources to activities such as the pro-vision of public goods, including some types of infrastructure, on which the private sector must rely to facilitate access to its suppliers and customers. Moreover, governments frequently
underestimate the importance of creat-ing a competitive business environ-ment in which firms must strive to improve their efficiency and provide goods and services in keeping with their customers’ requirements.
All these considerations are relevant to three areas of policy making that have sprung to prominence in Indone-sia in the last several years: privatisa-tion, decentralisation and competition. Progress—or the lack of it—in all of these areas is neatly encapsulated in the case of the ports. As the world’s largest archipelagic nation, Indonesia requires a well-developed and effi-ciently run ports sector. Producer com-petitiveness in both national and inter-national markets is influenced to a sig-nificant extent by ports sector perform-ance. The provision of adequate port facilities is especially important in the outer regions, where the lack of trans-port facilities may diminish the incen-tive to produce an agricultural surplus that can be traded for other goods and
services, effectively condemning such regions to low-income autarky.
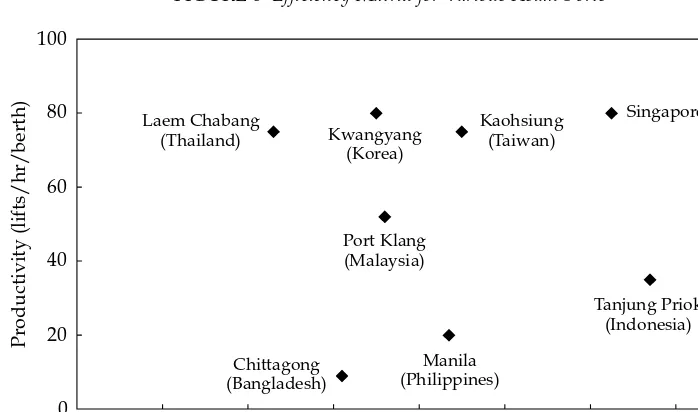
Despite its obvious critical impor-tance to the national economy, Indone-sia does not have a well-performing port system. The Jakarta International Container Terminal (JICT), for exam-ple, the main terminal at Indonesia’s largest port, Tanjung Priok, is one of the least efficient terminals in South-east Asia. Figure 6 charts productivity (number of containers lifted per hour) and unit costs (lift costs per laden dry 40-foot container) for some of the main ports in the Asian region. It can be seen that the more productive ports in the region, with about 75–80 lifts per hour, are far more productive than Tanjung Priok (35), whose unit cost is also higher than that of every other port shown.
But Tanjung Priok is one of Indone-sia’s better-performing ports. Simple averages of various port performance indicators suggest that the Indonesian port system as a whole is highly ineffi-Source: Overseas Shipping Representative Association (OSRA), Jakarta.
FIGURE 6 Efficiency Matrix for Various Asian Ports
F
F
F F
F
F F
F
0 20 40 60 80 100
0 20 40 60 80 100 120 140 160
Productivity (lifts/hr/berth)
Cost/lift ($) Laem Chabang
(Thailand) Kwangyang
(Korea)
Kaohsiung (Taiwan)
Chittagong (Bangladesh)
Port Klang (Malaysia)
Manila (Philippines)
Tanjung Priok (Indonesia)
Singapore
cient and in urgent need of upgrad-ing.18 For example, for all commercial
ports the simple average berth occu-pancy rate (an indicator of congestion) is now about 60%, well above the max-imum internationally acceptable stan-dard of 40%.19 Working time as a
per-centage of turnaround time is also very low, averaging 26% for ocean-going vessels and 37% for inter-island ves-sels.20
Instead of focusing on improving the functioning of the ports, govern-ment efforts to improve performance in the maritime sector currently focus on the perceived need to increase the size of the country’s cargo fleet, given the general concern that locally flagged vessels carry only 3–4% of Indonesia’s international sea cargo and about 50–55% of domestic sea cargo.21A
pro-posed Mortgage Law (Rancangan Undang-Undang Penjaminan Kapal) that would allow shipping companies to use the vessels they are purchasing as loan collateral is now being drafted by the Ministry of Transport (Bisnis Indonesia, 25/4/03). Other measures to improve shipping companies’ access to low-interest, long-term loans from non-bank financial institutions are also being considered (Bisnis Indonesia, 31/7/03).
There is no obvious reason to believe that Indonesia would benefit from having a larger domestically owned fleet, especially if this could only be achieved through measures such as subsidised loans. A more gen-uine problem is how to improve the overall efficiency of the sea transport of cargo, including cargo handling in the ports. Poor port performance, as reflected in the data described above, results in much time being wasted while vessels are either berthed or waiting for access to ports. For exam-ple, it takes around two days to sail
from Jakarta to Pontianak. Average turnaround time in Pontianak is a little under two days, while in Jakarta it is approximately three and a half days. This suggests that a ship on this partic-ular route would spend about three-quarters of its time in port.
As discussed below, lack of competi-tion is the crucial missing element in the ports sector, which is dominated by four large, and for the most part ineffi-cient, state-owned port operators, Indonesian Port Corporations (IPCs) I–IV, supported by a legal and regula-tory environment that effectively con-strains competition both within and among ports.
Port Privatisation: Jakarta
International Container Terminal
The sale of the two primary container terminals at Tanjung Priok and of another one at the port in Surabaya represents Indonesia’s first experience with port privatisation. These sales were initiated during, and influenced by, the economic crisis of the late 1990s. A key objective of the privatisation program was to raise funds to help fill a large gap in the government’s budget; other objectives—such as to improve efficiency, to introduce new technology and management, to provide capital for expansion and to foster competition—were of secondary importance (Ray and Blankfeld 2002).22
In 1999, following a competitive bid-ding process, Grosbeak, a subsidiary of Hutchison Port Holdings (HPH), acquired a 51% stake in the JICT. The following year, through another sub-sidiary, HPH was able to secure a 48% stake in the other major Jakarta termi-nal, Koja. By entering into contracts with two operators that are both sub-sidiaries of the same foreign company, the government clearly missed an opportunity to promote competition
within the port. The general view of users, therefore, is that privatisation simply resulted in the transfer of a monopoly from public to private hands, with no major improvement in port services. The two terminals have now been consolidated into one.
Recently there have been reports in the media of alleged abuse of market position by the JICT–Koja. A series of reports in Bisnis Indonesiain April doc-umented claims that the recently com-bined JICT–Koja terminal was threat-ening shipping lines that sent their ves-sels to the nearby conventional termi-nals at Tanjung Priok that they would later be denied access to its own con-tainer terminal (see, for example, Bisnis Indonesia, 19/4/02). The firm’s behav-iour has attracted the attention of the Competition Commission (KPPU), which announced in June 2003 that the JICT was one of seven cases under review for possible infringement of the anti-monopoly law (Law 5/1999).23
The government’s position, as stated by the Ministry of State-owned Enter-prises, is that the presence of other con-tainer terminals at Tanjung Priok (namely Multi Terminal Indonesia and Segoro Fajarsatyo) should ensure com-petition (Bisnis Indonesia, 15/1/03). The response of the major shipping lines has been to note that these termi-nals lack the capacity, depth and facili-ties to offer any real alternative to using JICT–Koja.
High costs at the major container terminal are at the core of a long-simmering dispute between port users (such as exporters and freight for-warders) on the one hand and the major foreign shipping lines that carry the bulk of Indonesian trade on the other. The dispute came to a head in September 2002 when, following increases in the JICT’s stevedoring rates, the shipping lines increased their
terminal handling charge by 15%, to $150 for a 20-foot container.24 In
response to pressure from port users, the Ministry of Transport issued a decree in October 2002 limiting the ter-minal handling charge to $93. The shipping lines maintained that they were unable to reduce the charge given the increase in JICT rates, arguing that even at the new higher rate a number of them were unable to cover costs. They were also reluctant to incorporate port costs into freight charges, since this would mean that port users could not distinguish between the two. The matter remains unresolved and contin-ues to attract the attention of the media. Curiously, most attention focuses on the high terminal handling charge imposed by the shipping lines, rather than on the underlying reasons for the high costs and charges of the JICT.
Decentralisation and the Regulation of Private Ports
Indonesia currently has around 1,400 private ports serving the needs of key sectors such as industry, mining and fishing. Some have facilities that are appropriate for only one or a small group of commodities (for example, chemicals), and have limited capacity to accommodate third-party cargo. Others have facilities that would be appropriate for a broad range of com-modities, including containerised cargo in some cases. However, according to the current maritime law (21/1992), these ports are forbidden to provide services for third-party cargo unless IPC ports in the region have insuffi-cient capacity to provide adequate port services or have been damaged by a natural disaster or other event; or unless there are no IPC ports in the region that can provide the required services.
When a private port isauthorised to
accommodate third-party cargo, it must then work closely with, and report to, the particular IPC that has the authority to regulate ports on that part of the coastline.25The IPC sets and
collects almost all fees and charges; to ensure that there is no price competi-tion, the charges that apply at its own port apply at the private port as well. Only 50% of mooring and wharfage fees are passed on to the private opera-tor, and almost all other fees are retained by IPC-II (Nasdion 2003). These arrangements are in conflict with the intention of Law 5/1999, the explanatory notes to which point out that in the past ‘the development of the private sector was adversely affected by various erroneous government poli-cies that caused market distortions’. They provide a good illustration of Thee’s contention ‘that in the past it was governments that were the major source of restrictions on competition, rather than anti-competitive practices of private firms’ (Thee 2002: 335).
There is now a major dispute between the central government, rep-resented by the Ministry of Transport, and a group of local governments, led by the city of Cilegon, in the newly established province of Banten over the authority to regulate private ports. The matter is complicated by conflicts between the maritime and decentrali-sation laws. The maritime law empow-ers the IPCs as the key port operators and regulators in the regions, while the decentralisation laws and regulations devolve most authority for ports to regional governments. This problem is not unique to the ports: many laws governing particular sectors have yet to be amended to accommodate the advent of regional autonomy. In short, the case of the ports sector is indicative of a wider issue related to decentralisa-tion: that despite the stated intention to
bring government closer to the people in order to make it more accountable to them, there is often a strong reluctance by the centre to yield control to regional governments.
The major complaint of local gov-ernments such as Cilegon is that according to the decentralisation law it should be they, and not the IPCs, that have the authority to regulate regional ports—in particular, the ports owned and operated by the private sector. They note that the IPCs impose various levies and charges on users of non-IPC ports, but provide little if any service in exchange for such payments.
Cilegon is located in the western part of Java. The district includes much of the coastline of the Sunda Strait, which is a major shipping lane. It is also an important centre for key manu-facturing activities such as steel, chem-icals and paper production. Despite its strategic location and its concentration of important industries, it does not have a major public sector port. The chief IPC port in Cilegon is Ciwanden, located near the city’s main industrial area. It is poorly equipped, however, and in need of major upgrading if it is to provide adequate port services to local industries. For these and other reasons, the district has within its bor-ders some 18 special ports developed for private industrial use. Unsurpris-ingly, the first by-law produced by this district government after decentralisa-tion concerned the administradecentralisa-tion and regulation of local ports (Local Regula-tion 1/2001).
The by-law has the stated objective of taking over key regulatory functions of the relevant IPC (IPC-II), and ultimately of promoting competition among district ports through deregula-tion. According to this by-law, private ports may now handle third-party cargo. The local government captures
20% of total mooring and wharfage fees, as opposed to the 50% taken by IPC-II before implementation of the new by-law. Other surcharges and handling fees have been liberalised, such that ports can now set fees and charges themselves. As well as freeing up the choice of ports, the government of Cilegon has developed its own pilot-ing and tugboat service to compete with the same services provided by IPC-II.
Cilegon is an important test case for the central government. Other local governments with private ports within their jurisdictions that are equipped to accommodate third-party cargo have issued similar by-laws, including the districts of Cilacap (1/2003) and Gresik (19/2001). Many others have been in contact with the city authorities in Cilegon, and are now considering sim-ilar legislation (Nasdion 2003). The central government initially responded by challenging the legality of the Cile-gon by-law. The Ministry of Home Affairs wrote to the mayor requesting that the by-law be withdrawn, but so far this and other requests have been refused. The Cilegon government has put a convincing case for its right to regulate private ports, and has fully exploited the relevant clauses in both the decentralisation and competition laws. By most calculations the by-law appears to be in the public interest, as it reduces port charges and introduces an element of competition into an otherwise monopolistic sector.
Aware of the general need to decen-tralise authority, and more specifically to respond to local government de-mands for a greater say in how ports within their jurisdictions are managed, the Ministry of Transport announced in September 2002 that 471 ports would be handed over to the regions (approximately 150 to provincial gov-ernments and 321 to district/municipal governments). However, all of these are relatively small piers made of wood and of no real commercial value. In response, following a meeting in Balik-papan in September 2002, 45 district/ municipal governments issued what has become known as the Deklarasi Balikpapan (the Balikpapan Declara-tion). Key elements include the rejec-tion of current narejec-tional laws and their supporting regulations governing pri-vate ports, and a proposal for a new ports law considered by the regions to be consistent with the decentralisation law.
Following a series of similar meet-ings in 2003, regional governments formed a team to draft a ‘judicial review’ challenging the legality of the maritime law and key supporting reg-ulations. This paper, along with sup-porting studies from the Institute for Economic and Social Research at the University of Indonesia and Bandung’s Padjadjaran University, was submitted to the Supreme Court (Nasdion 2003). The local governments concerned are now awaiting the decision of the court.
NOTES
* The author is working on a USAID-funded project in Jakarta. He gratefully acknowledges the help of William (Ted) James and William Wallace of PEG. The views expressed are those of the author and do not necessarily reflect those of USAID or the government of Indonesia. 1 See, for example, ‘ISA Not Needed to Fight Terrorism, Activists Say’, JP, 11/8/03.
2 At the time of writing, the latest data available at this level of aggregation were for April 2003.
3 The following discussion draws partly on James (2003).
4 It is also interesting to note that growth in these four categories easily exceeded the $806 million increase generated by the other 59 export categories register-ing positive year-on-year growth in the first semester of 2003.
5 Basri (2003) notes that this general upturn in key manufactured exports is SARS-related: buyers were diversifying away from China in the first semester. 6 For analysis of the sectoral composition
of exports, a more disaggregated, but longer-lagged, data set comprising nine-digit SITC data is used. Primary commodities are defined as SITC 0–4 and manufacturing as SITC 5–9. 7 Unskilled labour-intensive exports, as
defined by Klause (1987), include tex-tiles (SITC 65); glass and glass products (SITC 664–6); ships (SITC 793); sanitary, plumbing, heating and lighting fixtures (SITC 81); furniture (SITC 82); travel goods (SITC 83); apparel (SITC 84); plastic articles (SITC 893); toys (SITC 894); office supplies (SITC 895); and miscellaneous manufacturing (SITC 899).
8 It is understood that ‘domestic banks’ refers to commercial banks rather than the central bank. If instead the govern-ment drew down its deposits at BI, the impact on base money would be exactly the same as if it had borrowed from BI, and would need to be sterilised if it were not to be inflationary.
9 See MacIntyre and Resosudarmo (2003)
for a description of the Indonesia Bang-kit group.
10 Member countries with IMF debts in excess of $2.8 billion are required to adopt a post-program monitoring arrangement.
11 See, for example, the editorial in the Jakarta Post on 27 June 2003 (‘Is Rini Turning Protectionist?’) and an earlier article in the same paper (‘Rini’s Protec-tionist Trade Policies Criticized’, 23/6/03). The ministry’s policy of imposing strict non-tariff barriers on the import of sugar, as reported in the last survey by MacIntyre and Resosu-darmo (2003), has also attracted criti-cism from the Competition Commis-sion (JP, 13/6/03).
12 For each item under $2,500 in value the verification fee is $175, while for items in excess of $2,500 the fee is 0.85% of the value. See also ‘Produsen TPT Siap Tutup Pabrik’ [Textiles Producers Ready to Close Factories], Bisnis Indone-sia, 17/6/03.
13 According to Magiera (1994), tempe vides on average five times more pro-tein than meat for most Indonesians. 14 Similarly, Mines and Energy Minister
Purnomo Yusgiantoro has recently pro-posed the formation of a gas exporters’ cartel (Bisnis Indonesia, 11/7/03: 10). 15 Indonesia now supplies 80% of white
pepper worldwide.
16 Of the 206 local taxes and charges banned thus far by the central govern-ment, 82% were retribusi. Using a larger sample set, the KPPOD (2002) reviewed 693 local regulations issued over the 2000–02 period; of 492 that were prob-lematic, 70% concerned retribusi. 17 The team, established in June 2002 by
the Ministry of Finance, comprises a number of officials from the ministry, as well as others from the Ministries of Mines and Energy, Industry and Trade, Agriculture, Forestry, Transport, and Fisheries and Maritime Affairs (Ismail 2003).
18 Data on Indonesian port performance are difficult to acquire. The indicators discussed here are based on 1999 data