MODIFICATION OF INPUT IMAGES FOR IMPROVING THE ACCURACY
OF RICE FIELD CLASSIFICATION USING MODIS DATA
I Wayan Nuarsa12, Fumihiko Nishio1, And Chiharu Hongo1
Abstract.The standard image classification method typically uses multispectral imagery on one acquisition date as an input for classification. Rice fields exhibit high variability in land cover states, which influences their reflectance. Using the existing standard method for rice field classification may increase errors of commission and omission, thereby reducing classification accuracy. This study utilised temporal variance in a vegetation index as a modified input image for rice field classification. The results showed that classification of rice fields using modified input images provided a better result. Using the modified classification input improved the correspondence between rice field area obtained from the classification result and reference data (R2 increased from 0.2557 to 0.9656 for regency-level comparisons and from 0.5045 to 0.8698 for district-regency-level comparisons). The classification accuracy and the estimated Kappa value also increased when using the modified classification input compared to the standard method, from 66.33 to 83.73 and from 0.49 to 0.77, respectively. The commission err or, omission error, and Kappa variance decreased from 68.11 to 42.36, 28.48 to 27.97, and 0.00159 to 0.00039, respectively, when using modified input images compared to the standard method. The Kappa analysis concluded that there are significant differences between the procedure developed in this study and the standard method for rice field classification. Consequently, the modified classification method developed here is significant improvement over the standard procedure.
Keywords: rice field mapping, modified classification, temporal analysis, Modis
1
Center for Environmental Remote Sensing, Chiba University, Chiba 263 -8522, Japan
2
Agroecotechnology Department, Faculty of Agriculture, Udayana University, Bali
1. Introduction
Rice is the primary food source for more than three billion people and is one of the world’s major staple foods. Paddy rice fields account for approximately 15% of the world’s arable land (Khush, 2005; IRRI, 1993). A unique physical feature of paddy fields is that the rice is grown on flooded soils. This feature is significant in terms of both trace gas emissions and water resource management. Seasonally flooded rice paddies are a significant source of methane emissions (Denier, 2000), contributing over 10% of the total methane flux to the atmosphere (Pratheret al., 2001), which may have substantial impacts on atmospheric chemistry and
climate. Agricultural water use (in the form of irrigation withdrawals) accounted for ~70% of global freshwater withdrawals (Samad et al, 1992). Mapping the distribution of rice fields is important not only for food security but also for the management of water resources and the estimation of trace gas emissions (Xiao et al., 2005; Matthews et al., 2000). Therefore, more accurate data related to the total rice field area, its distribution, and its changes over time are essential.
Moderate Resolution Imaging Spectroradiometer (MODIS) instrument offers considerable potential for rapid and repetitive large-area crop classification given its near-daily global coverage of science-quality observations and products (Justice and Townshend, 2002), which are available at moderate spatial resolutions (250, 500 and 1000 m). Several studies have used multi-temporal MODIS data to classify specific crop types (Lobell and Asner, 2004; Doraiswamy et al., 2005; Chang et al., 2007; Potgieter et al., 2007; Wardlow and Egbert, 2008), cropping rotations (Mortonet al., 2006; Sakamotoet al., 2006; Brownet al., 2007; Wardlow et al., 2006), and crop-related land use practices (e.g., irrigation and fallow) (Wardlow and Egbert, 2008) as well as to monitor crop phenology (Sakamoto et al., 2005; Niel and McVicar, 2001) .
Image classification is one of the most popular remote sensing applications. This process primarily uses the spectral information provided in remotely sensed data to discriminate between perceived groupings of vegetative cover on the ground (Niel and McVicar, 2001). The spatial and temporal information included in single date and time series data usually plays a secondary role but can aid in the
classification procedure. The
discrimination of crops is usually performed with ‘supervised’ or ‘unsupervised’ classifiers. The basic difference between these types of classification is the process by which the spectral characteristics of the different groupings are defined (Atkinson and Lewis, 2000). Common classification algorithms include maximum likelihood,
minimum distance to mean, and
parallelepiped (Jensen, 1986). Research on classification algorithms to identify rice fields is widespread (Bachelet, 1995; Okamoto and Kawashima, 1999; Fang, 1998; Fanget al., 1998; Nielet al., 2003).
Agricultural rice fields have a large variety of land cover states that can range from water bodies just before rice transplanting to mixed water, vegetation, or bare soil just after harvesting. The use of a single procedure for rice field classification is difficult because of the high variability of rice field land cover states. The large variety of land cover states could cause increases in commission and omission errors, thereby decreasing overall accuracy. This is caused by non-rice field pixels being classified as non-rice field pixels while, at the same time, not all rice field pixels are correctly classified as rice fields (Lillesand and Kiefer, 2000). A standard image classification procedure is to only use a multispectral image from one acquisition date. In supervised classification, a training area is selected from this image and one of several image classification methods is then applied. In this study, we modified the input to the image classification process. We used the variance of three vegetation indices over time as an input to the rice classification procedure. The objective of this study was to compare the accuracy of rice field image classification between the standard method and the modified input method using reference data.
2. Data, and Method
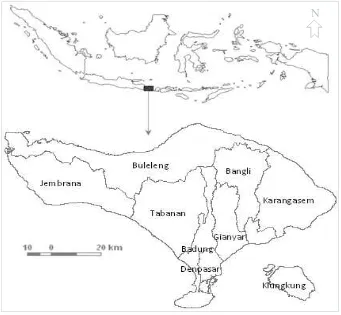
2.1. Background and study area
the irrigated rice fields is rivers, whereas the water for non-irrigated rice fields comes from rainfall. At different times of the year, both irrigated and non-irrigated rice field lands are not only used for rice paddies but also for seasonal crops such as corn, soybeans, and nuts. However, the type of seasonal plant grown from year to year is usually similar from one place to another. In humid tropic regions, such as the study area, rice plants can be planted at any time. However, planting is influenced by water availability. Therefore, on irrigated land, rice planting alternates
between regions, whereas on non-irrigated land, rice planting occurs in the rainy season. Farmers usually plant rice two or three times per year and use the remaining time for other seasonal crops (Food Crops Agriculture Department, 2006). Rice plants are typically harvested after three months, with a production of around five tons per hectare per crop rotation. The total agricultural rice area in Bali is 107,437.50 ha.
2.2. MODIS images
Among the suite of standard MODIS data products available, we used the 16 -day composite MODIS Vegetation Indices Product (MOD13Q1). Each 16 -day composite image includes blue, red, and nearinfrared reflectances, centred at 469 nanometers, 645nanometers, and 858 -na nometers, respectively, Normalised Difference Vegetation Index (NDVI) and Enhanced Vegetation Index (EVI) at a spatial resolution of 250 m as a gridded l e v e l - 3 p r o d u c t i n t h e S i n u s o i d a l p r o j e c t i o n . I n t h e p r o d u c t i o n o f MOD 13Q1, atmospheric corrections for gases, thin cirrus clouds and aerosols are implemented (Vermote and Vermeulen, 1999). In addition, The MODIS NDVI and E V I p r o d u c t s a r e c o m p u t e d f r o m atmospherically corrected bi -directional surface reflectances that have been masked for water, clouds, heavy aerosols, and cloud shadows. The products are Validated Stage 2, meaning that accuracy has been assessed over a widely distributed set of locations and time periods via several gr ou nd -trut h and validation efforts. Although there may be later, improved versions, these data are ready for use in s c i e n t i f i c p u b l i c a t i o n s (https://lpdaac.usgs.gov/lpdaac/products /modis_products _table/). In this study, we downloaded MOD13Q1 data for 2008 (twenty-three 16-day composites) from the U S G S E R O S D a t a C e n t e r (http://edc.usgs.gov/).
the MODIS product. The equations for these vegetation indices are as follows:
where swir, nir, r, and b are the middle-infrared, near-middle-infrared, red, and blue band of the MODIS images, respectively, and L is a constant (related to the slope of the soil-line in a feature-space plot) that is usually set to 0.5.
While NDVI correlates with the leaf area index (LAI) of rice fields (Xiao et al., 2002), it has several limitations, including saturation under closed canopies and soil background (Huete et al., 2002; Xiao et al., 2003). The blue band is sensitive to atmospheric conditions and is used for atmospheric correction. EVI directly adjusts the reflectance in the red band as a function of the reflectance in the blue b a n d, a n d it a c c o u nt s f or r es i d u a l atmospheric contamination (e.g., aerosols) and variable soil and canopy background reflectance (Huete et al., 2002). The SAVI in d ex ca n mi ni mis e s oil brig ht n es s influences from spectral vegetation indices involving red and near -infrared (NIR) wavelengths (Huete, 1988), while RVI is a
(2)
(3)
(4)
(5) (1)
2.3. Calculation of vegetation index (VI)
good indicator of crop growth for the entire growth cycle (Gupta, 1993).
The advantage of using a vegetation index compared to single bands is the ability to reduce the spectral data to a single number that is related to physical characteristics of the vegetation (e.g., leaf area, biomass, productivity, photosynthetic activity, or percent cover) (Baret and Guyot, 1991; Huete, 1988). At the same time, it is possible to minimise the effects of internal (e.g., canopy geometry, and leaf and soil properties) and external factors (e.g., sun-target-sensor angles and atmospheric conditions at the time of image acquisition) on the spectral data (Baret and Guyot, 1991; Huete and Warrick, 1990; Huete and Escadafal, 1991).
2.4. Image classification
Image classification was performed using two different procedures. The first used a standard image for input and the second used a modified image for input. For the standard classification procedure, a multispectral image from one acquisition date was used. We used a multispectral image from 6 to 21 April 2008 (16-day composite) due to the fact that this image was free from clouds. From the four bands available in this MODIS product, we used bands 1, 2 and 3 in the blue, red, and near-infrared regions, respectively, as inputs for multispectral image classification.
For the second classification procedure, we used variance maps of three selected vegetation indices as inputs for image classification. The variance maps of the VIs were derived from a layer-stacking process that produced a multi-band image consisting of 23 images (all composite images in 2008). From the multiband image, we calculated the variance of each pixel across time periods, producing a variance map. To select the three best VIs from the five VIs evaluated in this study,
we used the difference in the variance value between rice fields and other land uses. Higher variance differences between rice fields and other land uses indicated an improved ability to discriminate these classes. Hence, the three VIs that had the highest variance difference values between rice fields and other land uses were selected as inputs in the multispectral image classification.
The algorithm developed in this study was only designed to discriminate rice fields from other land uses because the standard procedure had limitations due to the high variation in land cover states of rice fields. Therefore, the selection of training areas for the classification was only performed in rice fields. However, for improved results, we divided rice fields into two sub-classes: irrigated and non-irrigated. For consistency, we used the same training area for image classification in the modified procedure developed in this study and the standard procedure. Image classification was performed using the Maximum Likelihood algorithm for both procedures.
2.5 Quantitative evaluation of classification results
The quantitative evaluation was performed by comparing the classification result with the existing land use maps released by the National Land Agency. The results of the modified classification procedure developed in this study were compared to the results of the standard classification
procedure. To determine which
Figure 3. Temporal variability of NDVI for irrigated rice fields, non-irrigated rice
fields, settlement, mixed forest, and dry land.
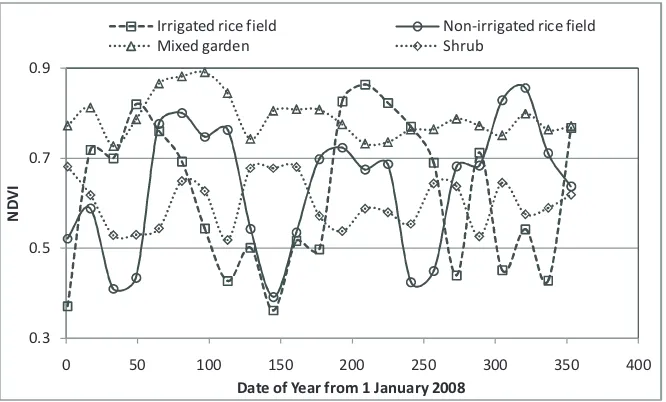
Figure 4.Temporal
variability of NDVI for irrigated rice fields, non-irrigated rice fields, mixed garden, and shrub0.3 0.5 0.7 0.9
0 100 200 300 400
N
D
V
I
Date of Year from 1 January 2008
Irrigated rice field Non-irrigated rice field
Settlement Mixed forest
Dry Land
0.3 0.5 0.7 0.9
0 50 100 150 200 250 300 350 400
N
D
V
I
Date of Year from 1 January 2008
Irrigated rice field Non-irrigated rice field
On the other hand, the average variance of SAVI, RVI, and NDVI for irrigated and non-irrigated rice fields was significantly different from the average variance for the other land uses (Table 1). The difference in average variance between irrigated rice fields compared to other land uses for SAVI was between 2.1465 to 53.9397 (not including non-irrigated rice fields because irrigated and non-irrigated are classified as a single class). For RVI and NDVI, these differences were between 2.9309 to
672.5265 and between 2.1973 to 12.2630, respectively. However, for EVI and NDWI, the differences usually approached one (Table 2). Therefore, SAVI, RVI and NDVI were selected as the best vegetation indices for distinguishing irrigated and non-irrigated rice fields from the other land uses. These VIs were then used for multispectral rice field classification.
Table 1. Average temporal variance of several VIs for the main land uses.
Main Land Uses EVI NDWI SAVI RVI NDVI
Irrigated rice field 0.0311 0.0218 0.0250 117.4982 0.0362 Non-irrigated rice field 0.0313 0.0111 0.0205 61.1684 0.0330
Settlement 0.0019 0.0031 0.0005 0.1747 0.0030
Mixed forest 0.0209 0.0155 0.0053 40.0893 0.0084
Mixed garden 0.0129 0.0232 0.0080 35.3451 0.0058
Shrub 0.0311 0.0204 0.0084 23.5978 0.0156
Dry Land 0.0195 0.0324 0.0117 12.6876 0.0165
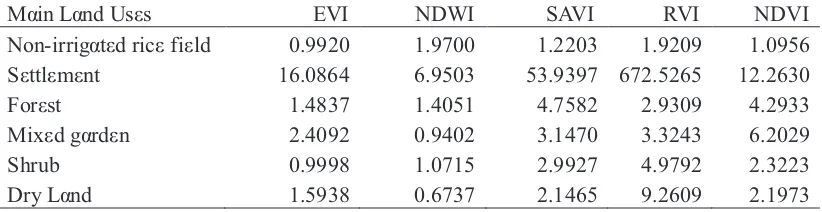
Table 2. Difference in variance values between rice fields and other land uses.
Main Land Uses EVI NDWI SAVI RVI NDVI
Non-irrigated rice field 0.9920 1.9700 1.2203 1.9209 1.0956
Settlement 16.0864 6.9503 53.9397 672.5265 12.2630
Forest 1.4837 1.4051 4.7582 2.9309 4.2933
Mixed garden 2.4092 0.9402 3.1470 3.3243 6.2029
Shrub 0.9998 1.0715 2.9927 4.9792 2.3223
Dry Land 1.5938 0.6737 2.1465 9.2609 2.1973
3.2. Comparison of image classification results
Before the supervised classification was performed, a training area from the same location was selected for both input images. The training area included both irrigated and non-irrigated rice fields. For the standard
classification
procedure,
irrigated and non-irrigated ricefields were classified
into
different
classes and then merged into one class
(rice
field)
after the classification
process. In contrast, the
modified
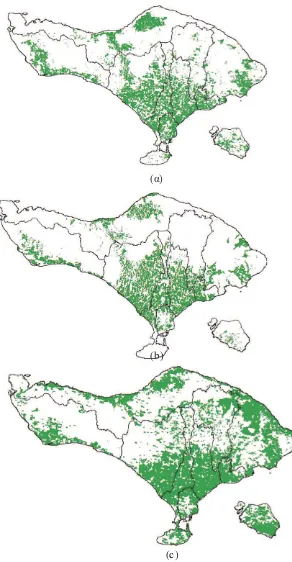
Figure 5. The result of the rice field classification using: (a) the standard procedure; (b) the modified procedure; and (c)
(a)
(b)
c
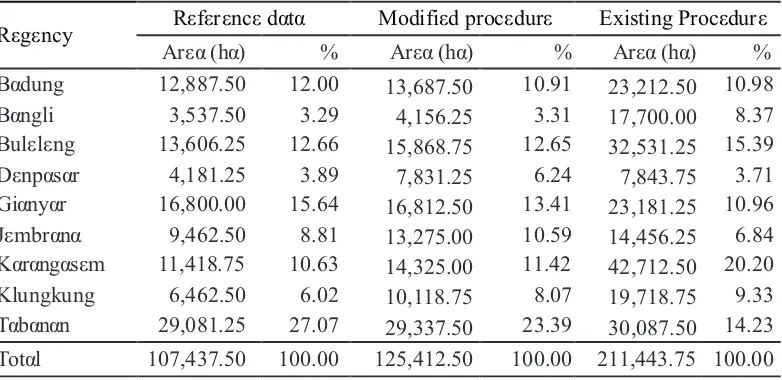
Visually, the standard classification procedure yielded a higher density of predicted rice field areas when compared with the reference data (Figure 5a and 5c). However, the modified procedure resulted in a distribution and density of rice fields that was more similar to the reference data (Figure 5b and 5c). Based on Table 3, both procedures predicted a larger coverage of rice fields in all regencies compared with the reference data. However, the modified procedure had a smaller difference from
the reference data than the standard procedure (16.73% versus 96.81%, respectively). The high variability of the rice field coverage caused high variance of the training area. This produced non-rice field pixels that were classified as rice fields in the standard classification procedure. Using the temporal variance of VIs as an input for the rice classification could reduce classification errors by approximately 80.08%.
Table 3. Comparison of predicted rice field area obtained from the modified procedure and the standard procedure compared with reference data.
Reference data Modified procedure Existing Procedure
Area (ha) % Area (ha) % Area (ha) %
12,887.50 12.00 13,687.50 10.91 23,212.50 10.98 3,537.50 3.29 4,156.25 3.31 17,700.00 8.37 13,606.25 12.66 15,868.75 12.65 32,531.25 15.39
4,181.25 3.89 7,831.25 6.24 7,843.75 3.71
16,800.00 15.64 16,812.50 13.41 23,181.25 10.96 9,462.50 8.81 13,275.00 10.59 14,456.25 6.84 11,418.75 10.63 14,325.00 11.42 42,712.50 20.20 6,462.50 6.02 10,118.75 8.07 19,718.75 9.33 29,081.25 27.07 29,337.50 23.39 30,087.50 14.23
107,437.50 100.00 125,412.50 100.00 211,443.75 100.00
3.3. Accuracy assessment of classification results
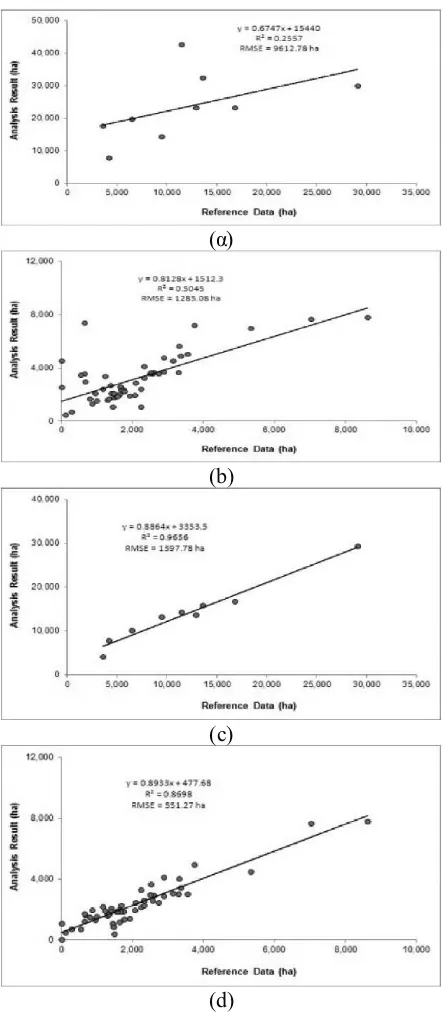
Accuracy assessments of the classification results were performed with two methods: regression analysis and the Kappa statistic. Based on the regression analysis, the coefficient of determination (R2) of the relationship between rice field area resulting from the standard procedure and the reference data was low (0.2557 and 0.5045 for regency- and district-level comparisons, respectively). However, the modified procedure that was developed in
this
study produced high R
2values of
0.9656 and 0.8698 for regency- and
district-level comparisons, respectively.
The Root Mean Square Error (RMSE)
for
estimations
from the
standard
classification procedure was higher
than for the modified procedure. The
RMSE of the standard procedure was
9612.78 ha and 1285.08 ha for
regency-and
district-level
comparisons,
respectively, whereas for the modified
procedure, it was 1397.78 ha and
551.27
ha,
respectively
(Figure6)
Regency
Badung Bangli Buleleng Denpasar Gianyar Jembrana Karangasem Klungkung Tabanan
Figure 6. Relationship between rice field areas resulting from the image classification versus the reference data. (a) and (b) were produced using the current procedure, whereas (c) and (d) were derived from the modified procedure. (a) and (c) are for regency-level comparisons, while (b) and (d) are for district-level comparisons.
(a)
(b)
(c)
Table 4. The error matrix of the rice field classification results.
(a) Standard Procedure
C
la
ss
if
ic
at
io
n
R
es
u
lt
Reference data
Rice Field
Non-rice field
Total
Rice field
118
252
370
Non-rice field
47
479
526
Total
165
731
896
(b) Modified procedure
Reference data
C
la
ss
if
ic
at
io
n
R
es
u
lt
Rice Field
Non-rice field
Total
Rice field
131
97
228
Non-rice field
49
618
667
Total
180
715
895
The first step for the Kappa analysis
was to create an error matrix for both
classification procedures evaluated in
this study (Table 4). As much as 896
points (one percent of the total pixels in
the study area) were used as ground truth
samples from the reference data by
means of stratified random sampling of
rice field and non-rice field classes.
Based on Table 4, the commission
error, omission error, and overall
accuracy of the standard classification
procedure were 68.11%, 28.48%, and
66.63%, respectively, while for the
modified procedure, these values were
4 2 . 3 6 % , 2 7 . 0 7 % , a n d 8 3 . 7 1 % ,
respectively. The modified procedure
showed lower errors and higher
accuracy compared with the standard
procedure. Commission error represents
cases where non-rice field pixels were
classified as rice fields, while omission
error represents cases where rice field
pixels were classified as non-rice fields
(Lillesand and Kiefer, 2000).
Table 5. Errors and accuracy of rice field classification results for both the
standard and modified procedures.
Errors & Accuracy
Existing procedure
Modified procedure
Commission error (%)
68.11
42.36
Omission error (%)
28.48
27.07
Overall accuracy (%)
66.63
83.71
4. Conclusions
Rice field reflectance had higher temporal variability than other land uses. The greatest differences were observed in NDVI, RVI, and SAVI. Both visual comparisons and statistical analyses demonstrated that the modified procedure for rice field classification produced better results than the standard procedure. Regression analysis demonstrated that
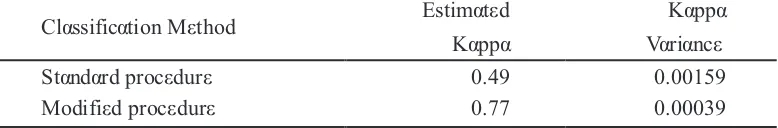
using temporal variance in VIs as an input for rice field classification improved the R2 from 0.2557 to 0.9656 for regency-level comparisons and from 0.5045 to 0.8698 for district-level comparisons. The RMSE of the modified procedure produced lower values of 1397.78 ha and 551.27 ha when compared with the RMSE of the standard procedure of 9612.78 ha and 1285.08 ha for regency- and district-level comparisons, Table 6. The estimated kappa statistic and kappa analysis of both standard and modified procedures for rice field classification
Classification Method Estimated Kappa
Kappa Variance
Standard procedure 0.49 0.00159
Modified procedure 0.77 0.00039
Table 7. z-score and Z-table values for the comparison between the standard procedure and the modified procedure for rice classification.
z-score Z Table (á= 5%) Decision
6.43 1.96 Reject H0
Additional parameters used to assess the accuracy of the rice field classification were the Kappa statistic and Kappa variance. A higher estimated Kappa value and lower Kappa variance value showed better agreement between the analysis result and reference data (Congalton et al., 1983). The modified procedure improved the kappa estimate from 0.49 to 0.77 and reduced kappa variance from 0.00159 to 0.00039 compared with the standard method (Table 6).
Although the regression analysis, error matrices, and estimated kappa statistics illustrated that the modified classification procedure developed in this study provided better results for rice field classification than the standard procedure,
respectively. Classification accuracy and estimated Kappa statistics from the modified classification procedure also showed more accurate results than the standard method. Commission error, omission error, and kappa variance were smaller for the modified procedure than the standard procedure. The Kappa analysis concluded that there are significant differences between the modified procedure developed in this study and the standard procedure for rice field classification. Thus, using modified input for rice field classification with MODIS images provides a significantly more accurate result compared with the standard classification procedure.
Acknowledgments
I would like to express my profound gratitude to my advisor for his invaluable support, encouragement, supervision, and useful suggestions throughout this research. I am also very thankful to JSPS Ronpaku for their funding support for this PhD research program.
References
Atkinson, P.M. and Lewis, P., 2000, Geostatistical classification for remote sensing: an introduction. Computers and Geosciences 26:361–371.
Bachelet, D., 1995, Rice paddy inventory in a few provinces of China using AVHRR data. Geocarto International
10:23–38.
Baret, F. and Guyot, G., 1991, Potentials and limits of vegetation indices for LAI
and APAR assessment. Remote
Sensing of Environment, 35:161–173. Brown, J.C., Jepson, W.E., Kastens, J.H.,
Wardlow, B.D., Lomas, J. and Price, K.P., 2007, Multi-temporal, moderate spatial resolution remote sensing of modern agricultural production and land modification in the Brazilian
Amazon. GIScience and Remote
Sensing 44:117–148.
Chang, J., Hansen, M.C., Pittman, K., Carroll, M. and Dimiceli, C., 2007,
Corn and soybean mapping in the United States using MODIS time-series data sets. Agronomy Journal
99:1654–1664.
Congalton, R.G. and Green, K., 1999,
Assessing the Accuracy of Remotely S e n s e d D a t a : P r i n c i p l e s a n d Practices, Lewis Publishers, Florida. Congalton, R.G., Oderwald, R.G. and
Mead, R.A., 1983., Assessing Landsat Classification Accuracy Using Discrete Multivariate Analysis S t a t i s t i c a l Te c h n i q u e s , P E R S
49:1671–1678.
Denier Van Der Gon, H., 2000., Changes in CH4 emission from rice fields from 1960s to 1990s: 1. Impacts of modern r i c e t e c h n o l o g y . G l o b a l Biogeochemical Cycles, :1:61– 72. Doraiswamy, P.C., Sinclair, T.R.,
Hollinger, S., Akhmedov, B., Stern, A. and Prueger, J., 2005, Application of MODIS-derived parameters for regional crop yield assessment.
Remote Sensing of Environment
87:192–202.
Fang, H., 1998., Rice crop area estimation of an administrative division in China u s i n g r e m o t e s e n s i n g d a t a .
International Journal of Remote Sensing 17:3411–3419.
Fang, H., Wu, B., Liu, H. and Xuan, H., 1998, Using NOAA AVHRR and Landsat TM to estimate rice area year-by-year. International Journal of Remote Sensing 3:521–525.
Food Crops Agriculture Department, 2006, Annual report of food crops,
Agriculture Department of Local Governent, Bali.
Harris, P. M. and Ventura, S. J., 1995, The integration of geographic data with remotely sensed imagery to improve
classification in an urban area.
Photogrammetric Engineering and Remote Sensing, Vol. 61, pp. 993–998.
Huete, A.R., 1988, A soil-adjusted
vegetation index (SAVI). Remote
Sensing of Environment25:295–309 Huete, A. R. and Escadafal, R. 1991
Assessment of biophysical soil
properties through spectral
decomposition techniques. Remote
Sensing of Environment 35:149–159. Huete, A. R. and Warrick, A. W., 1990,
Assessment of vegetation and soil water regimes in partial canopies with optical remotely sensed data.Remote Sensing of Environment32:115–167.
Huete, A., Didan, K., Miura, T., Rodriguez, E. P., Gao, X. and Ferreira, L. G., 2002,
Overview of the radiometric and
biophysical performance of the MODIS vegetation indices. Remote Sensing of Environment83:195–213.
IRRI, 1993, 1993–1995 IRRI Rice
Almanac, International Rice Research Institute, Manila.
Jensen, J. R., 1986, Introductory digital image processing: A remote sensing perspective. Prentice-Hall, New Jersey. Justice, C.O. and Townshend, J.R.G., 2002,
Special issue on the moderate resolution imaging spectroradiometer (MODIS): a
new generation of land surface
monitoring. Remote Sensing of
Environment83:1–2.
Khush, G.S., 2005, What it will take to feed 5 billion rice consumers in 2030.
PlantMolecularBiology59:1-6.
Lillesand, T. M. and Kiefer, R. W, 2000.
Remote sensing and image interpretation. Wiley & Son, New York. Lobell, D.B. and Asner, G.P., 2004, Cropland distributions from temporal
unmixing of MODIS data. Remote Sensing of Environment93:412–422. Matthews, R. B., Wassmann, R., Knox, J.
W. and Buendia, L. V., 2000, Using a crop/soil simulation model and GIS techniques to assess methane emissions from rice fields in Asia: Upscaling to national levels. Nutrient Cycling in Agroecosystems 58:201– 217.
Morton, D.C., Defries, R.S., Shimabukuro, Y.E., Anderson, L.O., Arai, E., Del Bon Espirito-Santo, F., Freitas, R. And Morisette, J., 2006, Cropland expansion changes deforestation dynamics in the
southern Brazilian Amazon.
Proceedings of the National Academy of Sciences USA103:14637–14641. Niel, T.G.V. and McVicar, T.R. Remote
Sensing of Rice-Based Irrigated Agriculture: A Review. Rice CRC Technical Report, 2001, Available from www.ricecrc.org (Accessed 5 October 2009).
Niel, T.G.V., McVicar, T.R., Fan g, H. and Liang, S., 2003, Calculating environmental moisture for per-field discrimination of rice crops. International Journal of Remote Sensing 24:885–890.
Okamoto, K. and Kawashima, H., 1999, Estimating of rice-planted area in the tropical zone using a combination of optical and microwave satellite sensor data. International Journal of Remote Sensing5:1045–1048.
Potgieter, A.B., Apan, A., Dunn, P. and Hammer, G., 2007, Estimating crop area using seasonal time series of enhanced vegetation index from MODIS satellite imagery. Australian Journal of Agricultural Research58:316–325. Prather, M., D. Ehhalt, F. Dentener, R. G.
Derwent, E. Dlugokencky, E. Holland, I. S. A. Isaksen, J. Katima, V. Kirchhoff, P. Matson, P. M. Midgley, and M. Wang., 2001, Chapter 4.
Greenhouse Gases. In Climate Change 2001. Edited by J.T. Houghton, Cambridge U. Press 239-287.
Sakamoto, T., Nguyen, N.V., Ohno, H., Ishitsuka, N. and Yokozawa, M., 2006, Spatiotemporal distribution of rice phenology and cropping systems in the Mekong Delta with special reference to the seasonal water flow of the Mekong and Bassac rivers. Remote Sensing of Environment100:1–16.
Sakamoto, T., Yokozaawa, M., Toritani, H., Shibayama, M., Ishitsuka, N. and Ohno, H., 2005, A crop phenology detection method using time-series MODIS data. Remote Sensing of Environment96:366–374.
Samad, M., Merrey, D., Vermillion, D., Fuchscarsch, M., Mohtadullah, K., & Lenton, R., 1992, Irrigation management strategies for improving the performance of irrigated agriculture. Outlook on Agriculture21:279– 286. Vermote, E. F. and Vermeulen, A., 1999,
Atmospheric correction algorithm: Spectral reflectance (MOD09), MODIS algorithm technical background document, version 4.0. Department of Geography, University of Maryland. Wardlow, B.D. and Egbert, S.L., 2008,
Large-area crop mapping using time-series MODIS 250 m NDVI data: an assessment for the U.S. Central Great
Plains. Remote Sensing of Environment 112:1096–1116.
Wardlow, B.D., Kastens, J.H. and Egbert , S.L., 2006, Using USDA crop progress data for the evaluation of greenup onset date calculated from MODIS 250-meter data.Photogrammetric Engineering and Remote Sensing72:1225–1234.
Xiao, X., He, L., Salas, W., Li, C., Moore, B. and Zhao, R., 2002, Quantitative relationships between field-measured leaf area index and vegetation index derived from VEGETATION images for paddy rice fields. International Journal of Remote Sensing 23:3595– 3604.
Xiao, X., Braswell, B., Zhang, Q., Boles, S., Frolking, S. and Moore, B., 2003, Sensitivity of vegetation indices to atmospheric aerosols: Continental-scale observations in Northern Asia. Remote Sensing of Environment84:385–392. Xiao, X., Boles, S., Liu, J., Zhuang, D.,
Frolking, S., Li, C., Salas, W. and Moore, B., 2005, Mapping paddy rice agriculture in southern China using multi-temporal MODIS images. Remote Sensing of Environment95:480–492. Yeh, A.G.O. and Li, X., 1999, Economic