Association between Blood Lead, Nutritional Status, and Risk Factors
of Hypertension and Diabetes Mellitus: A Study in Female Traffic Police Officers
in Yogyakarta
Toto Sudargo
1*, Banun Ma’rifah Fathsidni
1, Dea Farah Zakia
1, Yuliana Novita
Rachmawati
1, Muhammad Hafizh Hariawan
1, Rahadyana Muslichah
1,
Rathi Paramastri
11Department of Health Nutrition, Faculty of Medicine, Universitas Gadjah Mada, Yogyakarta 55281
ABSTRACT
The research aimed to investigate the association of nutritional status, blood lead level, and risk
factors of hypertension and diabetes mellitus in female traffic police officers routinely exposed to lead in Yogyakarta, Indonesia. Fifty-four female traffic police officers aged 20-50 year old participated in this cross-sectional study. As risk factors of diabetes and hypertension, Body Mass Index (BMI) was calculated from height and weight data while percentage of body fat (%BF) was measured using Bioelectrical Impedance Analysis (BIA). Energy intake (EI) was assessed using 1x24-hour dietary recall. Atomic Absorption Spectrophotometer (AAS) method was conducted to measure blood lead (Pb-S). Blood pressure (BP) was measured using mercury sphygmomanometer while blood glucose (Glu) was measured in laboratory. Pearson’s and Spearman Rank correlation test were performed for statistical analysis. We demonstrated that Pb-S was positively correlated with both systolic and diastolic BP but not with BMI, %BF, and Glu. Meanwhile, there was a correlation between Glu and either BMI or %BF but not EI. Therefore, our study indicates that exposure to lead is correlated with hypertension while
nutritional status is more correlated with diabetes mellitus.
Keywords:blood glucose, blood lead, female traffic police, hypertension, nutritional status
ISSN 1978-1059 EISSN 2407-0920
INTRODUCTION
Indonesia is among many countries with high levels of environmental pollution where un-checked industrial growth has led to an inevitable
increase in air pollutants such as lead (Pb). Lead exposure continues to be a tremendous interna -tional public health concern as it may predispose individuals of any age group to a wide range of
health problems (Wani et al. 2015). Research has
confirmed that exposure to lead may introduce
acute and chronic effects on health outcomes
(Pahlawan & Keman 2014).
Lead enters the body mainly through the
air, food, and water and accumulates short-term
in blood (1 month) and long-term in bone (up to 20 years) (Wani et al. 2015). Centers for Diseases
Control and Prevention (CDC) have suggested the threshold for blood lead level to be 10µg/dl. However, the harmful effects of lead toxicity are
not limited to values beyond the aforementioned threshold since low levels of blood lead have been found to be associated with increased risk
factor of all chronic illnesses, cardiovascular
dis-eases, and cancer mortality (Menke et al. 2006).
Lead exposure is one of the established risks of cardiovascular diseases (CVD). Lead-induced CVD, alongside mental retardation, ac
-counted for 1% of global burden of disease with
the highest burden in the developing countries
(Fewtrell et al. 2004). There is well-established evidence from meta-analysis studies where
sig-nificant correlations between hypertension and
level of lead accumulated in both blood and bone
were found (Nawrot et al. 2002). However, the
evidence is inconclusive for lead exposure below 5µg/dl as previously found across different gen
-ders and races (Den Hond et al. 2002). Recently, a cohort study suggested that low levels of blood
lead (2.8µg/dl) independently increased blood pressure and risk of hypertension (Gambelunghe
et al. 2016). It is clear that more research is still
needed focusing on the effects of low exposure
of lead.
In contrast to CVD, there is limited evi
-creased risk of diabetes mellitus. Previously, a
cross-sectional study indicated an increase in fasting blood glucose among male workers with
high blood lead levels (Bener et al. 2001). How -ever, to date, there has been no further study con-ducted to elaborate on this topic. Meanwhile, lead
is considered an Endocrine Disrupting Chemicals (EDC) which may compromise hormonal regula
-tion in human’s body. Glucocorticoids and insulin
are among the hormones potentially affected by
lead exposure. As a result, glucose uptake by cells diminishes and blood glucose raises (Casals-Ca
-sas & Desvergne 2011). Thus, further study is
worth-conducting to investigate whether lead
toxicity may be a potential risk factor of diabetes
mellitus.
In some big cities in Indonesia including Yogyakarta, one of the top contributors to air
pol-lution is motor vehicles. Emissions from motor vehicles contributed to 85% of air pollutants and
will potentially increase as the volume of vehicles on the road increases. Investigation in some loca-tions indicated that motor vehicles contributed up
to 98.8%, 73.4%, 88.9%, and 100% of CO, NO, HC, and lead, respectively, in the air (Pahlawan & Keman 2014). In Yogyakarta, the levels of lead
pollution in some locations with the highest
vo-lume of motor vehicles ranged from 1.05 mg/Nm3 to 1.56 mg/Nm3. Meanwhile, the recommended
threshold for lead pollution according to the
gov-ernment law released in 2002 was 2 mg/Nm3. The
level of lead pollution in Yogyakarta is a growing concern as the number of vehicles continues to increase.
Traffic police officers are among the at-risk populations routinely exposed to lead expo -sure due to their occupational environment. More
specifically, based on a study in Europe, women
aged 19-39 years was reported to face a 5-fold increase risk of metabolic syndrome by the age
of 60-78 years which was greater compared to men (2-fold) (Vishram et al. 2014). Therefore, we conducted this study to determine the correlation between nutritional status measured as body mass
index (BMI) and body fat percentage (%BF), se
-rum lead level (Pb-S), and parameters of cardio metabolic diseases including blood pressure (BP) and blood glucose concentration (Glu) in female traffic police officers in Yogyakarta, Indonesia.
METHODS
Design, location, dan time
This observational study was conducted with a cross-sectional design in Yogyakarta.
Study population was female traffic police from all five cities in the province including Yogya
-karta City, Sleman, Kulon Progo, Bantul, and Gunung Kidul. Inclusion criteria were subjects must be 20-50 years old and actively working in road traffic with high volume of vehicles for at least 1 year. Exclusion criteria included
ha-ving diagnosed with chronic or infection
diseas-es, pregnant, and experienced post-menopausal phase. The research was done in May-July 2017. Sample size was calculated based on using Lame -show formula below which resulted in a mini-mum number of 51 subjects.
Data collection
Subjects completed anthropometric mea-surements including body weight and height as
well as percentage of body weight (%BF). A calibrated Bioelectric Impedance Analysis (BIA) was used to measure body weight and %BF while
height was measured using a microtoise. Body
mass index (BMI) was then calculated based on body weight and height data. Subjects’ nutritional status were determined based on the WHO BMI classification for Asian population.
Energy intake (EI) was assessed using 24-h
dietary recall conducted by trained interviewer. A brief instruction and food model were provided.
All foods and drinks consumed in the last 24
hours were reported including details of portion size, brands, and cooking process. Finally,
addi-tional probing for confirmation was performed to
ensure the accuracy and completeness of foods
reported. Population-based validated Nutrisurvey software was employed to estimate subjects’ en -ergy intake.
Blood measurement included were lead and glucose concentrations. Serum blood lead
level (Pb-S) was defined as the amount of lead
accumulated in the blood circulation. Blood glu-cose measurement was conducted in the
morn-ing after 10 hour overnight fast. Approximately
5 ml of venous blood was taken from the
sub-jects elbow pit (fossa cubiti) using a syringe by an experienced phlebotomist. Atomic Absorption Spectroscopy (AAS) method was conducted to
measure blood lead levels while blood glucose concentration was measured in the laboratory us-ing spectrophotometry kit.
Systolic (SBP) and diastolic (DBP) blood
pressures were measured using a calibrated
mer-cury sphygmomanometer with inflatable cuff
for adults by trained researchers. A stethoscope
was placed on the brachial artery of participant’s
5 minutes before having their blood pressure taken. While doing the measurement, subjects
must remain silent, relaxed, and seated with their
back supported and legs uncrossed. For accuracy, measurements were duplicated with an appropri-ate interval and average values were taken for the analysis.
Data collection instruments including BIA, sphygmomanometer, and AAS test kit were cali-brated. All procedures throughout this study were conducted based on the Declaration of Helsinki.
This study was approved by the Ethics Commit -tee of Faculty of Medicine, Universitas Gadjah
Mada (KE/FK/0338/EC/2017). Signed informed
consent forms were obtained from all subjects before the commencement of this study.
Data analysis
Data collected was initially cleaned for any
outliers before being analyzed using IBM SPSS
21 Software. Shapiro-Wilk test was employed to
analyze the normality of data. Correlation Test
was employed depending on the distribution of variables to analyze the association between BMI
and Pb-S, EI and Pb-S, BMI and Glu, %BF and Glu, Pb-S and BP as well as Pb-S and Glu.
RESULTS AND DISCUSSION
Fifty-four female traffic police officers from five cities in the Province of Yogyakarta
participated in our study with details as follow;
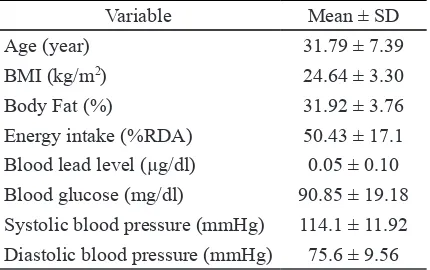
Yogyakarta City (n=21), Sleman (n=11), Kulon Progo (n=7), Gunung Kidul (n=5), and Bantul (n=10). Characteristics of subjects are presented in Table 1. Mean BMI was classified as over
-weight (24.6 kg/m2) while mean percentage of
body fat was slightly below the cut-off point for
excess fat. Dietary intake of subjects was low, meeting only half of the Recommended Dietary Allowance (RDA). The average blood lead level of subjects in our study was 0.05µg/dL. This val -ue is considered low as it is below the threshold
value (10 µg/dl). Mean systolic/diastolic blood pressure (114.1/75.6 mmHg) and blood glucose concentration was 90.8 (mg/dl) which fell into
the normal range.
Shapiro-Wilk normality test indicated that
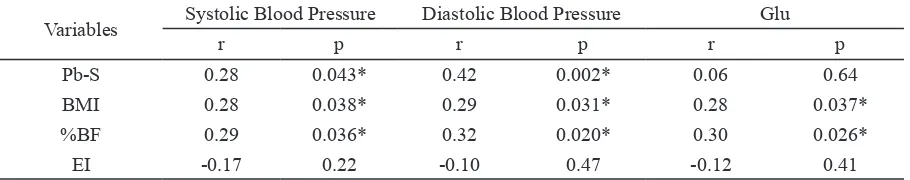
only %BF data was normally distributed. Hence, Spearman’s Rank Correlation Test was chosen to analyze the association between Pb-S and ei
-ther BMI, %BF, Glu, and BP (Table 2). Increase in Pb-S is associated with elevation in systolic (r=0.28) and diastolic BP (0.42) (p<0.05) al
-though the correlation was weak. Previously, it
lead might be associated with an increase in
sys-tolic and diassys-tolic blood pressure by 1.45 mmHg and 1.25 mmHg, respectively. Correlation with
systolic blood pressure was also indicated when lead concentration was measured from the bone which has longer half-life in the human body. Thus, it may be inferred from this study that lead
exposure that happened in the past few months might still be associated with hypertension. Our finding is also similar with finding from an ob -servational study by Deyot involving parking staff along Malioboro Street in Yogyakarta where
blood lead levels were significantly correlated with incidence of hypertension (r=0.22; p<0.05) (Deyot 2013). In this study, 72.7% subjects with
hypertension had blood lead concentrations
be-yond the threshold value (10 µg/dl) while the
average concentration of blood lead in our study
was far below the threshold (0.05 µg/dl). Thus, our finding may add to the evidence that even a
low level of blood lead can be associated with an elevation in both systolic and diastolic blood pressure.
Blood glucose concentration was weakly
associated with blood lead level (r=0.06) which was not statistically significant (p=0.64) (Table 2). This result was in contrast with a previous
cross-over study by Bener and colleagues where
they demonstrated a significant correlation be -tween blood lead level and fasting blood glucose
(r=0.4; p<0.01) (Bener et al. 2001). However, it
is noteworthy that subjects’ average blood lead level in our study (0.05 µg/l) was categorized as normal far below the cut-off for lead toxicity (US Department of Health and Human Services 2007). Additionally, our study involved a small
-er sample size (n=54) compared to the previous study (110 workers and 110 non-workers) (Ben -er et al. 2001). Therefore, it may be concluded that the low level of blood lead as well as small
sample size in our study may not be sufficient to
Variable Mean ± SD
Age (year) 31.79 ± 7.39
BMI (kg/m2) 24.64 ± 3.30
Body Fat (%) 31.92 ± 3.76
Energy intake (%RDA) 50.43 ± 17.1
Blood lead level (µg/dl) 0.05 ± 0.10
Blood glucose (mg/dl) 90.85 ± 19.18
Blood glucose, however, was significant
-ly associated with both BMI (r=0.28) and %BF (r=0.30) (p<0.05) (Table 2). It was indicated that
subjects having a higher BMI or percentage of body fat were more likely to be linked with high-er fasting blood glucose concentration. Thus, instead of blood lead level, nutritional status seemed to be a more potential factor correlated
with blood glucose concentration. These findings
may support the current evidence where obesity is one of the predominant risk factors of type-2
diabetes mellitus (Nguyen et al. 2011; Bell et al.
2014).
Our study indicated that blood lead level was neither associated with BMI (r=-0.1; p=0.47) nor %BF (r=-0.13; p=0.33) (Table 2). These re
-sults confirmed the findings from a previous investigation in female traffic police officers in
Semarang Barat, Indonesia where no correlation between nutritional status and blood lead level
was found (Mahawati 2011). In another study, Ronco and colleagues also found no significant
correlation between blood lead level and both BMI and body fat percentage. In addition, this study also could not reveal the role of BMI or
body composition in the regulation of lead tox
-icity (Ronco et al. 2010). Our finding, however,
was in contrast with a previous study by Rustanti
and Mahawati involving public transportation
drivers where a significant negative correlation
was indicated between blood lead level and BMI
(r=-0.38; p<0.05) (Rustanti & Mahawati 2011). In another research, Riedt and associates found
that lower body weight and thus BMI was
corre-lated with higher blood lead level after 6 months of cohort study (Riedt et al. 2009). This differ -ence might be due to the longer period of lead
exposure and higher blood lead concentration
of subjects in the previous study. Therefore, the low level of blood lead in our study may not be
sufficient to generate association with nutritional
status.
As summarized in Table 2, this study
demonstrated no significant association between
energy intake and blood glucose concentration
(r=-0.12; p=0.41). Similarly, previous study also
demonstrated that energy intake in total as well as carbohydrate intake alone were not correlated
with blood glucose and body mass index (Ref -danita et al. 2017). This non-significant corre -lation may be caused by several potential con-founders such as physical activity level, stress level, and family history of chronic diseases which were not investigated in the present study.
In addition, the use of 24-hour dietary recall as
dietary assessment tool has several limitations. The Flat Slope Syndrome, for instance, might be one of the limitations as there is a tendency for subjects to under- or overestimate their dietary intake. It was also indicated that individuals with higher BMI were more likely to under-report
their daily consumption (Flegal 1999). As the average BMI of our subjects was classified into
overweight, it is likely that the amount of energy intake reported in our study was below the actual amount. Indeed, as reported, the average energy
intake of our subjects was only half of the Rec
-ommended Dietary Allowance (RDA).
Our study results, however, were attribut -ed to several limitations. As we adopt-ed a cross-sectional design, we were unable to determine any causal relationship. Additionally, although we have done sample calculation, our sample size was smaller compared to previous studies on this topic with similar study design. Further-more, our statistical analysis did not adjust the correlation for any potential confounders such as
physical activity level, age, sex, smoking habit,
and family history of any chronic diseases. In
terms of markers of lead exposure, we performed
measurement of blood lead concentration. Blood lead might not provide an estimation of
long-term lead exposure as it has a shorter half-life in Table 2. Correlation between blood lead (Pb-S), body mass index (BMI), percentage body fat (%BF), energy take (EI), fasting blood glucose (Glu) and blood pressure (BP)
Variables Systolic Blood Pressure Diastolic Blood Pressure Glu
r p r p r p
Pb-S 0.28 0.043* 0.42 0.002* 0.06 0.64
BMI 0.28 0.038* 0.29 0.031* 0.28 0.037*
%BF 0.29 0.036* 0.32 0.020* 0.30 0.026*
EI -0.17 0.22 -0.10 0.47 -0.12 0.41
the body. However, to date, blood lead is still the most feasible and reliable indicator of recent lead
exposure. Dietary intake was assessed using only one tool which was the 24-hour dietary recall. As
mentioned before, this method has some limita-tions and the additional use of 3-day food diary or FFQ as reference methods might provide a more accurate measurement. Furthermore, we did not observe whether different macronutrients intake were associated with our outcomes.
Meanwhile, there are several strengths of this study including using the measurement of percentage of body fat as a part of the anthropo-metric measurements. Body fat percentage has been suggested as a reference measurement of BMI measurement as it may distinguish the pro-portion of body fat from other body tissues. Thus, measuring body fat percentage along with BMI has been demonstrated to provide a better
predic-tor for risk of cardio-metabolic diseases (Phillips
et al. 2013).
CONCLUSION
The present study aimed to primarily ob-serve the correlation between nutritional status,
lead exposure, and markers of hypertension and diabetes mellitus in 54 female traffic police of
-ficers in Yogyakarta, Indonesia. Increased blood
lead level was associated with elevated systolic and diastolic blood pressure but not with blood glucose, BMI, and body fat percentage. Mean-while, higher blood glucose was associated with
increase in BMI and body fat percentage. Our study indicates that exposure to lead is correlated
with hypertension while nutritional status is more correlated with diabetes mellitus
ACKNOWLEDGEMENTS
The authors would like to thank the Fac-ulty of Medicine and Universitas Gadjah Mada, Yogyakarta, for the support given throughout this study.
REFERENCES
Bell JA, Kivimaki M, Hamer M. 2014. Metaboli -cally healthy obesity and risk of incident type 2 diabetes: a meta-analysis of
pro-spective cohort studies. Obesity Reviews 15(6):504-515.
Bener A, Obineche E, Gillett M, Pasha MAH, Bishawi B. 2001. Association between
blood levels of lead, blood pressure,
and risk of diabetes and heart disease in
workers. Int Arch Occup Environ Health 74(5):375-378.
Casals-Casas C, Desvergne B. 2011. Endocrine
disruptors: from endocrine to metabolic
disruption. Annual Review ods Physiol
-ogy 73:135-162.
Den Hond E, Nawrot T, Staessen JA. 2002. The
relationship between blood pressure and
blood lead in NHANES III. Journal of Hu
-man Hypertension 16(8):563-568.
Deyot YK. 2013. Masa kerja, Kadar timbal da -rah, dan kejadian hipertensi pada petu-gas parkir di jalan malioboro Yogyakarta. [Tesis]. Yogyakarta: Universitas Gadjah Mada.
Fewtrell LJ, Pruss-Ustun A, Landrigan P, Ayuso-Mateos JL. 2004. Estimating the global
burden of disease of mental retardation and cardiovascular diseases from
environ-mental lead exposure. Environenviron-mental Re
-search 94(2):120-133.
Flegal KM. 1999. Evaluating epidemiologic evi -dence of the effects of food and nutrients
exposures. Am J Clin Nutr 69(6):1339S-1344S.
Gambelunghe A, Sallsten G, Borne Y, Forsgard
N, Hedblad B, Nilsson P, Fagerberg B, Engstrom G, Barreard L. 2016. Low level exposure to lead, blood pressure, and hy -pertension in a population-based cohort.
Arct Environ Res 149:157-163.
Mahawati E. 2011. Faktor-faktor resiko paparan Pb-B pada polisi lalu lintas di Semarang
Barat. Jurnal Visikes10(2).
Menke A, Muntner P, Batuman V, Silbergeld EK, Guallar E. 2006. Blood lead below 0.48 mcromol/l (10 microg/dl) and mortality among US adults. Circulation 114(13): 1388-1394.
Nawrot TS, Thijs L, Den Hond EM, Roels HA, Staessen JA. 2002. An epidemiologican
re-appraisal of the association between blood pressure and blood lead: a
meta-analysis. J Hum Hyperens 16(2):123-131. Nguyen NT, Nguyen XT, Lane J, Wang P. 2011.
Relationship between obesity and diabetes in a US adult population: findings from the National health and nutrition examination survey, 1999-2006. Obes Surg
21(3):351-355.
Pahlawan SD, Keman S. 2014. Korelasi kadar
plumbun darah dengan kadar hemoglobin
dan hematokrit. Jurnal Kesehatan Ling
Phillips CM et al. 2013. Obesity and body fat
classification in the metabolic syndrome:
impact on cardiometabolic risk
metabo-type. Obesity 21(1):154-161.
Refdanita, Damayanthi E, Dwiriani CM, Sumant
-ri C, Effendi AT. 2017. Hubungan kara -kteristik pria dewasa dengan Biomarker
sindroma metabolik. J Gizi Pangan 12(2): 79-84.
Riedt CS, Buckley BT, Brolin RE, Ambia-Sobhan H, Rhoads GG, Shapses SA. 2009. Blood
lead levels and bone turnover with weight
reduction in women. J Expo Sci Environ Epidemiol 19(1):90-96.
Ronco AM, Gutierrez Y, Gras N, Munoz L, Sala
-zar G, Llanos MN. 2010. Lead and arsenic
levels in women with different body mass
composition. Biological Trace Elements Research 136(3):269-278.
Rustanti I, Mahawati E. 2011. Faktor-faktor yang berhubungan dengan kadar timbal (Pb-B)
dalam darah pada sopir angkutan umum
jurusan Karawang Ayu-Penggaron di kota Semarang. Jurnal Visikes 10(1).
Vishram JKK et al. 2014. Impact of age and gen -der on the prevalence and prognostic im-portance of the metabolic syndrome and its components in europeans. The Morgam
Prospective Cohort Project. Plos One9(9). Wani AL, Ara A, Usmani JA. 2015. Lead toxic