CHAPTER III RESEARCH METHOD
In this chapter the researcher explained about the research methodology. Its’ purpose is to answer the problem of the study. This consists of place and time of the study, research design, population and sample, data collecting technique, data analysis technique, research instrument, instrument validity and instrument reliability.
A.Place and Time of The Study
The researcher conducted the research at SMA N 1 Kotawaringin Lama, with the number of students are 58, which located at Jl. Pangkalan Muntai Km.2 Kotawaringin Lama, Kabupaten Kotawaringin Barat. The research was conducted from 26th March 2016 up to 9th April 2016.
B.Research Design
In this study, the researcher used quantitative correlation method. Correlation research methods are used to assess reletionships and patterns of reletionship among variables in a single group of subject.1 The main object of this study is to discover the correlation between two intended variables,
students’ skill in writing recount text which it figures out how much the
undertstanding of past tense affects their skill in writing recount text.
1
Donal Ary, at all. Introduction to Research in Education, (Eighth Edition).(Canada:Wadsworth Cangage Learning,2010).p.351.
C.Population and Sample 1. Population
The first step in selecting sample is to determine the population.2 A population is define as all members of any well-defined class of people, events or objects.
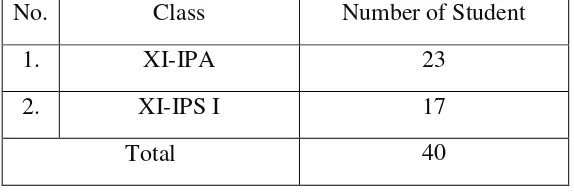
Table 3.1
Number of Eleventh Grade of SMA N 1 Kotawaringin Lama.
No. Class Number of Student
1. XI-IPA 23
2. XI-IPS I 17
Total 40
In this study the population was the eleven class of SMA N 1 Kotawaringin Lama academic year 2015/2016, the total are 40 students. 2. Sample
A sample is a portion of a population.3 Random sampling
technique was used to determine the number of the sample of this study
because the writer thaught the random sampling technique is the best way
totake the sample. The meaning of random is “withaout purpose or by
accident”. Random sampling is purposeful and methodical. A sample
selected randomly is not subject to tthe biases of the researcher.4
In this study, there were two classes as the sample as follows:
2
Ibid, p.149.
3
Ibid,p.148.
4
Table 3.2 Number of Sample
No. Class Number of Student
1. XI-IPA 22
2. XI-IPS I 18
Total 40
D.Data Collecting Techniques
In this reserach researcher divided test into two tests in collecting data:
1. Students’ mastery of past tense
To know the students’mastery of past tense, researcher collected the data from the students by the test about past tense. The test is multiple choice test. The total of test items were 25 items.
2. Students’ achievement in writing recount text
To know their writing achievement in writing past recount text, researcher asked the students to construct at least 3 paraghraphs about their
holiday or their yesterday’s activities.
component, and then sums the sub scores into final score.5 The latter is
scoring/judging the learners’ writing ability on the basis of the rater’s
general impression on the learners’ performance without necessarily
separating the writing components. Thus, the rater directly comes to a single score without totaling the sub scores such that in the analytic system.
For classroom evaluation learning is best server through analytic scoring in which as many as six major (or five) elements of writing are scored, thus enabling learners to home in on weaknesses and to capitalize on strengths. The six major elements of writing, then cover organization, logical development of ideas, grammar, punctuation/spelling/mechanics, and style, and quality of expression, whereas the five major elements cover content, organization, vocabulary, syntax, and mechanics.
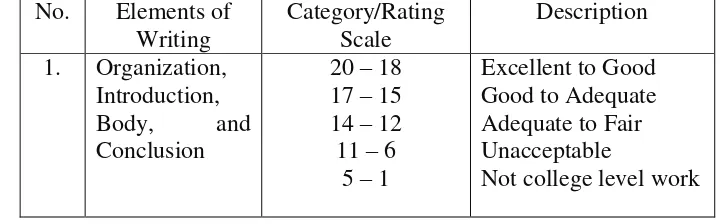
Analytic scale for rating composition tasks suggested by Brown and Bailey in HD Brown covers some points as follows:6
Table 3.3
Scoring Rubric of Writing (HD Brown) No. Elements of
Not college level work
5
Pandiya, Jurnal Pengembangan Humaniora Vol. 13 No. 1, April 2013, p.47.
6
2. Logical of
In this study, the researcher applied inter-rater; two raters would
employed to score the students’ writing test. The two raters were the
writer self and one the native speaker of English. The first rater is the
writer herself, and the second rater is the English teacher of SMA N 1
Kotawaringin Lama, the researcher chose the second researcher because
the second rater is expert in oral or written English.
E.Data Analysis Techniques
The data of the study was thescore of students’ mastery of past tense
After the data of mastery of past tense and writing past recount text had been collected, the scores of the two tests were analyzed to determine whether there was correlation or not between two variables covered this study.
In finding out the correlation between students’ mastery of past tense
and their achievement in expressing past activities in writing, researcher applied the product moment correlation. The formula is:
∑ (∑ )(∑ )
√* ∑ (∑ ) +* ∑ (∑ ) +
In which:
rxy : Corelation coefficient. N : the number of the subjects
ΣX : the sum of the total score in grammar test
ΣY : the sum of the total score in writing test
ΣX2 : the sum of the square total score in grammar test
ΣY2 : the sum of the square total score in writing test
ΣXY : the sum of the multiple of the score from grammar test and writing test in each number.
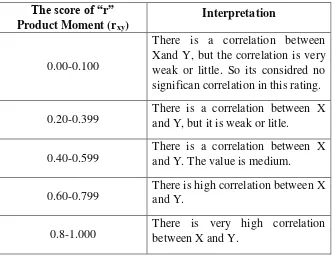
Table 3.4
The Interpretation of Correlation “r” Product Moment
The score of “r” significan correlation in this rating. 0.20-0.399
There is high correlation between X and Y.
0.8-1.000
There is very high correlation between X and Y.
Before calculated the correlation, the researcher calculated
normality, homogeneity and linearity.
1. Normality
Normality is used to know the normality of the data that is
going to be analyzed have normal distribution or not.7 Therefore, this
study used SPSS 16.0program to measure the normality of the data.
2. Homogeneity
7
Homogeniety test aimed to test the equality (homogeneity)
some samples.8 Thehomogeneity of the whole test can be estimated using
SPSS 16.0 program.
3. Linearity
Linearity test aimed to determine whether the two variables
significantly had a linear relationship or not. Moreover, to test the
linearity of the data the writer used SPSS 16.0 program.
F. Research Instruments
In this research, researcher used test as an instrument of the research.
The test devided into two: grammar test and writing test.
1. Grammar test
In grammar test, researcher asked the students to answer 25
multiple choice question with 4 alternatives answer about past tense.
2. Writing test
In writing test, researcher asked the students to construct at least 3
paragraphs about their yesterday’s activities.
3. Try Out
Before the test used as an instrument to collect the data, it had
been tried out first to the students in another class. The students were given
50 items of test and 45 minutes in doing the test. The tryout of the test was
8
held on April, 26th 2016. It was administered to different students that were
students of XI-IPS 2. 18 students were taken as the subjects of the tryout.
G.Instrument Validity
Validity is the most important consideration in developing and evaluating measuring instruments.
In this research researcher used three validities to know the instrument validity of the study, they are content validity, face validity and construct validity.
Validity is the extent to which a measure actually taps the underlying concept that it purpots to measure.9 In this study, the validity was classified into content, face and construct.
1. Content validity
Content validity is essentially and of necessity based on the judgment, and such judgment must be made separately for each situation.10It refers to whether or not the content of the manifest variables is right to measure the latent concept that is trying to measure.
2. Face Validity
According to Ary face validity is a term sometimes used in
connection with a test’s content. Face validity refers to the extent to which
9Donal Ary, at all.
Introduction to Research in Education, (Eighth Edition).(Canada:Wadsworth Cangage Learning,2010).p.229
10
examinees believe the instrument is measuring what it is supposed to measure.11
3. Construct Validity
Ary Donald states that construct validity (measurement) is the extent to which a test or other instrument measures what the researcher claims it does; the degree to which evidence and theory support the interpretations of test scores entailed by the proposed use of the test.12
Researcher use the following formula:13
r
bis =
In which:
rbis =correlation coefficient biseral
MP = mean score of correct responses
MT = Mean of the score
p = Proportion of correct responses on a single item
q =Proportion of incorrect responses on the same item (q = 1-p).
St = Standard deviation of the test score,
11
Ibid, p.288
12
Ibid, p.288
13
St =
√
∑(∑ )
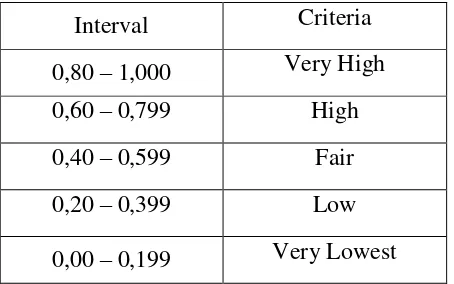
Table 3.5
To classify validity of the test the writer use the criteria of correlation coefisien biseral as follow:14
Interval Criteria
0,80 – 1,000 Very High 0,60 – 0,799 High
0,40 – 0,599 Fair
0,20 – 0,399 Low
0,00 – 0,199 Very Lowest
According to Sumarna Surapranata, if the test item has validity
0,30 (a good test item) it can be use as a research instrument, meanwhile if
the test item has validity < 0,30 it can not be use as a research instrument.15
14
Sugiyono, Metode Penelitian Pendidikan, ...., p. 257.
15
H.Instrument Reliability
Reliability is the degree of consistency with which it measures whatever it is measuring. To be able to make valid inferences from a test’s scores, the test must first be consistent in measuring whatever is being
measured.16
The writer use the following formula K-R 21:17
r
11 =[
] [
( )
]
In which:
r
11 = Instrument Reliabilityk = number of items on the test
Donal Ary, at all. Introduction to Research in Education, (Eighth Edition).(Canada:Wadsworth Cangage Learning,2010).p.238
17
Suharsimi Arikunto, Manajemen Penelitian, (Jakarta: Rineka Cipta, 2000), p.227.
18
N = mean total score of the test item.
1. Difficultly Level
The difficulty level of a test is, therefore, indicated by the
percentage of the students who get the items right. Thus, the more difficult
an item is, the fewer will be the students who answer correctly.19
To find out the difficulty level of each item in the past tense test,
the researcher used the following formula:
In which:
P= index of difficulty
B= the number of students who answer the item correctly
JS= the total number of students.
Table 3.6
The Criteria of Difficultly Level
Interval Criteria
0,00-0,30 Difficult
0,31-0,70 Medium
0,71-1,00 Easy
19 Ibid
, p. 372.
P =
After computing the difficultly level of all items and consulting to
the criteria of the diffficultly level, the following data was obtained as
follow:
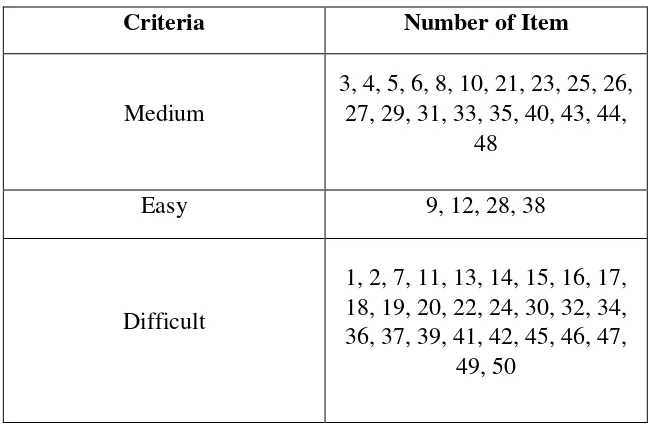
Table 3.7
Result of the Diffcultly Level of Past Tense Items
Criteria Number of Item
Medium
3, 4, 5, 6, 8, 10, 21, 23, 25, 26, 27, 29, 31, 33, 35, 40, 43, 44,
48
Easy 9, 12, 28, 38
Difficult
1, 2, 7, 11, 13, 14, 15, 16, 17, 18, 19, 20, 22, 24, 30, 32, 34, 36, 37, 39, 41, 42, 45, 46, 47,
49, 50
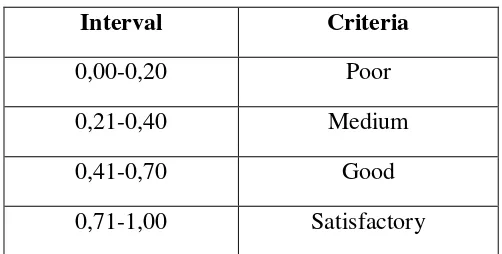
2. Discriminating Power
The index of discrimination tells us whether those students who
performed well on the whole test tended to do well or badly on each item in the
test.
To figure out the discriminating power of each item of the past
tense test the following formula was used:20
20
D = =
P
A–
P
BIn which:
D = discrimination index.
BA = number of students in upper group who answered the item correctly.
JA = number of students in upper group.
BB = number of students in lower group who answered the item correctly.
JB = number of students in lower group.
PA = proposition students in upper group who answered the item correctly.
PB = proposition students in lower group who answered the item correctly.
Tabel 3.8
The Critreia of Discrimination Index
Interval Criteria
0,00-0,20 Poor
0,21-0,40 Medium
0,41-0,70 Good