WHAT IS A COMPETITIVE
MARKET?
• A competitive market has many buyers and
sellers trading identical products so that each buyer and seller is a price taker.
– Buyers and sellers must accept the price
The Meaning of Competition
• A perfectly competitive market has the following characteristics:
• There are many buyers and sellers in the market.
• The goods offered by the various sellers are largely
the same.
The Meaning of Competition
• As a result of its characteristics, the perfectly competitive market has the following outcomes:
• The actions of any single buyer or seller in the
market have a negligible impact on the market price.
• Each buyer and seller takes the market price as
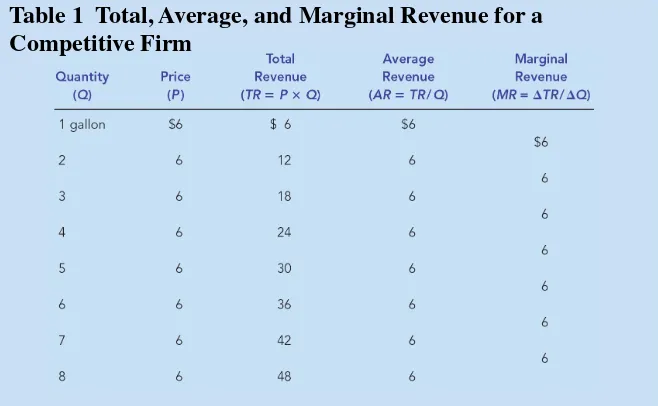
The Revenue of a Competitive Firm
• Total revenue for a firm is the selling price times the quantity sold.
• TR = (P Q)
The Revenue of a Competitive Firm
• Average revenue tells us how much revenue a firm receives for the typical unit sold.
The Revenue of a Competitive Firm
• In perfect competition, average revenue equals the price of the good.
Average Revenue = Total revenue
Quantity
Price Quantity
Quantity
Price
The Revenue of a Competitive Firm
• Marginal revenue is the change in total revenue from an additional unit sold.
• MR =TR/Q
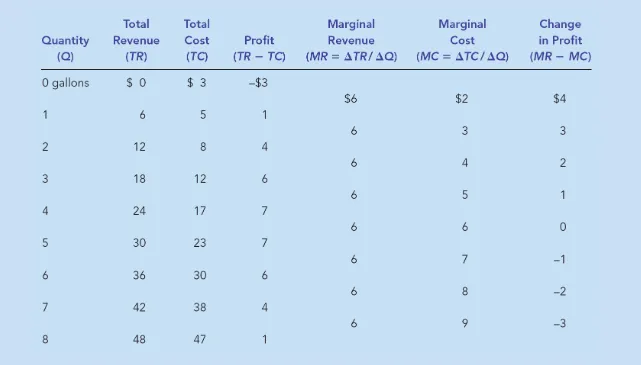
PROFIT MAXIMIZATION AND THE
COMPETITIVE FIRM’S SUPPLY CURVE
• The goal of a competitive firm is to maximize profit.
• This means that the firm will want to produce the quantity that maximizes the difference
The Marginal Cost-Curve and the Firm’s Supply Decision
• Profit maximization occurs at the quantity
where marginal revenue equals marginal cost.
• When MR > MC, increase Q
• When MR < MC, decrease Q
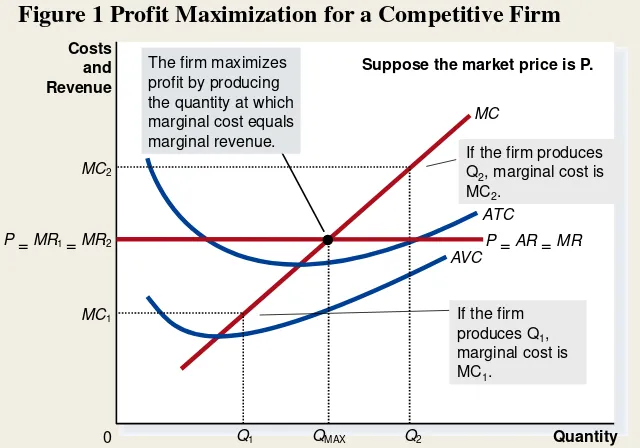
Figure 1 Profit Maximization for a Competitive Firm
The firm maximizes profit by producing the quantity at which marginal cost equals marginal revenue.
QMAX
P = MR1 = MR2 P = AR = MR
If the firm produces Q1, marginal cost is MC1.
If the firm produces Q2, marginal cost is MC2.
© 2007 Thomson South-Western
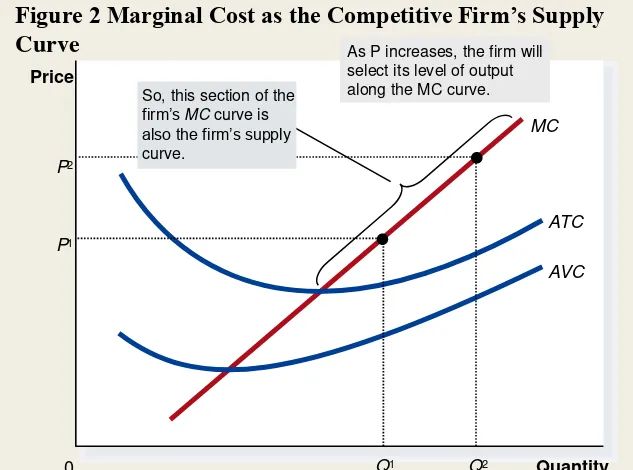
Figure 2 Marginal Cost as the Competitive Firm’s Supply
Curve
So, this section of the
firm’s MC curve is
also the firm’s supply
curve.
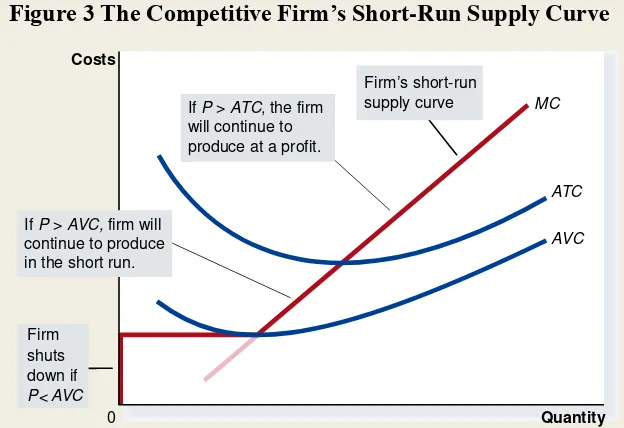
The Firm’s Short-Run Decision to Shut Down
• A shutdown refers to a short-run decision not to produce anything during a specific period of
time because of current market conditions.
The Firm’s Short-Run Decision to Shut Down
• The firm shuts down if the revenue it gets from producing is less than the variable cost of
production.
• Shut down if TR < VC
• Shut down if TR/Q < VC/Q
Figure 3 The Competitive Firm’s Short-Run Supply Curve
Firm’s short-run supply curve
If P > AVC, firm will continue to produce in the short run.
Spilt Milk and Other Sunk Costs
• The firm considers its sunk costs when deciding to exit, but ignores them when deciding
whether to shut down.
The Firm’s Short-Run Decision to Shut Down
• The portion of the marginal-cost curve that lies above average variable cost is the competitive
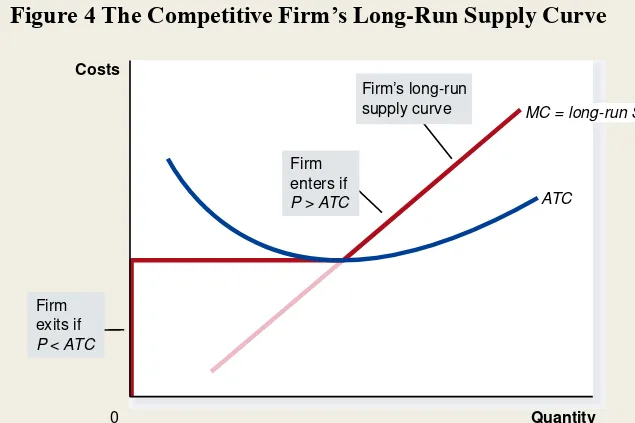
The Firm’s Long-Run Decision to Exit or Enter a Market
• In the long run, the firm exits if the revenue it would get from producing is less than its total cost.
• Exit if TR < TC
• Exit if TR/Q < TC/Q
The Firm’s Long-Run Decision to Exit or Enter a Market
• A firm will enter the industry if such an action would be profitable.
• Enter if TR > TC
• Enter if TR/Q > TC/Q
© 2007 Thomson South-Western
Figure 4 The Competitive Firm’s Long-Run Supply Curve
MC = long-run S
Firm’s long-run supply curve
Firm enters if
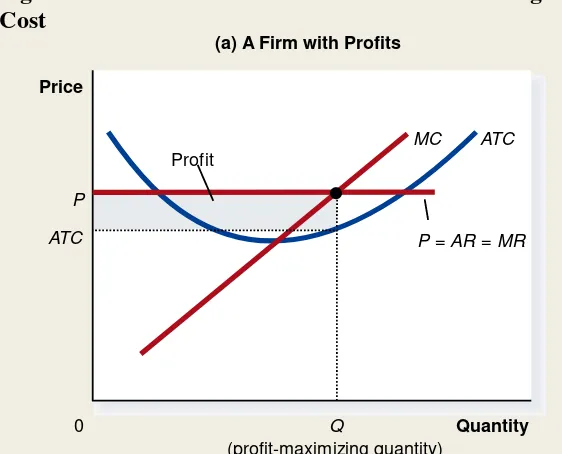
Measuring Profit in Our Graph for the Competitive Firm
• Profit = TR – TC
© 2007 Thomson South-Western
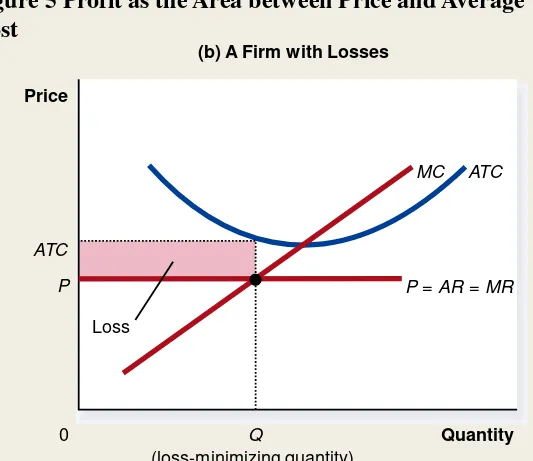
Figure 5 Profit as the Area between Price and Average Total Cost
(a) A Firm with Profits
Figure 5 Profit as the Area between Price and Average Total Cost
(b) A Firm with Losses
THE SUPPLY CURVE IN A
COMPETITIVE MARKET
• The competitive firm’s long-run supply curve
THE SUPPLY CURVE IN A
COMPETITIVE MARKET
• Short-Run Supply Curve
– The portion of its marginal cost curve that lies
above average variable cost.
• Long-Run Supply Curve
– The marginal cost curve above the minimum point
THE SUPPLY CURVE IN A
COMPETITIVE MARKET
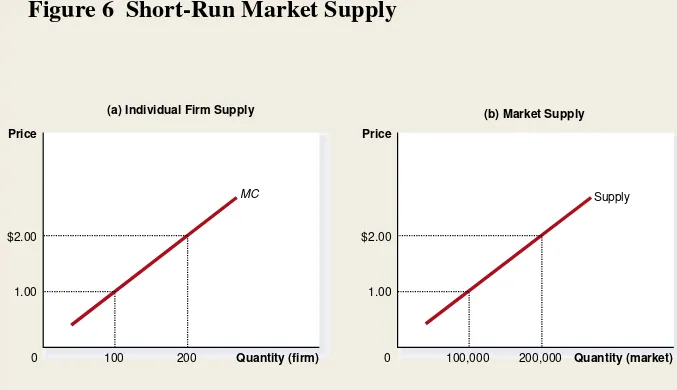
The Short Run: Market Supply with a Fixed Number of Firms
• For any given price, each firm supplies a quantity of output so that its marginal cost equals price.
• The market supply curve reflects the individual
© 2007 Thomson South-Western
Figure 6 Short-Run Market Supply
(a) Individual Firm Supply
Quantity (firm)
(b) Market Supply
Quantity (market)
If the industry has 1000 identical firms, then at each market price, industry
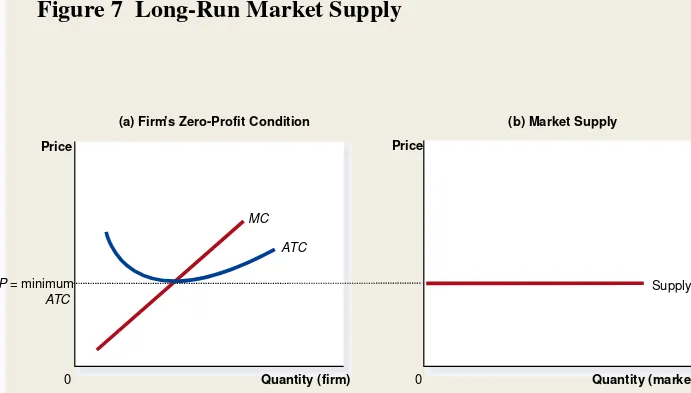
The Long Run: Market Supply with Entry and Exit
• Firms will enter or exit the market until profit is driven to zero.
• In the long run, price equals the minimum of average total cost.
© 2007 Thomson South-Western
Figure 7 Long-Run Market Supply
(a) Firm’s Zero-Profit Condition
Quantity (firm)
0
Price
(b) Market Supply
The Long Run: Market Supply with Entry and Exit
• At the end of the process of entry and exit, firms that remain must be making zero
economic profit.
• The process of entry and exit ends only when price and average total cost are driven to
equality.
Why Do Competitive Firms Stay in Business If They Make Zero Profit?
• Profit equals total revenue minus total cost.
• Total cost includes all the opportunity costs of the firm.
• In the zero-profit equilibrium, the firm’s
A Shift in Demand in the Short Run and Long Run
• An increase in demand raises price and quantity in the short run.
© 2007 Thomson South-Western
Figure 8 An Increase in Demand in the Short Run and Long Run
Firm (a) Initial Condition
Quantity (firm)
Short-run supply, 1
P1
A market begins in long run equilibrium.
Figure 8 An Increase in Demand in the Short Run and Long Run
Market Firm
(b) Short-Run Response
Quantity (firm)
An increase in market demand… …raises price and output.
The higher P encourages firms to produce
© 2007 Thomson South-Western
Figure 8 An Increase in Demand in the Short Run and Long Run
P1
Firm
(c) Long-Run Response
Quantity (firm)
Profits induce entry and market supply increases.
Why the Long-Run Supply Curve Might Slope Upward
• Some resources used in production may be available only in limited quantities.
• Firms may have different costs.
• Marginal Firm
• The marginal firm is the firm that would exit the
Summary
• Because a competitive firm is a price taker, its revenue is proportional to the amount of output it produces.
• The price of the good equals both the firm’s
Summary
• To maximize profit, a firm chooses the
quantity of output such that marginal revenue equals marginal cost.
• This is also the quantity at which price equals marginal cost.
• Therefore, the firm’s marginal cost curve is its
Summary
• In the short run, when a firm cannot recover its fixed costs, the firm will choose to shut down temporarily if the price of the good is less than average variable cost.
Summary
• In a market with free entry and exit, profits are driven to zero in the long run and all firms
produce at the efficient scale.
• Changes in demand have different effects over different time horizons.
• In the long run, the number of firms adjusts to drive the market back to the zero-profit