WATER AGRONOMIC ETRANGÈRES
AND RURAL DEVELOPMENT BOARD SCAC NAMIBIE
Mahangu Urban Consumption Survey
Final report
Sabine Leporrier
Antoine Leveau
Sandrine Dury
Nicolas Bricas
WATER AGRONOMIC ETRANGÈRES
AND RURAL DEVELOPMENT BOARD SCAC NAMIBIE
Rapport final d'exécution de la convention entre le MAE/SCAC Namibie et le CIRAD-Amis n° 2002/007/CP/980139 notifiée le 29/03/2002
Mahangu Urban Consumption Survey
Final report
Sabine Leporrier
Antoine Leveau
Sandrine Dury
Nicolas Bricas
CIRAD-AMIS, Programme Agro-Alimentaire
TA 40/16, 34398 Montpellier Cedex 5, France
Tél : (33)(0) 467 61 57 12 (N. Bricas)
E. Mail :
[email protected]
[email protected]
List of Tables... 5
List of Figures ... 6
Foreword... 7
Acknowledgements... 8
Abstract... 9
1 Introduction... 10
1.1 Background...10
1.2 Objectives of the study...10
1.3 Structure of the report ...11
2 Methodology ... 12
2.1 Qualitative survey ...12
2.2 Quantitative survey...12
2.2.1 Sampling method ...12
2.2.2 The Living Standard Measure, a tool to assess income level...13
3 Results... 14
3.1 Characteristics of the market ...14
3.1.1 Overall population characteristics...14
3.1.2 Size of the consumer market in Windhoek and Oshakati...14
3.1.3 Traded – non-traded urban consumer supply...15
3.2 Urban consumer characteristics ...15
3.2.1 The strong influence of the cultural background ...15
3.2.2 Size of household...16
3.2.3 Income level...17
3.3 Price, availability of cereals and substitution effects...18
3.3.1 Current prices on the market...18
3.3.2 Availability of cereals and substitution habits ...19
3.4 Uses of mahangu ...20
3.4.1 Everyday consumption...20
3.5.2 Sources of supply...22
3.5.3 Forms of supply...23
3.5.4 The importance of service milling ...24
3.6 Industrial and semi-industrial products...25
3.6.1 Origin of the bought flour: a good penetration of "commercial" flour compared to industrial flour ...25
3.6.2 Brand fame ...26
3.7 Processing of mahangu ...27
3.7.1 Fermentation...27
3.7.2 Maize as a complement to mahangu...29
3.8 Perception of the products ...31
3.8.1 Maize versus mahangu? ...31
3.8.2 The pioneer ...32
3.8.3 Opinions about mahangu ...33
3.8.4 Interest in new products ...34
3.8.5 Quality criteria ...34
3.9 Projections of demand for the year 2010 in Windhoek...35
3.9.1 Effect of population growth...35
3.9.2 Effect of income growth...35
3.9.3 Projection of demand ...36
4 Conclusion and recommendations ... 37
4.1 Highlights of the study:...37
4.1.1 High demand from urban dwellers originally from production areas...37
4.1.2 A large proportion of urban consumption goes through the non-traded chain, and most market mahangu flour is cheap. ...37
4.1.3 Image of tradition but negative income elasticity. Trend towards diversification and reduction of millet consumption. ...37
4.2 How can this paradox of an apparent "positive image" and a negative income elasticity be explained?...37
4.3 Promotion of millet should distinguish two different market segments...38
4.3.1 Segment one: grain and flour for regular porridge consumers ...38
4.3.2 Segment two: new products for new consumers...39
4.4 Recommendation for policy implementation...39
4.5 Further partnerships with research...40
4.5.1 Decentralised mechanisation...40
4.5.2 Identification and development of new products...40
4.5.3 Promotion of the new products ...40
4.5.4 Collective organisation of the stakeholders ...41
4.5.5 Prices' built up, price elasticity of demand and impact on nutrition...41
Glossary... 42
Selection of Survey Areas... I Sampling strategy in Windhoek... I Field work and training ...II
Qualitative survey... II Quantitative survey... II LSM characteristics... II
Appendix II. Other tables and figures... IV
Appendix III. A few indications on prices ...VII
Appendix IV. Modelling of the factors affecting the quantity consumed VIII
The variables used ...VIII Impact of different factors on consumption ...VIII Living standard elasticity ...IX
Appendix V. Simulation of demand in 2005 and 2010 ... XI
Appendix VI. A few indications on prices ...XII
Appendix VII. Similarities with Senegal... XIII
Appendix VIII. Presentation of MELINA: a training course in "Methods
for launching food innovations on African urban markets" ...XIV
Table 1: Sample size...13
Table 2: Population size of Windhoek and Oshakati...14
Table 3: Key urban market indicators for mahangu. July 2002. ...15
Table 4: Respondent mother tongue distribution, for consumers, non-consumers and the whole population in Windhoek and in Oshakati...16
Table 5: Ratio of consumers according to the respondent’s mother tongue, and proportion in the whole population of Windhoek...16
Table 6: Comparison of prices of different staples in Oshakati, 22-24 May 2002...18
Table 7: Distribution of consumers (%) according to frequency of preparation, for each dish. ...21
Table 8: Ratio of consumers who had purchased a brand in the past month (July 2002)...25
Table 9 : Fame of different brands of mahangu flour available on the market...26
Table 10: Percentage of consumers using fermented/unfermented flour. ...27
Table 11: % of reasons mentioned for mixing maize and mahangu when cooking porridge. .30 Table 12: % of reasons mentioned for NOT mixing maize and mahangu when cooking porridge. ...30
Table 13: Reason why non-consumers have never tried a mahangu product. ...31
Table 14: Reasons given by people who have tasted mahangu a least once for why do they not consume it regularly. ...32
Table 15: Ratio of non-consumers who have never tasted a mahangu product, according to mother language. ...32
Table 16: Some views of non-mahangu consumers...33
Table 17: Opinions of mahangu consumers when asked why people do not consume more mahangu in Oshakati and Windhoek. ...33
Table 18: Interest of non-mahangu consumers in new mahangu products...34
Table 19: Percentage of consumers saying these criteria are important in evaluating flour quality, according to LSM (Windhoek)...34
Table 20: Percentage of consumers saying these criteria are important in evaluating grain quality, according to LSM (Oshakati)...35
Table 21: Weighting of the data ... II
Table 22: Weight range for assigning respondent to LSM groups... III
Table 23: Results of the stepwise regression analysis... III
Table 24: Rate of household consumption in Windhoek per constituency. ...IV
Table 25: Quantity of mahangu consumed per person and per month...IV
Table 26 Consumption of mahangu per consumer, according to household composition... V
Table 29: Comparison of prices of different staples in Oshakati, 22-24 May 2002...VII
Table 30: Results of the estimation of the model for the entire population...IX
Table 31: Results of the estimation of the model for Windhoek only. ...IX
Table 32: Results of the estimation of the model for Oshakati only ... X
Table 33: Simulation of demand in 2010 according to 8 different simple scenariosof income and population growth...XI
Table 34: Comparison of the mahangu flour prices according to different stores,
brands and packaging in Oshakati, 22-24 May 2002 ...XII
Table 35: Comparison of prices of different staples in Oshakati, 22-24 May 2002...XII
List of Figures
Figure 1: Evolution of average quantity of mahangu consumed per person and per month
according to the size of household ...17
Figure 2: Evolution of quantity consumed in Windhoek as income level increases...18
Figure 3: Proportion of cereal used for human consumption in Namibia. FAOstat 2001...19
Figure 4: Availability of white rice over the past ten years (kg/inhab). FAO stat 2001 ...20
Figure 5: Channels of supply according to LSM in Wind hoek and Oshakati ...22
Figure 6: Sources of supply according to LSM in Windhoek and Oshakati ...23
Figure 7: Market share of industrial and commercial products according to LSM...26
Figure 8: Reasons for using fermented or unfermented flour ...28
Figure 9: Reasons why consumers prefer fermented flour, by city...28
Figure 10: Reasons why consumers prefer unfermented flour, by city...29
Figure 11: Projected population of Windhoek ...35
Figure 12 Windhoek age distribution. Resident survey 1995 ...IV
Figure 13: Distrib ution of consumers according to income level. UCS 2002 ... V
Foreword
The results given in this report come from a consumption survey which was conducted
over a relatively short period of time by two students from France, with the help from 4
students from UNAM, under the supervision of one UNAM lecturer and one researcher from
CIRAD, during two 10-day missions. CIRAD was chosen because it had previously
conducted similar work in several other African countries. However, Namibia has its own
specific situation, and the period of the study did not allow a full appreciation of the dynamics
of the socio-economic patterns which are the very basis of consumer behaviour. Moreover,
cereals production and consumption change according to the season and the year. The results
Acknowledgements
The authors wish to thank the following persons for their precious advice and contributions
to this work: Ben Bennett of the Directorate of Planning, Thierry Dauplais of the French
co-operation service, Michel Mallet of CRIAA, and Paully Iipinge from MMIU for the time he
spent with us meeting commercial millers, and the full access he gave us to MMIU office
facilities.
We also wish to thank the Namibian Agronomic Board for its full support regarding
material arrangements, and the availability of Christof Brock. We are grateful to Annie Zapke
for her kindness and professionalism.
Thanks to Ottilie Mwazi and Alves Weerasinghe from the National Planning Commission
for their advice and material support in the sampling and organisation of the field work.
The collaboration of UNAM lecturer Naita Nghaamwa and the students involved in the
first phase of the project was particularly important to us. We should like to thank them here
for their contribution.
We would also like to thank all the members from the Mahangu and Sorghum Task Team
for their comments during the feedback meeting in Windhoek on 28th October 2002.
We are grateful to the French co-operation service (SCAC) in Windhoek, and to Bertrand
Abstract
Millet consumption is significant in both Oshakati and Windhoek, in terms of both the
quantity consumed (7.4 kg and 2.1 kg respectively per person and per month) and the
frequency of consumption (more than 80% of consumers eat porridge more than 3 times a
week). Urban dwellers who come from non-producing areas do not consume millet, whilst the
others remain loyal to the product, which is a link to their rural origins. However, the data
collected show a clear trend towards substitution amongst the wealthiest households, and
young urban dwellers who tend not to prepare millet, even if they eat it in their village.
Total consumption is estimated at about 500 tons grain equivalent in each city for the
month of June 2002. Half of the supply goes through non-trade chain. In Windhoek, people
buy only flour, and in Oshakati only grain. Most housewives prefer buying grain and
processing it themselves, rather than buying industrial flour. Most of them are suspicious of
the quality of the industrial product and process. Consumption takes place at home, and the
quantity consumed in the street /restaurants is almost zero, except for sorghum beer (Tombo).
More than 10 recipes (beverages and dishes) have been identified, but two of them, porridge
(thin or thick) and the beverage “oshikundu”, represent 90% of the millet consumed.
Two different segments should be targeted to improve the competitiveness of millet. The
first concerns the traditional consumers, and the products for preparing porridge (grain/flour).
Facilitating access to grain and to service mills in Windhoek would increase the demand for
millet. The second segment concerns the non-consumers. New products should be developed,
or old products renamed, with high standards of quality. At the same time, a new image of
1
Introduction
1.1 Background
Millet (mahangu) and sorghum represent the major part of grain production in Namibia. The Namibian government believes that both production and consumption could be improved. It was supposed that consumers had a strong preference for the traditional mahangu over maize. In a context of rapid urbanisation and a growing cash economy, it was supposed that millet could out-compete maize in certain segments of the Namibian urban market. Concomitantly, the higher the value of the mahangu products brought to formal markets by the commercialisation process, the more favourable the resulting terms of trade would be for
mahangu producers.
Despite the formation of the Mahangu Marketing Intelligence Unit (MMIU) to bring producers and buyers of mahangu together, and despite private-sector intitiatives to market dry-milled mahangu flour and products made from mahangu or sorghum, communal-area grain producers are still restricted by a lack of ready markets, while the development of markets is restricted by low and uneven production, aggravated by a semi-arid climate with irregular rainfall.
In an attempt to find a solution to these problems, the Government, in partnership with the main stakeholders involved in the mahangu sector, has designed a comprehensive strategy, which aims to improve the chain at all levels. One of the main gaps identified is the lack of proper information about urban mahangu consumers (who they are, what they want, how to reach them, and how to improve their utilisation of the grain), where the main potential market development lies.
1.2
Objectives of the study
- To clarify the extent of mahangu (and other local product) consumption in cities, and to identify the determining factors of consumption. Is consumption linked to the standard of living, to the region of origin, and to the age of the consumer? How big is the urban market? From a consumer point of view, how do the different cereals compete with or complement each other?
- To identify the forms in which the local products are procured and processed. Who buys flour? Who buys grain for processing? What are the markets for processed mahangu? Can the catering/restaurant sector be a significant outlet for the promotion of local products?
1.3 Structure of the report
2
Methodology
(see details in appendix I).
The study was conducted in two phases (qualitative and quantitative) in Oshakati and Windhoek between May and October 2002. Many expectations and many objectives were assigned directly to the study: these include quantification of the market, of opinions/perceptions, estimates of income elasticity for the different staple foods, estimates of own price elasticity, of cross price elasticity, etc.
During the first phase (qualitative interviews), it appeared that almost none of the interviewees were aware of the fact that millet was cheaper than maize. It was also shown that more than half of the millet consumed in cities was supplied through a non-market chain. This led us to conclude that market price was not really a concern for consumers, at least in the short term, and that consumption was more linked to socio-cultural factors and income than to the relative price of millet and its substitutes. Because of the duration of the study (6 months) and the way in which it was organised (see foreword), it seemed wiser to focus the study on defining and quantifying the different opinions and perceptions from households, and quantifying consumption1.
2.1
Qualitative survey
The qualitative information was collected with the collaboration of UNAM students. A total of approximately 80 in-depth interviews were conducted. These were then used to construct the questionnaire, analyse the results and understand the perceptions. The team adapted the type of interviewees each week, in order to obtain as many different points of view as possible.
2.2
Quantitative survey
2.2.1
Sampling method
During the qualitative survey, it was assessed that most mahangu was consumed within the household, at family meals or with guests. Because of the little information available on the structure of the population (data from the 2001 census were not complete), it was decided to conduct a household sampling, rather than a individual one. The advantage of choosing households is that it allows quantification of the quantities consumed and extrapolation for the city. The drawback is that opinions and perceptions from children and teenagers are not quantified. These were, however, discussed in individual interviews.
1
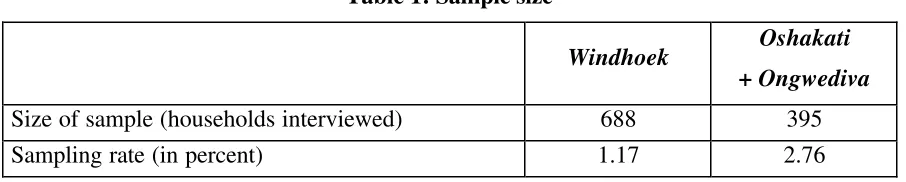
The quantitative survey was based on a 12-page pre-coded questionnaire. It consisted of three main parts, one for the general socio-economic overview, one for consumers and one for non-consumers. It was conducted with 400 households in Oshakati and almost 700 in Windhoek. The sample was weighted according to district sizes, in order to make it representative.
Table 1: Sample size
Windhoek Oshakati + Ongwediva
Size of sample (households interviewed) 688 395
Sampling rate (in percent) 1.17 2.76
2.2.2
The Living Standard Measure, a tool to assess income level
3
Results
3.1 Characteristics of the market
3.1.1
Overall population characteristics
The cities of Windhoek and Oshakati have different population structures, as well as a different context, both of which influence food consumption and market characteristics.
Table 2: Population size of Windhoek and Oshakati
Windhoek Oshakati
+ Ongwediva
Population size (2001 census) 250,305 70,045
Number of households (2001 census) 58,575 14,313 Average number of people per household 5.2 5.7
Windhoek, with more than 250,000 habitants, represents 14% of the national population. Its growth rate was 5.44 % per year between 1991 and 1995, and 6.3 % per year between 1995 and 20011. Given the fact that the natural growth rate is around 1.5% per year2, Windhoek has a net annual migration gain of 4.8% per year, which represents between 10,000 and 15,000 new migrants annually. Over the past ten years, 44% of these migrants3 came from the North Central Areas, which are also mahangu- and sorghum-producing areas.
The 20-to-35 age group is relatively larger than would be the case for the country as a whole, mainly due to the in-migration of people in these age groups (see
Figure 12) (Windhoek resident survey 1995). This relatively high flow of migrants with a mahangu and sorghum traditional background coming to Windhoek will contribute to an increase in the number of mahangu consumers in the capital in the future.
3.1.2
Size of the consumer market in Windhoek and Oshakati
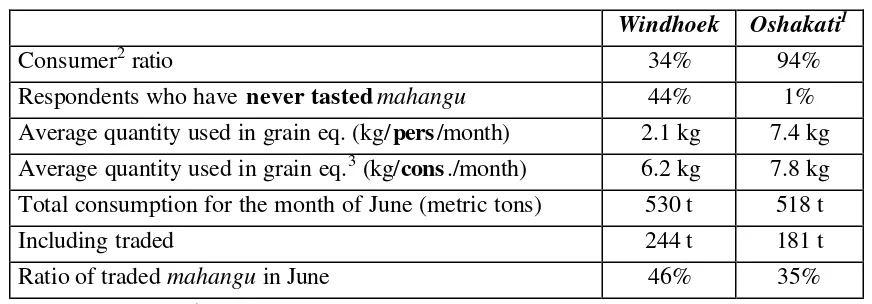
One of the first objectives of the study was to estimate the importance of mahangu
consumption in the two cities. The results, as illustrated in Table 3, show a big difference if we look at the mahangu consumer / non-consumer ratio. Moreover, average consumption of consumers in Windhoek is 30% lower than in Oshakati, dropping from 7.8 kg4/consumer per month in Oshakati to 6.2 kg in Windhoek. The consumption pattern also varies a lot from one constituency to another. Detailed rates of consumption per constituency are given in Table 24.
1
Calculated from the 2001 Census preliminary results
2 Natural growth rate per year between 1991 and 1995 from Windhoek Resident Survey Report, 1995
3
Table 3: Key urban market indicators for mahangu. July 2002.
Windhoek Oshakati1
Consumer2 ratio 34% 94%
Respondents who have never tastedmahangu 44% 1% Average quantity used in grain eq. (kg/pers/month) 2.1 kg 7.4 kg Average quantity used in grain eq.3 (kg/cons./month) 6.2 kg 7.8 kg Total consumption for the month of June (metric tons) 530 t 518 t
Including traded 244 t 181 t
Ratio of traded mahangu in June 46% 35%
t = metric ton = 1000 kg.
3.1.3
Traded – non-traded urban consumer supply
An important factor to note with respect to the mahangu market is the minor role of traded products in the supply chain as a whole. Even if we consider that these data change from one month to another4, reciprocal gifts between rural and urban family members are still very important in both cities. This is an illustration of the strong traditional links between urban consumers and their rural counterparts. One of the consequences is that people are not directly sensitive to market prices, since most of them imagine they have "mahangu for free".
3.2
Urban consumer characteristics
The data collected makes it possible to test the influence of different variables on the consumption/non-consumption pattern in the population. In this section, we present the different factors by decreasing order of importance.
3.2.1
The strong influence of the cultural background
The first factor influencing mahangu consumption is linked to the respondent’s mother tongue. Respondents whose mother tongue was Oshiwambo clearly appear to be the main homogenous group of consumers.
1
Throughout the report, the term Oshakati is used to describe the cities of both Oshakati and Ongwediva. 2 A consumer is defined as a person who eats mahangu at least once a month
3
Average per consumer of mahangu. This does not concern the whole population.
Table 4: Respondent mother tongue distribution, for consumers, non-consumers and the whole population in Windhoek and in Oshakati.
Windhoek Oshakati
Mother tongue
Consumer Non-consumer Whole population
Consumer Whole pop.
Oshiwambo 85 6 33 97 95
Afrikaans 3 36 25 1 1
Damara-Nama 4 25 18 0 0
Otjiherero 3 20 14 0 0
Other 5 13 10 2 4
Total 100 100 100 100 100
Whilst 85 % of the consumers in Windhoek declared Oshiwambo to be their mother tongue (97% in Oshakati), no other language group represents more than five percent of the consumers.
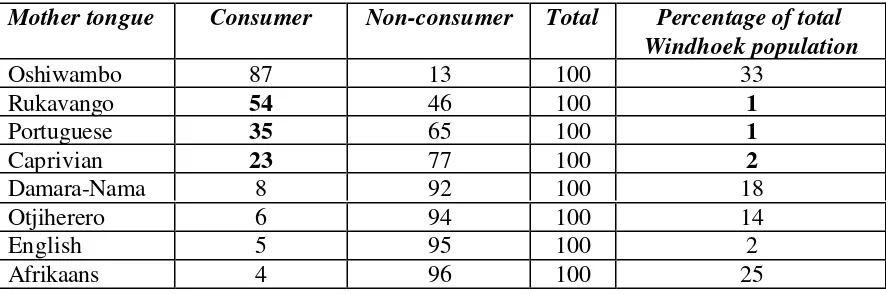
However, the consumption rate appears to be significant within specific mother language groups. Table 5 indicates the ratio of consumers in Windhoek according to their mother tongue. More than half of the Rukavango-speaking people interviewed eat mahangu, but they represent only a small percentage of the population of Windhoek.
Table 5: Ratio of consumers according to the respondent’s mother tongue, and proportion in the whole population of Windhoek
Mother tongue Consumer Non-consumer Total Percentage of total Windhoek population
Oshiwambo 87 13 100 33
Rukavango 54 46 100 1
Portuguese 35 65 100 1
Caprivian 23 77 100 2
Damara-Nama 8 92 100 18
Otjiherero 6 94 100 14
English 5 95 100 2
Afrikaans 4 96 100 25
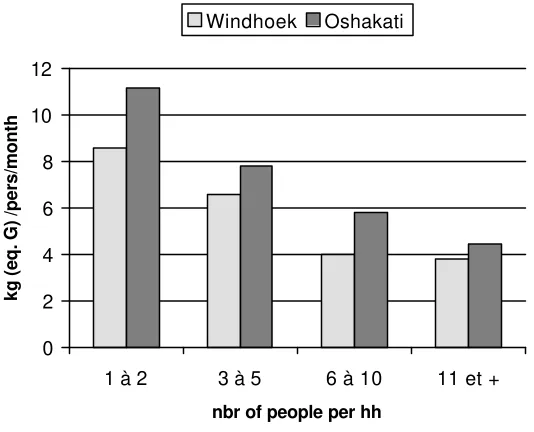
3.2.2
Size of household
Figure 1: Evolution of average quantity of mahangu consumed per person and per
month according to the size of household (data in Table 18 in annex II)
0 2 4 6 8 10 12
1 à 2 3 à 5 6 à 10 11 et +
nbr of people per hh
kg (eq. G) /pers/month
Windhoek Oshakati
Different factors may explain this strong trend:
- Large households have more young children who consume less, and who are more attracted by new foods.
- As the household gets bigger, decisions about the food prepared are not only related to the parents, and compromises have to be found. This often involves more substitution.
- The coarse taste of mahangu flour, the sand, and the relatively small variety of recipes available are also common answers when young people are asked about their preferences.
Changes also occur in terms of meal preparation in bigger households. Whilst there is a significant decrease in the consumption of the thick porridge oshifima*, consumption of the soft fermented drink oshikundu* tends to increase with family size. Whereas 40% of mahangu
consumers who live alone or in a couple say that they do not prepare the drink, this rate drops to 27% when there are between 6 and 10 people living in the household. The presence of children is favourable to consumption of this drink.
3.2.3
Income level
Considering only the Oshiwambo population, the LSM does not affect the consumer ratio in either city. However, when we look at the quantities consumed, there does appear to be income elasticity (income is approximated by LSM). We estimate that income elasticity equals –0.18 for the whole urban population (Oshakati+Windhoek) using a log-log model (see details in appendix III). This result1 is illustrated in Figure 2. Only respondents who consume
mahangu are represented in the graph below2.
1
Income elasticity indicates how the demand changes when the income level changes. Usually, income elasticity is positive between 0 and 1. It is negative when consumption tends to decrease as income increases.
Figure 2: Evolution of quantity consumed in Windhoek as income level increases.
This figure, and the results of the modeling (Appendix III), show a negative elasticity of consumption. This illustrates the fact that mahangu products are considered as a staple food. Nevertheless, consumption remains relatively high, even for the higher income bands.
3.3 Price, availability of cereals and substitution effects
3.3.1
Current prices on the market
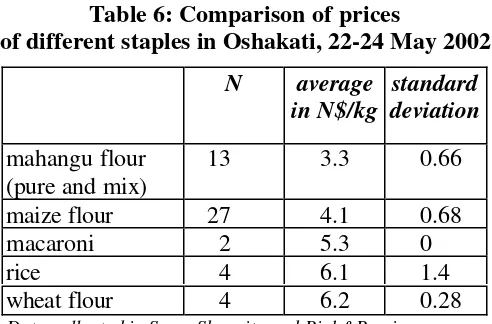
In October in Windhoek the cheapest staple food in the supermarket was mahangu at N$ 4.40/Kg. Next came maize at N$ 5.15, and then rice and potatoes at N$ 6. Pasta was more expensive at N$ 9/Kg1. In May in Oshakati, the prices were lower for mahangu flour (3.3 N$/kg), for maize flour (4.1 N$/kg), and for macaroni (5.3 N$/kg). The rice and wheat flour were equivalent to those found in Windhoek in October (about 6 N$/kg). Appendix III gives details on the mahangu prices in Oshakati according to place of sale, packaging and brand.
Table 6: Comparison of prices
of different staples in Oshakati, 22-24 May 2002
N average
maize flour 27 4.1 0.68
macaroni 2 5.3 0
rice 4 6.1 1.4
wheat flour 4 6.2 0.28
Data collected in Spar, Shoprite and Pick&Pay in Oshakati, 22-25 May 2002
appendix II), it is not significant to present these results for the whole population. 1
During all the period of the study, it thus appeared that in both Oshakati and Windhoek,
mahangu flour was the cheapest product. This situation is however not usual, and due to the high variability of maize and rice prices on international markets, as well as the current depreciation of the Namibian dollar, it is subject to variation. As said in the methodology, people seem to have a slow reaction the price variations in the supermarkets and the duration of the study did not allow to analyse in detail these reactions which are complex since they are linked to the non marketed supply.
3.3.2
Availability of cereals and substitution habits
When mahangu consumers are asked what other staple foods they eat instead of mahangu, only three major products are mentioned regularly. These are rice, pasta (wheat), and vegetables (bean and potatoes). Maize is not really considered as a substitute. However, it does appear to be used as a supplement to mahangu. Most mahangu consumers (80% in Windhoek, 70% in Oshakati) mix mahangu with maize for different reasons, but rarely consume maize alone. The new trend of access to affordable rice and pasta, whilst maize prices are rising, tends to amplify this diversification. These products all represent an alternative to the traditional porridge. At the national level, maize supply tends to compensate for low mahangu production, in order to provide to the country with more than 300,000 metric tons of cereals per year for human consumption (for 2000, excluding beer, FAOstat). Millet represents one fifth of national cereal consumption, with maize and white rice representing one third each (Figure 3).
Figure 3: Proportion of cereal used
for human consumption in Namibia1. FAOstat 2001
0% 10% 20% 30% 40% 50% 60% 70% 80% 90% 100%
1990 1991 1992 1993 1994 1995 1996 1997 1998 1999 White rice Wheat Maize Millet
If we consider the increase in the population, the availability of rice per inhabitant has remained very stable over the past ten years (cf. Figure 4). The data do not show a tendency to substitute other cereals.
Figure 4: Availability of white rice
over the past ten years (kg/inhab). FAO stat 2001
0 10 20 30 40 50 60 70
1990 1991 1992 1993 1994 1995 1996 1997 1998 1999 2000
years
kg/inhab
There have not been any important changes in consumption over the past ten years. There seems to be a good balance between cereals. The main variation comes from the availability of mahangu, due to climate fluctuations. Less mahangu implies more maize imports, but it does not affect the amount of rice imported.
3.4 Uses of
mahangu
3.4.1
Everyday consumption
A broad variety of meals and drinks made out of mahangu have been identified.
The most popular meal is the traditional oshifima, a thick porridge made from fermented or unfermented flour1. (83% of consumers in Windhoek and 95% in Oshakati prepare it at least once every two days). High consumption decreases in the higher income levels, but one third of consumers in LSM 5 eat it at least once a day, and one quarter in LSM 6 in Windhoek.
In Oshakati, consumption levels remain very high in all income groups. Fifty percent of the highest income level consume it at least once a day.
The other important dish is okatete, a thin mahangu porridge commonly prepared for young children and babies. Half of the consumers prepare it at least every two days. But almost 40% of consumers never prepare it, particularly those who do not have young children. The cake omungome, made with mahangu flour, is also very popular with young children. The other dishes, oshitaka* and olumbololo*, are consumed by only about one third of consumers.
Street consumption of these products is very low. In Windhoek no small restaurant or caterer was found selling any of these products (except for the drinks), and in Oshakati there were very few. But, with expansion of the city, and increasing distances between home and work, this kind of service may well appear in the future.
1
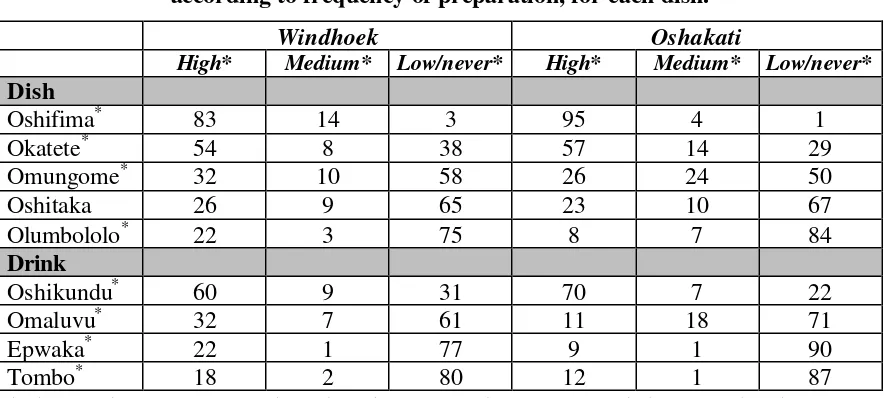
Table 7: Distribution of consumers (%) according to frequency of preparation, for each dish.
Windhoek Oshakati
High* Medium* Low/never* High* Medium* Low/never*
Dish
Oshifima* 83 14 3 95 4 1
Okatete* 54 8 38 57 14 29
Omungome* 32 10 58 26 24 50
Oshitaka 26 9 65 23 10 67
Olumbololo* 22 3 75 8 7 84
Drink
Oshikundu* 60 9 31 70 7 22
Omaluvu* 32 7 61 11 18 71
Epwaka* 22 1 77 9 1 90
Tombo* 18 2 80 12 1 87
*high: more than 12 times a month; medium: between 1 and 12 times a month; low/never: less than once amonth)
The drinks are also commonly prepared, especially oshikundu*, a fermented but non-alcoholic drink made from mahangu flour and malted sorghum. It is an everyday drink known for its nutritious energy-giving and refreshing attributes, and is enjoyed by the whole family. Fermented flour is not necessary for its preparation, as it ferments anyway during the process. That is why non-fermented commercial flour is often used to prepare it, which helps to save the fermented flour from the farms.
The other drinks are alcoholic beverages, more popular in Windhoek household consumption. But this data does not take into account the significant street consumption of these products.
3.4.2
Special occasions
As a traditional product, mahangu is associated with many social and cultural events in northern areas. In addition to the oshifima and oshikundu described above, the fermented drink omaluvu is very common on such occasions. But no other dish appears to be prepared or consumed on such occasions.
3.5
Channels and forms of
mahangu
supply
In contrast to other cereals1, mahangu is grown in communal areas2 in Namibia, mostly for on-farm consumption purposes. Because many urban dwellers have relations who farm in these areas, an important part of the urban family’s mahangu supply comes through non-commercial channels (about 70% of mahangu consumers say they have access to products from family farms in Windhoek and Oshakati).
1
3.5.1
Traded vs non-traded mahangu
For the month of June, about 60% of consumers in Oshakati, and 50% in Windhoek said that they get their mahangu "as a gift". And the relative share of this "mahangu for free" tends to increase as incomes increase (see Figure 5).
Figure 5: Channels of supply according to LSM in Windhoek (left) and Oshakati (right)
0 20 40 60 80 100
1 2 3 4 5 6
LSM
%
given bought other
0% 20% 40% 60% 80% 100%
LSM1 LSM2 LSM3 LSM4 LSM5 LSM6
LSM
given bought other
Non-commercial channels of supply show the importance of mahangu in Oshiwambo social organisation. Urban family members supplied by their rural family do not usually pay or exchange anything for the mahangu. It is considered as a gift. And, as with any gift, there is a reciprocity to it, but not necessarily at the same time or for the same commercial value (this can be clothes, money, goods or food). Its first purpose is to enhance social links and solidarity between family members. Each transaction usually allows family consumption once or twice per month.
3.5.2
Sources of supply
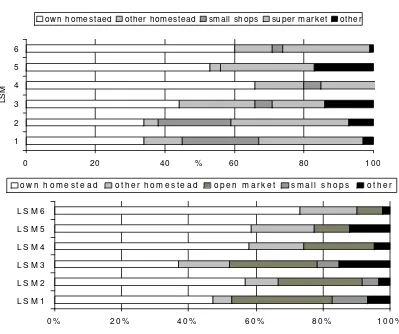
In terms of sources of supply, diversification increases with income level. For traded
Figure 6: Sources of supply according to LSM in Windhoek (above) and Oshakati (below)
0 20 40 60 80 100
1 2 3 4 5 6
LSM
%
own homestaed other homestead small shops super market other
0 % 2 0 % 4 0 % 6 0 % 8 0 % 1 0 0 %
L S M 1 L S M 2 L S M 3 L S M 4 L S M 5 L S M 6
o w n h o m e s t e a d o t h e r h o m e s t e a d o p e n m a r k e t s m a l l s h o p s o t h e r
The importance of the open market as a source of supply decreases significantly in Windhoek, where the supermarket is the most important. Since most of the mahangu trade in Windhoek goes through the supermarkets, it is important that the mahangu available there should be able to compete with other products in terms of both quality and availability.
3.5.3
Forms of supply
• Grain in Oshakati, but flour in Windhoek
The answers show important differences between Oshakati and Windhoek.
one third of consumers. The other quality criteria considered important for grain concern freshness of the product (70%) and the variety of mahangu (65%)1.
• Consumers prefer to buy grain rather than flour
Consumers prefer to buy grain when they have the choice, as in Oshakati, where they do not go to the supermarkets to buy flour.
Compared to buying flour, buying grain has many advantages.
(1) First, it is easier to evaluate and control the quality. It is easy to see if it is fresh, dehulled, and without moisture, sand or any other foreign matter.
(2) The second reason is the total control of the process. Soaking/fermentation can be done according to one’s own family habits and preferences. The proportion of bran in the flour can be adapted to one’s own taste, as can the coarseness of the flour. And it can be adapted to the final consumers: unfermented flour for young children and the husband2, and fermented flour for the others.
(3) A third reason is the possibility of using the by-products of processing, such as bran, to prepare fermented drinks like oshikundu. It is an important part of the recipe, and this brings down the cost of the drink.
(4) And finally, grain can be stored for longer. This aspect should not be underestimated. The main limitation on Windhoek consumers in bringing more
mahangu back from the production area is the short storage life of the flour, and not the on-farm availability of the mahangu.
3.5.4
The importance of service milling
The difference between the grain supply in Windhoek and Oshakati is directly related to the almost complete absence of service mills in Windhoek. In Oshakati, despite the lack of direct support from the Government, there are many service mills, and many urban consumers use them regularly3. The survey showed that 60% of households which use grain process it at a service mill. And the choice between hand and mechanical work is related to the availability of money and time. Quality is not a determinant in this choice.
Less than 5% of consumers pound the grain themselves in Windhoek. Those who do usually have a traditional milling place in their house. However, the practice requires investment in the mill, and the time for milling. And such investment is very rare, partly because of the insecurity of most northern Windhoek households. Michel Mallet also notes a social dimension: people would be ashamed to be seen pounding millet in Katutura. It is not considered to be an urban activity/way of life.
1 Results for Oshakati. Not enough grain users in Windhoek for statistical analysis. Total exceeds 100%. More
than one answer was possible when asking which quality criteria were considered important. 2
It is common to hear that babies should consume unfermented mahangu because of its more nutritious content. Manual workers also prefer this form of mahangu because of the strength of the food.
3.6 Industrial and semi-industrial products
3.6.1
Origin of the bought flour: a good penetration of "commercial" flour
compared to industrial flour
Consumers were specifically asked about the brands of flour they had purchased over the last month (June 2002). The results are reported below in Table 8. This shows that, altogether, industrial products (Pure Meme Mahangu and Mahangu-Maize mix Meme Mahangu) are more commonly purchased than commercial flour (from ABC mills, Okavu, Ongenga, Kamalanga, Eneas, Ts properties, Ongha Moonlight, M.N. Milling, Okahao Milling, Eluwa). In Windhoek, 54% of consumers bought industrial flour and 25% bought commercial flour during June 2002. In Oshakati, the difference is smaller but the share of the industrial product is still double that of commercial flour (29% of consumers against 15%).
However, and in spite of these differences, it should be noted that the commercial millers have penetrated the market very well, given that they are relatively small in size, and have a specific distribution network (not in the supermarkets). This good penetration can be linked to the specificity of the product (fermented), to the good reputation (fame) of the processors among the consumers, and to personal connections with the consumers/buyers.
Table 8: Ratio of consumers who had purchased a brand in the past month (July 2002)
Windhoek Oshakati
% Yes % No % Yes % No
Meme Mahangu 52 48 27 83
Meme Mahangu(maize mix) 28 72 8 92
Total industrial 54 46 29 71
Okavu mills 16 84 3 97
ABC mills 5 95 6 94
Kamalanga mills 5 95 1 99
Eluwa mills 3 97 6 94
Okahao mills 2 98 1.5 98.5
Ongha Moonlight mills 2 98 0.5 99.5
Ongenga mills 1 99 1 99
Eneas mills 1 99 2 98
M.N mills 0.5 99.5 2 98
Ts Properties mills 0.5 99.5 0.5 99.5
Total commercial 25 75 15 85
N=212 in Windhoek ; N=337 in Oshakati
commercial flour seems to be slightly higher. According to the few data we collected, in Oshakati, commercial flour was between 30 and 50% more expensive than industrial flour in June 2002 (see Table 28).
In Windhoek, the results are not clear and it does not seem that the use of industrial versus commercial flour is related to the LSM.
Figure 7: Market share of industrial and commercial products according to LSM WINDHOEK
Industrial only both commercial only
3.6.2
Brand fame
The fame of the different brands was assessed in both cities. The people were asked if they
had ever tasted the products.
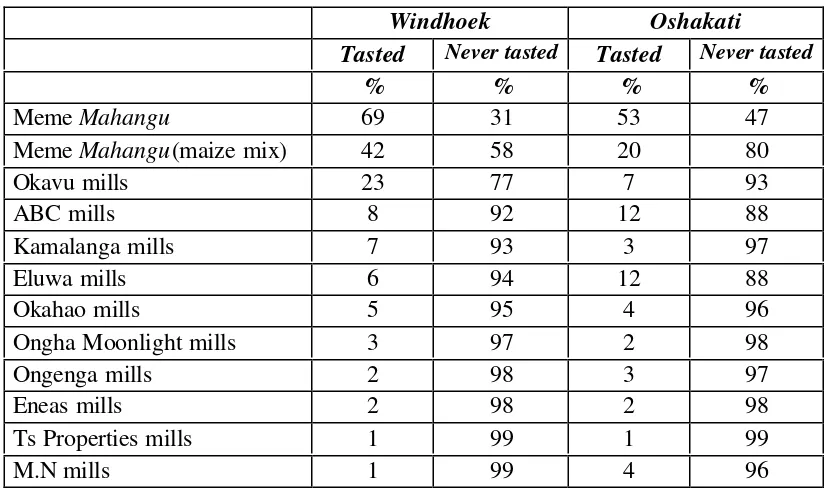
Table 9 : Fame of different brands of mahangu flour available on the market
Windhoek Oshakati
Tasted Never tasted Tasted Never tasted
% % % %
Meme Mahangu 69 31 53 47
Meme Mahangu(maize mix) 42 58 20 80
Okavu mills 23 77 7 93
ABC mills 8 92 12 88
Kamalanga mills 7 93 3 97
Eluwa mills 6 94 12 88
Okahao mills 5 95 4 96
Ongha Moonlight mills 3 97 2 98
Ongenga mills 2 98 3 97
Eneas mills 2 98 2 98
Ts Properties mills 1 99 1 99
M.N mills 1 99 4 96
products. In Oshakati, brands are generally less familiar to consumers. This is related to the very low rate of consumers in Oshakati who purchase flour.
Meme mahangu had been eaten in the past month (July 2002) by half of the consumers in Windhoek, and 27% in Oshakati. Okavu mill also has good market penetration in Windhoek, with 16% of consumers.
3.7 Processing of
mahangu
Processing the grain into flour mainly concerns Oshakati households, since the Windhoek households obtain their supplies exclusively as flour. The grain is usually cleaned, dehulled by pounding, and soaked into water for a period of time which varies from a few hours to two or even three days. This soaking helps to remove the sand and the dust, to tenderise the grain and to make it easier to pound, and finally induces fermentation1. This fermentation is encouraged by the use of warm water and the addition of a starter (previously fermented product). Sometimes the grain is put in a plastic bag in the sun for a few hours. It is then dried before milling. The flour is usually dried again.
3.7.1
Fermentation
• Relative importance of fermentation
The majority of the population seems to prefer the fermented2 flour, since it is consumed by between one half and two thirds of the population (Table 10), and in both cities only 20% of the respondents say that they did not use fermented flour the last time they cooked. In Windhoek, many respondents do not know whether the mahangu flour used has been fermented or not (35%). This is certainly due to the fact that they do not process the grain themselves, but only acquire previously ground flour (received or bought).
Table 10: Percentage of consumers using fermented/unfermented flour.
Windhoek Oshakati
Fermented flour 45 67
Unfermented flour 20 24
Don’t know 35 7
A mixture of fermented and unfermented flour 0 2
• Reasons for fermentation/soaking
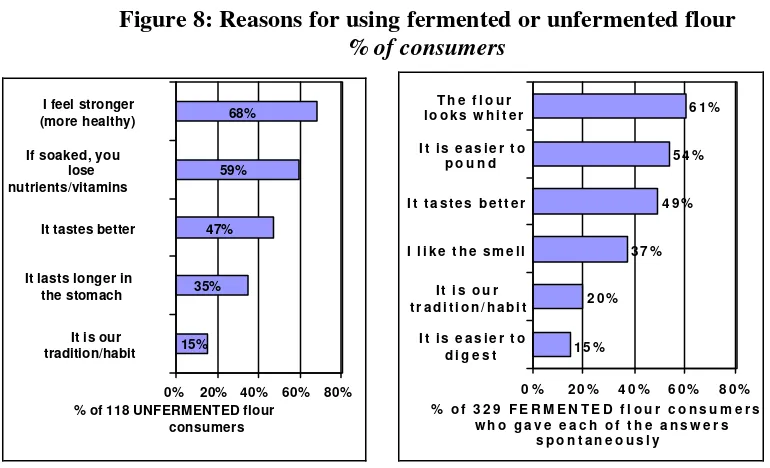
When asked about the reasons for their choice (fermented/unfermented), most people had very clear ideas. Only a small proportion of the answers (less than 10 %, Figure 9 and
1
Fermentation consists of the transformation of long molecules, such as starch or proteins, into smaller ones. It also results in the inhibition of some anti-nutritional components (Reddy and Pierson 1994). Major consequences are an increase in acidity, and better digestibility. It also modifies the colour and taste of the product, as between milk and yoghurt. The process needs a supply of lactic ferments, a good environment in terms of heat and humidity, and pre-digestion by micro organisms.
Figure 10) and of the respondents (15 to 20%, Figure 8) referred to vague reasons such as tradition or habit. Most people show a preference for the quality attributes of the fermented flour: colour (whiter), taste and smell (very specific), and digestibility. A technical reason (easier to pound) is quoted by 54% of the consumers, but represents less than 25% of all the answers. It is surprising that the effect on sand (which goes with the soaking water) is never mentioned. The reasons for using the unfermented flour refer to its specific characteristics: people "feel stronger", the food stays "longer in the stomach", and it helps to "keep vitamins". The energy advantage of unfermented flour is regularly mentioned. According to the quantitative survey, the use of fermented or unfermented flour by households is not linked to the income level or the age of the respondent. However, qualitative surveys show that young individuals prefer fermented flour, because of its softer taste.
Figure 8: Reasons for using fermented or unfermented flour
% of consumers
% of 118 UNFERMENTED flour consumers
Figure 9: Reasons why consumers prefer fermented flour, by city.
As a percentage of answers. More than one answer was possible. Answers were free and not suggested by enumerators.
Figure 10: Reasons why consumers prefer unfermented flour, by city.
As a percentage of answers. More than one answer was possible. Answers were free and not suggested by enumerators.
WINDHOEK OSHAKATI
• Conclusion on the demand for fermentation
Qualitative interviews show that most people do not prefer one flour over another, but tend to use one or the other, depending on the specific final consumer. For instance, un-fermented flour is usually given to manual workers (lasts longer/ gives more energy), pregnant women and babies (contains more vitamins). On the other hand, most adults prefer fermented flour for themselves and for children because of its colour and taste. Actually, families who pound their millet themselves (or using service mills) tend to prepare both kinds of flour, depending on the users.
The nutritional advantages (bioavailability of iron, better digestibility, inhibition of diarrhoea-causing pathogens, etc.) of fermentation are recognised by several other studies (Jonsson et al, 1994, quoted by Mallet and Du Plessis, 2001, p. 22,) and these products are now recommended to people who are HIV-positive.
These two reasons (traditional preference for the taste of fermented flour + new demand from nutritionists and the health sector) are an encouragement for the development of industrial or semi-industrial fermented flour.
3.7.2
Maize as a complement to mahangu
Table 11: % of reasons mentioned for mixing maize and mahangu
when cooking porridge.
Windhoek Oshakati
Technical reasons 18 12
The mix is easier to cook than mahangu
flour alone
18 12
Reasons of economy 37 46
“ In order to save mahangu 34 29
When mixed, you can cook more porridge 3 14 Because maize is less expensive than mahangu 0 3
Organoleptic and nutritional reasons 41 42
It tastes better 23 5
Mahangu alone is too strong 9 7
The porridge looks whiter 7 16
It is easier to digest 2 4
Other 4 0
People who mix mahangu with maize and those who consume mahangu alone all recognise that mahangu is stronger/more nutritious than maize.
Table 12: % of reasons mentioned for NOT mixing maize and mahangu
when cooking porridge.
Windhoek Oshakati
Reasons of economy 0 15
“ Maize is too expensive 0 15
Organoleptic and nutritional reasons 77 67
It tastes better 44 35
Mahangu alone is more nutritious 22 18
The pure mahangu porridge lasts longer in stomach
11 14
Other reasons 23 18
It is the tradition not to mix 20 9
3.8 Perception of the products
3.8.1
Maize versus mahangu?
• Is there competition?
It seems that there is no direct competition between maize and mahangu, when looking at the reasons for consumption of these two products. To simplify the situation, we can say that we have “maize consumers” and “mahangu consumers”. Mahangu consumers eat mahangu
mixed with maize for different reasons, which have been discussed (Table 11). Both groups diversify their diet with new products (rice, vegetables, pasta). When mahangu becomes scarce or expensive, the mahangu consumers tend to increase the proportion of maize flour in their mahangu porridge.
• Maize consumers
When asking non-mahangu consumers if they have ever tried mahangu meal, 66% percent answer "no". The result is almost the same (61%) when the question is specifically put to maize meal consumers.
The different reasons explaining why they have never tried mahangu are detailed in Table 13.
Table 13: Reason why non-consumers have never tried a mahangu product. % of households
It is not our tradition 52
I do not want to try it 44
We do not know how to cook it 15
It looks dirty or not safe 8
Other 10
Free answer. Total is more than 100%, more than one answer is possible
Only 8% of respondents have a negative image of the product, and say that mahangu
products look dirty and unhygienic. The predominance of the answers: "It is not our tradition" and "I do not want to try" is more likely to show a lack of knowledge about the food, and the unambiguous idea that most of non-consumers have of mahangu, and to illustrate the gap between maize consumers and mahangu consumers. And the first step in promoting mahangu
to non-traditional consumers will be to go beyond this assumption.
3.8.2
The pioneer
About 22% of Windhoek’s whole population do not consume mahangu regularly, but have tasted it at least once1 (this rate is about one third for the non-consumer population). They were asked why do they not consume mahangu more regularly (Table 14).
Table 14: Reasons given by people who have tasted mahangu a least once
for why do they not consume it regularly.
% of households
Mahangu is difficult to find 47
We eat it only on specials occasions or when invited 25
We do not really like it 18
Mahangu is too expensive 16
It is too time-consuming/difficult to prepare 14 There are no quality products available 12
Other 9
Free answer. Total higher than 100% because more than one answer was possible
Only one fifth of the respondents who had tasted mahangu said they did not really like it. The other answers show problems of availability of the product, quality, communication and marketing. Social environment is probably the main factor which influences the non-mahangu
consumer to try the product. Oshiwambo friends or relatives, children, and the place you live in Windhoek are factors which contribute to that. LSM does not appear to be a factor influencing interest in the product. However, as shown in the table below, mother tongue does.
Table 15: Ratio of non-consumers who have never tasted a mahangu product,
according to mother language.
Mother tongue Tried Never tried
Oshiwambo 83 17
Caprivian 80 20
Tswana 52 48
Khoi_Khoi 50 50
Damara-Nama 43 57
Otjiherero 27 73
Afrikaans 22 78
German 13 87
1
3.8.3
Opinions about mahangu
In order to assess the image non-consumers have of mahangu, their opinion was asked about few common ideas on mahangu. (Table 16)
Table 16: Some views of non-mahangu consumers
Agree Disagree N/A
Mahangu looks a healthy food 69 17 14
Mahangu is a staple food of our nation, and many things have to be done to improve its consumption
66 21 13
There is not enough communication / publicity for mahangu 62 25 13
Mahangu looks nutritious 61 25 14
Mahangu can compete with other staple foods 46 41 13
Mahangu and sorghum are food for Owambo people only 28 61 11
Mahangu looks dirty/disgusting 26 60 14
The healthy and nutritious image of mahangu are the first answers when asking non-consumers their opinion. They appear to be important aspects to communicate in promoting the products to non-consumers. Most of these perceptions of the product are positive, except for about 25% of respondents who say that the product looks disgusting or is for traditional consumers only.
Projective test
Table 17: Opinions of mahangu consumers when asked why people do not consume
more mahangu in Oshakati and Windhoek (free answers).
% of households
They have access to other products like rice or pasta 51
It is not their tradition 41
Mahangu is too scarce 39
Good quality products are difficult to find 19 They don't have time to prepare it 18 Because it is a food for rural people 18
Mahangu is too expensive 17
They do not like the taste 13
They don't have access to a field (free product) 5
3.8.4
Interest in new products
Opinion was surveyed about about a few new products, to test the receptivity of non-consumers to mahangu (Table 18)
Table 18: Interest of non-mahangu consumers in new mahangu products Interested Not interested N/A
Good quality and nicely packaged traditional mahangu flour
50 38 12
Baby food 46 41 13
Commercial preparation for oshikundu 38 50 12
Improving flour quality seems to be a priority in developing new products. Baby food should not be produced, as long as mahangu has the image of a product which is not clean.
3.8.5
Quality criteria
Because of the form in which they obtain their supplies, people in Windhoek were asked about the quality criteria of importance for flour, whereas in Oshakati, they were asked about the criteria for grain. People seem to be more demanding regarding quality criteria in Oshakati (grain) than in Windhoek (flour) (Table 18 and Table 19). Less than 30% of consumers have special quality requirements for flour, whereas this figure is 70% for the grain. Concerning the flour, the main criterion for the whole population appears to be cleanliness (this is important for 29% of consumers). The age and the variety of the grain are the main concerns for grain buyers.
In Windhoek, there is a clear relationship between living standards and requirements for flour quality (the richer are more demanding than the poor), while in Oshakati there is no relationship between living standards and quality requirements.
Table 19: Percentage of consumers saying these criteria are important in evaluating flour quality, according to LSM (Windhoek)
ALL LSM1 LSM2 LSM3 LSM4 LSM5 LSM6
N obs. 214 64 15 21 25 40 49
Clean 29 5 17 15 41 60 42
Smell 24 3 14 20 27 29 39
Fresh 23 2 11 15 25 47 38
Colour 22 6 14 20 23 45 29
Smooth 22 2 11 15 30 42 37
Fermented 19 5 7 10 25 33 35
Whole 17 8 7 24 23 22 21
Pound 16 2 4 17 25 28 21
Table 20: Percentage of consumers saying these criteria are important in evaluating grain quality, according to LSM (Oshakati)
ALL LSM1 LSM2 LSM3 LSM4 LSM5 LSM6
N obs 345 98 59 46 39 56 47
3.9
Projections of demand for the year 2010 in Windhoek
3.9.1
Effect of population growth
If the 1995-2001 trend of population growth in Windhoek continues (i.e annual growth rate of 6.3%, including migration of 4.8%, 44% of which coming from the North Central provinces, see details p. 8), then the Windhoek population will increase from 250,000 to 430,000 inhabitants. The Oshiwambo-speaking population will almost double; from about 80,000 to 160,000. Since 87% of these are millet consumers (Table 5, and as they represent 85% of the mahangu consumers in the city, the number of mahangu consumers will certainly have doubled in 10 years’ time (from 85,000 to 165,000), and the demand for mahangu will increase substantially, simply because of population growth. If we consider a second scenario, with an annual growth rate of only 4% (because of the possible effects of Aids), then the number of consumers will increase by 53 %, to 130,000 in 2010
Figure 11: Projected population of Windhoek
WINDHOEK POPULATION (extrapolation to 2010)
0
3.9.2
Effect of income growth
consumed per consumer will decrease by between 2 and 14%, depending on the income growth rate (see Table 33, p XI)
3.9.3
Projection of demand
4
Conclusion and recommendations
4.1 Highlights of the study:
4.1.1
High demand from urban dwellers originally from production areas.
Mahangu is still very much consumed very frequently and in large quantities in Windhoek and in Oshakati, where 34% and 94%, respectively, of the urban dwellers in each city are millet consumers. All consumers in Oshakati and more than 80% of consumers in Windhoek eat oshifima more than 3 times per week. During the period of the survey, which corresponded to a good cropping season, the average quantity consumed was almost 8 kg of grain equivalent per consumer and per month in Oshakati and 6 kg per consumer per month in Windhoek. Almost all consumers come from areas where millet is a staple food, and many consumers have a low purchasing power.
4.1.2
A large proportion of urban consumption goes through the
non-traded chain, and most market
mahangu
flour is cheap.
Half of the mahangu flour consumed is non-traded, and the price of the traded flour, during the period of the study, was lower than that of maize flour, rice, or pasta. Mahangu plays an important role in the food security of the urban Namibian in Oshakati and Windhoek.
4.1.3
Image of tradition but negative income elasticity. Trend towards
diversification and reduction of millet consumption.
Traditional consumers remain loyal to millet. For them, eating mahangu is a way of living their identity, and staying linked to their rural roots. Everyone from the production areas likes to keep it in their diet. But, if their income increases, as happens everywhere in the world, people tend to diversify their consumption pattern. This does not mean that they abandon
mahangu, but instead of eating it every day, they eat it once a week or on special occasions. In the case of mahangu in the cities studied, this trend towards diversification is very high, and richer households actually reduce their millet consumption more than medium and poorer households (income elasticity is negative). Pasta, bread, rice, vegetables (beans and potatoes) are the substitutes while maize should be considered as a complement to mahangu.
4.2 How can this paradox of an apparent "positive image"
and a negative income elasticity be explained?
The relative importance of the new products (pasta, bread, vegetables, etc.), can be explained by three main factors.
dual/ambivalent relationship with their rural roots. They like to refer to their rural origins, but also to free themselves from them. Because the population is becoming mixed and opening up to the outside world, cities are an opportunity for new behaviour models and new food models. Pasta, bread, and rice are part of this new model. Being attracted to these new cereals does not mean giving up millet, but does contribute to its reduced consumption.
•
The main dish prepared, porridge, is not part of the modern and urban identity in the way that pasta, rice or bread are. It takes more time and specific knowledge to prepare.•
Millet products are less available than other staple products. This is a constraint on its regular consumption.4.3
Promotion of millet should distinguish two different
market segments
4.3.1
Segment one: grain and flour for regular porridge consumers
The first segment consists of products for porridge preparation. People still like porridge, and because of simple demographic growth (led by migration to the cities), the urban demand will increase substantially. If it follows the population trend, it may double by 2010. However, this is unlikely to happen, even if production is adequate, because consumer preferences (especially amongst the young) will evolve towards more diversification. It is thus difficult to foresee an increase of the market share of this product compared to other cereals (for which demand is likely to increase faster), but the volume of demand for porridge will increase by 30 to 70% in ten years’ time. The objective would be to secure the market and to slow down the trend for diversification by adapting the products supplied to consumer expectations (improving the varieties of mahangu flour available, access to grain and to flour, and flour quality).
Bearing in mind that many consumers have a low purchasing power, some improvements can be made concerning:
- The regular and widescale availability of different products, including grain in Windhoek (with the development of service mills), and to a wider range of flours: fermented, unfermented, mixed with maize flour.
- The quality of the products: according to the survey results, the main criteria are : age (associated with cleanliness), variety and size for the grain ; cleanliness, smell and freshness for the flour.
Regular access to mahangu products was quoted as the main constraint on consumption, since 40% of regular consumers think that the reason why people do not consume more mahangu is because it is "too scarce"1 and 50% of occasional eaters think mahangu is difficult to find 2.
This should be the first priority of any promotion program, but as mahangu becomes more readily available, people will automatically demand better quality. Quality is already the
1 Table 13
2
second constraint, with 20% of respondents complaining about it, and should also be considered as a priority.
Improving availability of the grain and flour on the urban markets has implications in terms of marketing and production strategies. Production for commercial purposes, and the sale of grain should be promoted. The small and medium scale processors should organise themselves individually and collectively to supply different markets (including supermarkets) on a regular basis. This mainly relates to the organisation of production and storage (to avoid the seasonal gap), and to improving negotiating powers with the retail chains.
Improving the quality of the products according to the main criteria mentioned also relates to all the stakeholders. The sale of fresh grain, and speeding up the turnover of the stored grain by the farmers1. Sowing of the required varieties should be encouraged. Then every step of the processing, from harvest to storage and the marketing of the final product, must conform with the quality requirements. Depending on the marketing chain (within families, or through the market and the industry), specific solutions can be found, both at the farmer's level and at the industrial level.
4.3.2
Segment two: new products for new consumers
The second segment consists of new products or revitalised old products, that look new and fancy, and not linked in any way to tradition. The people to be targeted are not the traditional consumers (although they could be too). Commercial promotion of these new products should emphasise modernity and urbanity. Since everybody (consumers and non-consumers) agrees on one particular aspect2, promotion should also focus on the healthy attributes of millet. In addition to a “new look” oshikundu, new biscuits, cakes, baby food, special bread, and beverages could be developed. A new type of breakfast cereals including millet could also be developed. The FAO in Namibia, together with CSIR consultants (from Pretoria), have developed extruded millet that could suitably be included in a breakfast cereal blend. The main objective with this market segment is to add value to the mahangu products and to develop a new image, which should benefit the whole sector.
4.4 Recommendation for policy implementation
As the demand is growing and as the major constraint is supplying young and clean grain, the policy should focus mainly on improving and securing the conditions for an appropriate supply, in terms of both quality and quantity. Different solutions should be considered to improve the connection between the farmers and the markets. The Government must be cautious about distributing the added value between the farmers, processors, and traders, and some special training information schemes should be designed to help farmers to enter the market economy.
Specific agreements/contracts between processors and farmers or farmers' groups can be developed. These contracts should include conditions concerning quality, price and terms of payment that suit both partners’ needs.
1 As grain is part of the farmers’ insurance scheme (food and non-food), appropriate solutions should be found to