ECONOMIC BASE ANALYSIS OF WATER, ENERGY, AND FOOD
RELATED SECTORS: A CASE OF WEST JAVA PROVINCE
ANALISIS BASIS EKONOMI SEKTOR TERKAIT AIR, ENERGI, DAN
PANGAN: STUDI KASUS PROVINSI JAWA BARAT
Aries Purwanto
PhD Researcher in Land & Water Development, IHE-Delft, P.O. Box 3015, 2601 DA, Delft, the Netherlands [email protected]
ABSTRAK
Air, energi, dan pangan adalah sektor yang krusial untuk dibangun karena peran pentingnya bagi kehidupan manusia. Ketersediaan, keterjangkauan, dan kualitas dari ketiga komoditas tersebut harus dapat dipastikan bagi seluruh masyarakat disuatu daerah. Penelitian ini dilaksanakan untuk mempelajari keberadaan sektor-sektor pembangunan khususnya yang terkait air, energi, dan pangan dibandingkan dengan sektor-sektor lainnya di Provinsi Jawa Barat dengan menggunakan salah satu pendekatan ekonomi basis yaitu metode Location Quotient (LQ). Dengan menganalisis Produk Domestik Regional Bruto (PDRB) Provinsi Jawa Barat (2011-2015) berdasarkan harga konstan tahun 2010 menurut lapangan usaha, sektor basis dan non-basis di Jawa Barat dapat diketahui. Hasil penelitian menunjukkan bahwa metode sederhana LQ statis, LQ dinamis, dan grafik competitive cluster cukup efektif untuk menggambarkan kondisi umum sektor pembangunan di Jawa Barat. Hasil analisis juga menyebutkan bahwa umumnya sektor dan sub-sektor air, energi dan pangan berada di kuadran III dan IV, yang mengindikasikan bahwa langkah-langkah serius harus diambil oleh pemerintah daerah khususnya, untuk meningkatkan produksi dari tiga sektor vital tersebut. Upaya terintegrasi diharapkan mampu menjaga ketersediaanya ditahun-tahun mendatang. Kombinasi pendekatan dan hasil studi ini diharapkan dapat membantu pemerintah daerah dan stakeholder di Provinsi Jawa Barat dalam melakukan evaluasi pendahuluan, khususnya dalam upaya meningkatkan ketahanan sektor air, energi, dan pangan di daerah ini.
Kata Kunci: location quotient, sektor basis, sektor non-basis, ketahanan air, energi, dan pangan, provinsi jawa barat, produk domestik regional bruto
ABSTRACT
Water, energy, and food are crucial sectors to be developed due to their importance for human life. The availability, accessibility, and quality of those three commodities have to be ensured for the whole people in a region. This research was conducted to evaluate the existence of water, energy and food-related sectors compare with other sectors in West Java Province by using one of economic base approaches so-called Location Quotient (LQ) method. By analysing gross regional domestic products (GRDP) year 2011-2015 at constant 2010 market prices by industrial origin, basic and non-basic sectors have been determined. The results show that the static and dynamic location quotient (SLQ & DLQ) analysis and competitive cluster chart were effective to figure out general situation and characteristic of basic and non-basic sectors in this region. Additionally, water, energy, and food-related sectors are mostly positioned in quadrant III and IV, indicating that serious actions have to be taken particularly by local government to increase production of those basic commodities. Integrated measures are expected to maintain their availability in the forthcoming years. This composite approach is expected to assist local government and stakeholders in undertaking preliminary evaluation in particular water, energy and food sectors to improve their security.
Keywords: location quotient, basic sector, non-basic sector, water-energy-food security, west java province, gross regional domestic product (GRDP)
INTRODUCTION
In the recent global situation, the existence of water, energy, and food (W-E-F) are crucial and irreplaceable for the human being. Integrated management practices of those three components are needed to ensure its availability, accessibility, and quality. Indonesian government has shown strong
In the regional development planning, the concept of economic base approach is prominent for the government to understand correctly which sectors mainly contribute to the economic growth. Although the theory of economic base is a kind of reality simplification, as well as other theories, it can be applied to analyse and evaluate the processes of economic development and its strategies (Wang & Hofe, 2007). The main assumption of the economic base theory is that all economic activities in an area can be classified into basic and non-basic industries or activities (Wang & Hofe, 2007). The basic sector is defined as the sectors that composed by local businesses and resources, has a dependency upon external factors, and the products are used both for domestic and to be exported to another area (Juleff, 1993). On the other hand, the non-There are four basic techniques in economic base analysis that can be used, especially if the availability of data becomes obstacles in using complex economic analysis, i.e. survey method, assumption method, location quotient, and minimum requirement method (Wang & Hofe, 2007). According to Leigh (1970), the best measure to determine basic and non-basic sector is primary surveys to evaluate the existence of water, energy, and food related sectors compare to other sectors in economic development process in West Java Province. The objective has been
reached by employing LQ techniques and competitive cluster chart analysing gross regional domestic product (GRDP) data year 2011-2015 of West Java Province, and be compared to gross domestic product (GDP) of Indonesia in the same period. This paper begins with introduction section. The second section will give a brief overview of the study area, while Section 3 is concerning with methodology applied in this research. Computational results will be discussed and reported in section 4. Finally, section 5 summarizes findings and draws the conclusion of this research.
STUDY AREA
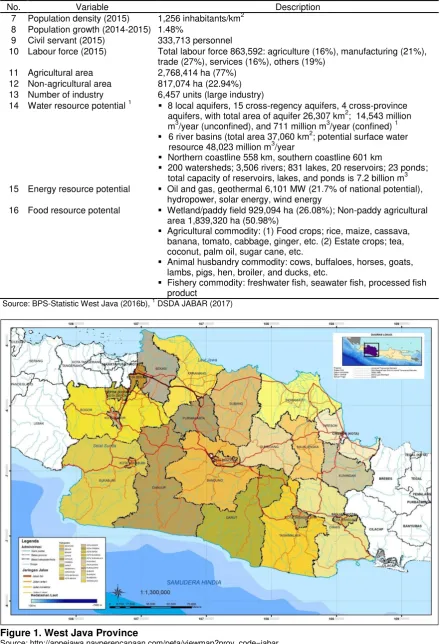
West Java is a province in Indonesia with the largest number of population in 2015 (46.7 million inhabitants). The total area is reaching 35,377.76 km2, and recently it is divided into employment, 18.79 million workers are employed in trading, manufacturing and other sectors with the composition of 27.1%, 21%, and 19.2% respectively. By 2015, the economic structure of this province dominated by processing or manufacturing industry (43%), trading (15%), agriculture (9%), construction (8%), and other sectors (25%) (BPS-Statistic West Java, 2016b). West Java Province contributes 14.33% of national Gross Domestic Product (GDP), 60% of GDP in the manufacturing industry, 34.46% of national Foreign Direct Investment (FDI), and 17.76% as national rice producer (Pemprov Jabar, 2017). Further information about this province is summarized in Table 1.
Table 1. Description of Study Area
No. Variable Description
1 Geographic Location 104o48’-108o48’ E and 5o50’-7o50’ S 2 Elevation and Slope Elevation: 0 to >1500 m asl, slope: 9-40%
3 Climate Annual Rainfall (1500-4000 mm), temperature (17.4-30.7°C), average humidity (74%), Atmospheric Pressure (924 mb), Wind Velocity (4 knot), Duration of Sunshine (67%)
4 Total Area 35,377 km2
5 Area division 18 regencies & 9 municipalities, 626 sub districts, 2,671 urban villages and 3,291 rural villages
No. Variable Description 7 Population density (2015) 1,256 inhabitants/km2
8 Population growth (2014-2015) 1.48%
9 Civil servant (2015) 333,713 personnel
10 Labour force (2015) Total labour force 863,592: agriculture (16%), manufacturing (21%), trade (27%), services (16%), others (19%)
11 Agricultural area 2,768,414 ha (77%) 12 Non-agricultural area 817,074 ha (22.94%) 13 Number of industry 6,457 units (large industry)
14 Water resource potential 1 8 local aquifers, 15 cross-regency aquifers, 4 cross-province aquifers, with total area of aquifer 26,307 km2; 14,543 million m3/year (unconfined), and 711 million m3/year (confined) 1 6 river basins (total area 37,060 km2; potential surface water
resource 48,023 million m3/year
Northern coastline 558 km, southern coastline 601 km
200 watersheds; 3,506 rivers; 831 lakes, 20 reservoirs; 23 ponds; total capacity of reservoirs, lakes, and ponds is 7.2 billion m3 15 Energy resource potential Oil and gas, geothermal 6,101 MW (21.7% of national potential),
hydropower, solar energy, wind energy
16 Food resource potental Wetland/paddy field 929,094 ha (26.08%); Non-paddy agricultural area 1,839,320 ha (50.98%)
Agricultural commodity: (1) Food crops; rice, maize, cassava, banana, tomato, cabbage, ginger, etc. (2) Estate crops; tea, coconut, palm oil, sugar cane, etc.
Animal husbandry commodity: cows, buffaloes, horses, goats, lambs, pigs, hen, broiler, and ducks, etc.
Fishery commodity: freshwater fish, seawater fish, processed fish product
Source: BPS-Statistic West Java (2016b), 1 DSDA JABAR (2017)
Figure 1. West Java Province
METHODS website, and other sources. Main datasets in the calculation are as follow:
GDP at 2010 Constant Market Prices by Industrial origin in billion rupiahs, year 2011–2015 (Statistical Year Book of Indonesia 2016, BPS-Statistics Indonesia)
GRDP at 2010 Constant Market Prices by Industrial origin in billion rupiahs, year 2012-2015 (West Java Province in Figures 2016, BPS-Statistics West Java Province)
GRDP at 2010 Constant Market Prices by Industrial origin in billion rupiahs, year 2011 (West Java Province in Figures 2015, BPS-Statistics West Java Province)
GDP (in national level) and GRDP (in regional level) are essentially arranged based on production and expenditure approach. GDP/GDRP based on production approach by industrial origin denotes the basic measure of value-added emerging from various kind of economic activities and production. GDP/GRDP by industrial origin has changed since 2010 in the category from 9 main sectors to 17 main sectors, comprises 39 sub-sectors, and 5 sub sub-sectors. The percent. It indicates the income growth during the given period. All the data were computed using LQ methods, then visualized in competitive position chart.
Location Quotient (LQ)
One of economic base concepts employed in this study was Location Quotient (LQ) techniques both static and dynamic. LQ is not a new one because it has been widely applied in economic geography and regional economics since the 1940s due to the nothingness of data in interregional trade flow. Miller et al. (1991) defined LQ as ‘basic analytical tools to yield a coefficient or simple expression of how well represented a
particular industry is in a given study region’.
Additionally, as mentioned by (Karsinah et al. 2016), this tool can be applied to compare the role of industrial sectors in a region with the same variable in the higher regional level to understand local potential on basic and non-basic sectors. Recently, this technique has been employed in many various sectors and research such as trade sector (Chiang, 2009), industrial concentration (Billings & Johnson, 2012), road project development (Berawi et al., 2017), economic development (Alhowaish, 2015), marine sector (Morrissey, 2016), agriculture (Hendayana, 2003), mapping crime (Brantingham & Brantingham, 1998), and carbon emission (Trappey & Charles V Trappey, 2013) among others.
Notwithstanding several questions and criticism from some scholars have been raised about the accuracy of LQ method in estimating regional economic impact, this technique has remained a highly popular due to its simplicity (Miller et al., 1991), non-intensive in data, analytical skill, time consumed, budget (Isserman, 1977), and the lack of interregional trade flow and primary data (Richardson, 1985). Furthermore, (Suyatno, 2000) and (Iswandi et al., 2016) used dynamic location quotient (DLQ) in combination with SLQ to further analyse the changes or sectoral reposition of each sector by considering GRDP and the annual growth rate of each sector at selected years. The basic formula of SLQ and DLQ can be seen in equation 1 and 2 as follows:
Where SLQ is static location quotient value, (SLQ<1), it can be categorized as Non-Basic Sector.
Where DLQ is dynamic location quotient value, Gin represents the average growth rate of GRDP Sector i in provincial region n, and
provincial region n. In addition, Gi is the average growth rate of GRDP Sector i in the national level, while G indicates the average growth rate of GRDP in national level, while t
is total year of analysis. If the value of DLQ is greater than or equal to 1 (DLQ≥1), it reflects that the growth of this sector is faster than the same sector in provincial level, and still can be expected to be a basic sector in the future. Contrarily, if the value of DLQ is less than 1 (DLQ<1), it means that the growth is potentially slower, and cannot be expected to act as a basic sector in the future.
Competitive Position Chart
One of the improved ways to depict the value of SLQ and its growth effectively is bubble chart with four quadrants so-called Porter’s
Cluster (Goetz et al. 2007) or Competitive Position Matrix (Zhao et al. 2016). The horizontal axis (X-axis) reflects the value of SLQ for the year of analysis, while the alteration of SLQ overtime (∆SLQ) is captured by vertical axis (Y-axis). Bubble size represents the size of the industry. More obvious pictures of potential clusters can be obtained using this composite method (See Figure 1Figure 2).
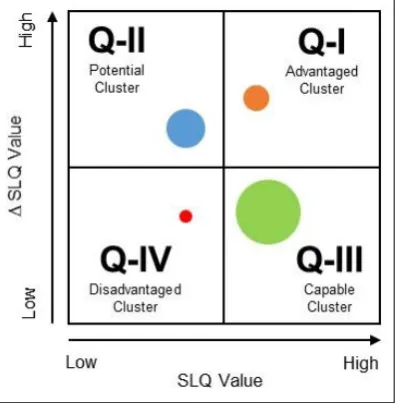
Figure 2. Competitive Position Chart
Source: Modified from (Zhao et al. 2016)
Quadrant I (Q-I) indicates industries with high agglomeration level and high agglomeration growth so-called advantaged or stars group. This top right clusters are strong, advancing, and can be expected to become more dominant in the future. Subsequently, quadrant II (Q-II) represents the potential or emerging group, where the sectors in this position are less concentrated but high in agglomeration growth. This cluster contains sectors that will be shifting ultimately to the first quadrant by certain continuous growth in the future. The third quadrant (Q-III) comprises sectors that highly concentrated in the region yet declining in the growth so-called capable or mature group. There are possibilities to move in less concentrated clusters in the forthcoming years. Quadrant IV (Q-IV) denotes cluster with a low concentration and lack of competitiveness named disadvantaged or transforming group. Additional efforts from all stakeholders are required to anticipate future needs and condition in this cluster.
RESULTS & DISCUSSION
All Development Sectors
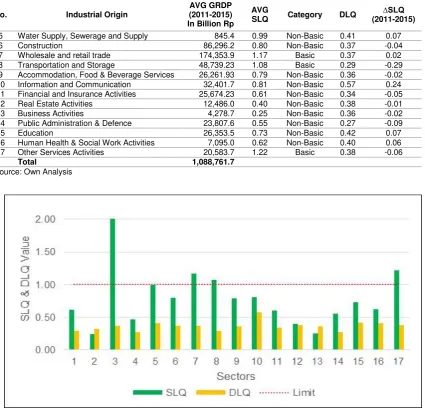
With the total average of GRDP in 2011-2015 amounted 1,088,761 billion rupiahs, West Java is the second largest province after DKI Jakarta Province regarding total GRDP in Indonesia. The manufacturing sector has the highest contribution to GRDP of this province with 44%, followed by wholesale and trade sector, agriculture, forestry and fishery sector, and transportation and storage with the proportion of 16%, 8%, and 4% respectively. However, the result of SLQ and DLQ analysis in West Java Province during year 2011-2015 shows that only four sectors i.e. manufacturing, wholesale and retail trade, transportation and storage, and other service activities (excluded agriculture, forestry, and fishery) can be classified as basic sector out of 17, while the rest are categorized as non-basic (see Table 2).
Table 2. SLQ, DLQ and ∆SLQ Results of All Sectors
No. Industrial Origin
AVG GRDP (2011-2015) In Billion Rp
AVG
SLQ Category DLQ
∆SLQ (2011-2015)
1 Agriculture, Forestry and Fishery 91,029.7 0.61 Non-Basic 0.29 -0.11 2 Mining and Quarrying 27,585.00 0.24 Non-Basic 0.32 0.04
3 Manufacturing 475,202.8 2.01 Basic 0.37 0.03
No. Industrial Origin
AVG GRDP (2011-2015) In Billion Rp
AVG
SLQ Category DLQ (2011-2015) ∆SLQ
5 Water Supply, Sewerage and Supply 845.4 0.99 Non-Basic 0.41 0.07 6 Construction 86,296.2 0.80 Non-Basic 0.37 -0.04 7 Wholesale and retail trade 174,353.9 1.17 Basic 0.37 0.02 8 Transportation and Storage 48,739.23 1.08 Basic 0.29 -0.29 9 Accommodation, Food & Beverage Services 26,261.93 0.79 Non-Basic 0.36 -0.02 10 Information and Communication 32,401.7 0.81 Non-Basic 0.57 0.24 11 Financial and Insurance Activities 25,674.23 0.61 Non-Basic 0.34 -0.05 12 Real Estate Activities 12,486.0 0.40 Non-Basic 0.38 -0.01 13 Business Activities 4,278.7 0.25 Non-Basic 0.36 -0.02 14 Public Administration & Defence 23,807.6 0.55 Non-Basic 0.27 -0.09
15 Education 26,353.5 0.73 Non-Basic 0.42 0.07
16 Human Health & Social Work Activities 7,095.0 0.62 Non-Basic 0.40 0.06 17 Other Services Activities 20,583.7 1.22 Basic 0.38 -0.06
Total 1,088,761.7
Source: Own Analysis
Figure 3. SLQ and DLQ Value of All Sectors in West Java Province
Source: Own Analysis
Additionally, the results obtained from the analysis of SLQ and DLQ of all sectors can be compared in Error! Reference source not found. below. The value of DLQ in this study reveals the characteristic of sector’s growth in West Java Province compares with similar sectors in national level. From the DLQ data in the graph, it is apparent that the DLQ values of all sectors in this province during the year of analysis were less than 1, meaning that they were growing slower than in national level. Furthermore, it can be interpreted that they are not expected to be basic sector or unable to maintain their position as basic sector in the future, without any significant interventions.
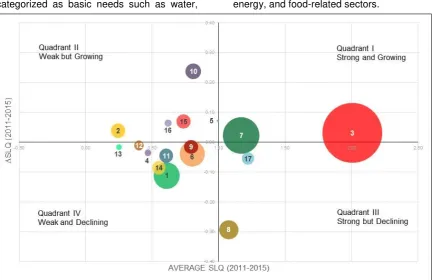
As can be seen in Figure 4 below, the correlation between SLQ values and the
change of SLQ (∆SLQ) of all sectors by the
categorized as basic needs such as water, energy, and food-related sectors.
Figure 4. Industrial Cluster Based on SLQ and ∆SLQ Values Source: Own Analysis
The results in this section indicate the general analysis for 17 main sectors, while the next section will be moving on to discuss more specific analysis on water, energy, and food-related sectors and sub-sectors as the major aim of this study.
Water, Energy, and Food (W-E-F) Related Sectors and Sub-Sectors
Food-related sector in this study is limited to agriculture, forestry, and fishery categories which is divided into three sub-sectors; agriculture, livestock, hunting, & agriculture services (with sub sub-sectors i.e. food crops, horticultural crops, plantation crops, livestock, agriculture services & hunting),
forestry & logging, and fishery. Furthermore, energy-related sector is defined as electricity and gas sector comprises two sub-sectors i.e. electricity, and manufacture of gas and production of ice. Additionally, water-related sector is limited only to water supply and sewerage activities.
According to Statistics Agency of Indonesia, the category of agriculture, forestry, and fishery comprises any exploitation derived from nature and living things whose results can be used to fulfil own needs or to sell to other parties. The coverage of water, energy, and food-related sectors in GDP/GRDP can be seen in
Table 3.
Table 3. Coverage of W-E-F Related Sectors in GDP/GRDP
No. Sub Sectors Coverage in GDP/GRDP
(1) Food Crops Food commodities e.g. rice, secondary crops (corn, soybean, peanut, cassava, sweet potatoes etc.), and other cereal plants (sorghum, wheat, etc.)
(2) Horticultural Crops Seasonal and annual crops e.g. vegetables (potato, cabbage, chili, shallot, tomato, etc.), fruits (mango, banana, orange, watermelon, etc.), medicinal plants (ginger, galangal, turmeric, etc.), and ornamental plants (orchid, chrysanthemum, rose. etc.) (3) Plantation Crops Seasonal and annual plantation crops cultivated by smallholdings or companies (public
and private) such as rubber, coconut, oil palm, tea, coffee, cacao, clove, etc.)
No. Sub Sectors Coverage in GDP/GRDP
such as cow, buffalo, horse, goat, sheep, pig, chicken, duck, egg, milk, etc. (5) Agriculture Services &
Hunting
Including hunting and cultivating of wild animals to support other agricultural activities.
(6) Fishery Comprises all products from capture fisheries (marine and inland open water), and aquaculture (marine culture, brackish water pond, freshwater pond, cage, floating net, and fish breeding in paddy fields) e.g. any types of fish, crustaceans, mollusc, seaweed, etc.
(7) Electricity Encompasses all process of electricity generation, transmission, and distribution held by public or private companies. Calculated by applying production approach (multiplying total electricity produced with base constant price per year)
(8) Manufacture of Gas & Prod. of Ice
Provision of natural gas, artificial gas, fuel, etc. to the consumers through various process, transportation, and distribution method (pipeline or cylinders)
(9) Water Supply and Sewerage
Including drinking water and raw water supply activities, waste water treatment, solid waste management both from domestic and industrial activities
Source: Adapted from (BPS-Statistic West Java 2016a)
Sectors and Sub-Sectors Analysis
Comparing with general results in previous section, it is clear that in the more details water, energy, and food-related sub-sectors analysis, there were slight differences findings, where three sub-sectors were still categorized as basic sectors in this region, i.e. food crops, horticultural crops, and manufacturing of gas with SLQ values of 1.10, 1.04, and 1.39 successively (see Table
4). With more than 70% rice and non-rice agricultural area, this region still becomes the main producer of food and horticulture commodities not only to be consumed locally but also potentially to be exported to another region. Although livestock and fishery are still classified as non-basic sub-sectors, its supporting climate condition and the availability of the land in this province can be utilized to increase food production from animal husbandry and fisheries activities.
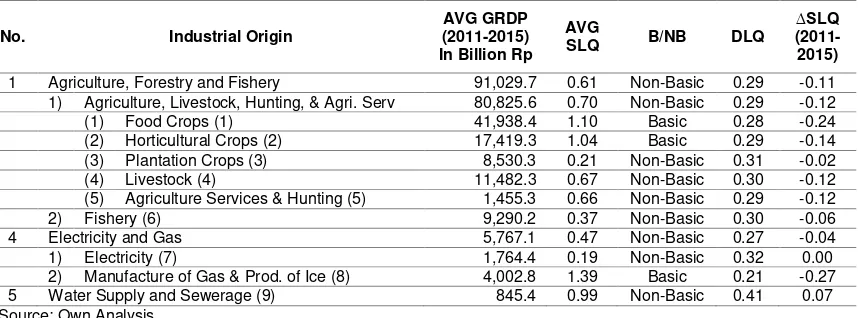
Table 4. SLQ, DLQ and ∆SLQ Results of W-E-F Related Sectors
No. Industrial Origin
AVG GRDP (2011-2015) In Billion Rp
AVG
SLQ B/NB DLQ
∆SLQ (2011-2015)
1 Agriculture, Forestry and Fishery 91,029.7 0.61 Non-Basic 0.29 -0.11 1) Agriculture, Livestock, Hunting, & Agri. Serv 80,825.6 0.70 Non-Basic 0.29 -0.12 (1) Food Crops (1) 41,938.4 1.10 Basic 0.28 -0.24 (2) Horticultural Crops (2) 17,419.3 1.04 Basic 0.29 -0.14 (3) Plantation Crops (3) 8,530.3 0.21 Non-Basic 0.31 -0.02 (4) Livestock (4) 11,482.3 0.67 Non-Basic 0.30 -0.12 (5) Agriculture Services & Hunting (5) 1,455.3 0.66 Non-Basic 0.29 -0.12 2) Fishery (6) 9,290.2 0.37 Non-Basic 0.30 -0.06 4 Electricity and Gas 5,767.1 0.47 Non-Basic 0.27 -0.04 1) Electricity (7) 1,764.4 0.19 Non-Basic 0.32 0.00 2) Manufacture of Gas & Prod. of Ice (8) 4,002.8 1.39 Basic 0.21 -0.27 5 Water Supply and Sewerage (9) 845.4 0.99 Non-Basic 0.41 0.07 Source: Own Analysis
As well as the main sectors, W-E-F related sub-sectors also have the DLQ values less than one (ranging from 0.27 to 0.41), meaning that the growth level of those sectors was slower than similar sectors in Indonesia during 2011-2015. Interestingly, the electricity sector was ranked as the lowest SLQ value with only 0.19. The result was unexpected because it does not exactly fit with potential electricity production in this province, in particular from hydropower and geothermal. According to Energy and Mineral Resource Agency of West Java Province as
Figure 5.SLQ and DLQ Values of W-E-F Related Sectors in West Java Province Source: Own Analysis
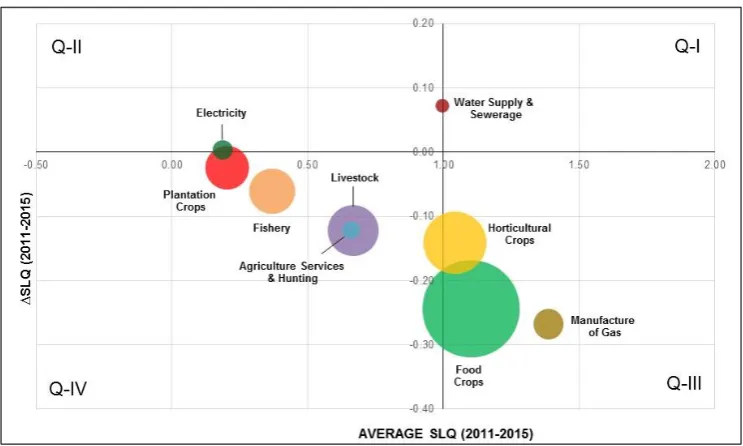
Figure 6. W-E-F Related Clusters Based on SLQ and ∆SLQ Values Source: Own Analysis
From the graph in Figure 6, we can see that the majority of water, energy, and food-related sub-sectors emerged in quadrant III and IV, whereas only water supply and sewerage, and electricity sub-sectors which were positioned in quadrant II.
Food and horticulture crop sub-sectors were the highest contributors to GRDP year 2011-2015 in this group with 41,938 billion rupiahs (43%) and 17,419 billion rupiahs (18%).
Kurniawan (2015) findings which showed the decreasing of paddy field in this province approximately 82,477 Ha by 2025 without extension of new paddy fields.
Animal husbandry and fishery products are the next largest contributor to GRDP of West Java with 11,482 billion rupiahs (12%), and 9,290 billion rupiahs (10%). Unfortunately, these sectors were in the disadvantaged group (quadrant IV). They can be interpreted as industries with a low concentration and lack of competitiveness. Possible actions to be undertaken by the authority to this group are managing the decline, preparing option for transformation, or implementing extraordinary efforts and policies to support and lift back to become a leading sector in the forthcoming years.
Another attractive result in this analysis was the position of water supply and sewerage and electricity sub-sector which were in quadrant II. Although the sectors in this group were less concentrated in the region, they show positive growth that may bring them into the higher position in quadrant I rapidly with certain continual growth rate. The development of new water resources (reservoirs, lakes, and ponds) and power plants (PLTP, PLTA, and PLTU) as already stated in RPJPD 2005-2025 of West Java Province, are expected to increase production, meeting domestic demand, or even to be exported to other regions.
W-E-F Security Challenges and Actions to be Taken
The development of industrial estate in West Java Province by increasing manufacturing sectors investment has positive implication to escalating household income and reducing poverty rate (Winardi et al., 2017). On the other hand, manufacturing sector development will also potentially cause direct and indirect effects to the agricultural sector. This sector is not only boosting other economic activities e.g. trade, services, transportation, and housing development, but also stimulating social-based changes such as population growth, urbanization, dietary change, culture, and increased demand of
(2017) recommended building local-based resource industrial estates such as rural industrial estate, local industrial park, and agricultural industrial park in order to foster local production.
West Java Province is one of national food granaries with 22% contribution of national rice production. However, approximately 20,502 hectares or 2.2% of wetland area for paddy has been dwindling during the period of 2008 to 2013 (Nuryartono et al., 2017). Meanwhile, the land is of the important factors in producing foods. Another significant challenge to be faced by this province is population growth and urbanization. The higher the population the harder the effort to be taken by the government in meeting the needs of people to housing, water, energy, food etc. Kurniawan (2015) identified several water, energy, and food-related challenges in West Java Province such as, low utilization of surface water (41% from total potential), piped water supply (35,32% of total population), depletion of groundwater resources overtime, electrification ratio 70.72% in 2011 (lower than national average), and agricultural land conversion among others.
1. Water resource infrastructures and environment protection; fulfilling raw water from surface, water resource conservation, sustainable utilization, potential damage control, and community empowerment;
2. New and renewable energy; meeting energy and electricity demand from potential new and renewable energy, and rising the use technology;
3. Agriculture and marine management; increasing production, availability of resources, availability of processing facilities and infrastructures, application of technology.
By relying on natural, human, and financial resources which are owned by West Java Province, this region is potentially capable in building self-reliance in producing water, energy, and food either for local needs or to be exported to other regions, even to foreign countries. The ability to develop any sectors to be basic sector (export-oriented) will increase domestic income, bring investment into regional economy, enhance domestic good and service production, and boost local economic growth (Wang & Hofe, 2007).
Possible actions to be implemented in collaboration with local regions (regencies/cities) and national government to enhance water, energy, and food production are as follow:
General intervention; (1) creating
continuous water, energy, and food balance of each regencies/cities comprises supply, demand, existing, potential resources, etc. to be used as evaluation and planning tool in development process, (2) enforcement of water, energy, and food-related regulations, and (3) linking water, energy, and food sectors with other sectors e.g. manufacturing, trade and services, transportation, infrastructures, and vice versa;
Water-related interventions; (1)
constructing new reservoirs, artificial lakes/ponds, infiltration wells, and promoting rainwater harvesting, and (2) water conservation in upstream and downstream area;
Energy-related interventions; (1) urban and rural solar energy application, (2) optimizing other potential new and renewable energy development and utilization
Food-related interventions; enforcing the planned sustainable agricultural cropland (Lahan Pertanian Pangan Berkelanjutan/ LP2B), (2) optimizing food diversification and food production (crops, meat, fish), conclude that the existing condition of water, energy, and food-related sectors/sub-sectors are mostly in disadvantaged condition compare to others sectors, particularly manufacturing sector. More specifically, water, energy, and food sub-sectors lie on the disadvantaged cluster, except water supply and sewerage. Food crops, horticultural crops, and gas manufacturing positioned in a group that strong but declining over time. This single study is of course inadequate and limited, but it is possible to be used as preliminary analysis for planners and decision makers in doing the planning and executing programmes related to water, energy, and food development. It is recommended that further research can be undertaken in the combination of more than one approach in economic base analysis.
Water, energy, and food sectors are immensely complex. The interaction among water, energy, and food systems internally and interconnection with the environmental condition, social, governance, and even political situation make these challenges should be solved comprehensively. Regional economic growth in water, energy, and food sectors should be encouraged strongly by empowering local potential, promoting export-oriented activities, and reducing import.
ACKNOWLEDGEMENT
The author gratefully acknowledges LPDP (Indonesia Endowment Fund for Education) for its financial support and Program 300 Doktor Jawa Barat for all technical supports during preparation programmes. I also would like to thank my colleagues and anonymous reviewers for their meaningful feedback and suggestions which have improved the quality of this article.
REFERENCES
Alhowaish, A.K., 2015. Location Quotient Technique and Economy Analysis of Security without Eroding Its Natural Capital?, Indonesia. Available at: www.globalcanopy.org.
Berawi, M.A. et al., 2017. Producing Alternative Concept for the Trans-sumatera Toll Road Project Development using Location Quotient Method. Procedia Engineering, 171, pp.265–273. Framework for Landscape Investment
and Risk Management, Manitoba:
International Institute for Sustainable Development (IISD).
BPS-West Java, 2016b. West Java Province in Figures 2016, Bandung: BPS West purposes: location quotients, counts and rates. Crime mapping and crime prevention, (8), pp.263–288.
Brodsky, H. & Sarfaty, D.E., 1977. Measuring the Urban Economic Base in a
DSDA JABAR, 2017. Water Resources Book of West Java Province (in Bahasa Indonesia), Bandung.
El Gafy, I., Grigg, N. & Reagan, W., 2016. Dynamic Behaviour of the Water-Food-Energy Nexus: Focus on Crop Production and Consumption. Irrigation and Drainage.
Goetz, S., Deller, S. & Harris, T., 2007. Targeting Regional Economic
Development : An Outline of a National Extension Educational Program. In The
2007 CDS Annual Meetings.
Pennsylvania: The Northeast Regional Center for Rural Development.
Hendayana, R., 2003. Aplikasi metode location quotient (LQ) dalam penentuan komoditas unggulan nasional.
Informatika Pertanian, 12(2003), pp.1–
21. Available at:
http://www.litbang.pertanian.go.id/warta -ip/pdf-file/rahmadi-12.pdf.
Isserman, A.M., 1977. The Location Quotient Approach to Estimating Regional Economic Impacts. Journal of the American Planning Association, 43(1), pp.33–41. Available at: http://dx.doi.org/10.1080/019443677089 77758.
Iswandi, R.M., Yunus, L. & Sudarmo, H., 2016. Study of Local-Based Excellent Potency in Bombana District. IJABER, 14(14), pp.10299–10309.
Juleff, L., 1993. The Implication of Export Base Theory for The Study of Advanced Producer Services(1): Location Quotient Analysis, Edinburgh: Department of Economics, Napier University.
Growth at Tangkallangka Strategic Areas. , 6(Table 1), pp.105–109.
Kenway, S.J. et al., 2011. The connection between water and energy in cities: A review. Water Science and Technology, 63(9).
Kurniawan, T.F., 2015. Natural Resources Carrying Capacity to Support Economic Growth and Population Dynamics in West Java (Master Thesis in Bahasa Indonesia). Bogor Agriculture Institute (IPB).
Leigh, R., 1970. The Use of Location Quotients in Urban Economic Base Studies. Land Economics, 46(2), pp.202–205.
Miller, M.M., Gibson, L.J. & Wright, N.G., 1991. Location Quotient: A Basic Tool for Economic Development Analysis.
Economic Development Review, (50),
p.65. Available at:
http://search.proquest.com/openview/d6 011b83d027b7ad1dba29bb96b74a53/1. pdf?pq-origsite=gscholar&cbl=38209.
Morrissey, K., 2016. A location quotient approach to producing regional production multipliers for the Irish economy. Papers in Regional Science, 95(3), pp.491–506. Available at: http://dx.doi.org/10.1016/j.ocecoaman.2 014.02.006.
Nuryartono, N. et al., 2017. Land conversion and economic development in West Java Province: Trade off or Synergy? In
IOP Conference: Earth and
Environmental Science. IOP Publishing.
Available at:
http://iopscience.iop.org/1755-1315/54/1/012017.
Pemprov Jabar, 2017. West Java Province’s
Contribution to National. Available at: http://www.jabarprov.go.id/infografis/ [Accessed April 3, 2017].
Pemprov Jabar, 2010. Regional Long Term Planning of West Java Province Year 2005-2025, Indonesia.
Richardson, H.W., 1985. Input-Output and Economic Base Multipliers: Looking Backward and Forward. Journal of Regional Science, 25(4), pp.607–661.
Suyatno, 2000. Analisa Economic Base Terhadap Pertumbuhan Ekonomi Daerah Tingkat II Wonogiri: Menghadapi Implementasi UU No. 22/1999 dan UU No. 5/1999.
Trappey, A.J.C. & Charles V Trappey, P.H.Y.L., 2013. Location Quotient EIO-LCA Method for Carbon Emission Analysis. , pp.1081–1092. Available at: http://link.springer.com/10.1007/978-1-4471-4426-7.
Wang, X. & Hofe, R., 2007. Research Methods in Urban and Regional Planning, Tsinghua University Press.
Winardi et al., 2017. Impacts of Industrial Estate Development Policy on Household Poverty in West Java Province. International Journal of Sciences: Basic and Applied Research (IJSBAR), 4531, pp.308–317.
Zhao, Z. et al., 2016. Agglomeration and Competitive Position of Contractors in the International Construction Sector.
ANNEXES
A. Gross Domestic Product (GDP) of Indonesia at Constant 2010 Market Prices by Industrial Origin Year 2011-2015 (in Billion Rupiahs)
No. Industrial Origin GRDP
2011
GRDP 2012
GRDP 2013
GRDP 2014*
GRDP 2015**
1 Agriculture, Forestry and Fishery 1,058,245.3 1,152,262.1 1,275,048.4 1,409,655.7 1,560,399.3 1) Agriculture, Livestock, Hunting, & Agriculture Services 832,513.6 902,125.9 994,778.4 1,089,549.7 1,186,520.6 (1) Food Crops 270,977.4 305,670.5 332,111.9 343,252.3 393,371.7 (2) Horticultural Crops 125,286.1 125,107.9 137,368.8 160,568.6 175,164.5 (3) Plantation Crops 303,402.9 323,361.6 358,172.4 398,260.7 411,863.4 (4) Livestock 117,256.6 130,614.2 147,981.9 167,008.0 183,444.1 (5) Agriculture Services & Hunting 15,590.6 17,371.7 19,143.4 20,460.1 22,676.9 2) Forestry & Logging 62,247.7 65,882.2 69,599.2 74,618.0 81,743.1 3) Fishery 163,484.0 184,254.0 210,670.8 245,488.0 292,135.6 2 Mining and Quarrying 924,813.4 1,000,307.6 924,813.4 1,000,307.6 1,050,745.8 1) Crude Petroleum, Natural Gas, & Geothermal 444,067.8 492,894.2 520,088.1 508,911.1 382,680.9 2) Coal & Lignite Mining 253,025.5 270,519.1 282,193.1 257,236.2 198,881.8 3) Iron Ore Mining 104,283.9 100,844.8 98,468.4 93,897.9 80,286.3 4) Other Mining & Quarrying 123,436.2 136,049.5 149,996.2 182,855.7 217,550.6 3 Manufacturing 1,704,250.5 1,848,150.9 1,704,250.5 1,848,150.9 2,007,426.8 1) Coal & Refined Petroleum Products 284,098.7 298,402.9 314,215.5 329,058.0 307,703.8 2) Food Products & Beverages 410,387.4 457,773.4 491,142.4 562,016.6 647,002.2 3) Tobacco Products 71,735.4 79,340.0 82,684.3 95,668.1 108,859.6 4) Textiles & Wearing Apparel 108,192.1 116,557.8 129,912.0 139,031.6 139,393.9 5) Leather & Related Products, & Footwear 22,045.0 21,686.7 24,810.0 28,600.2 31,444.8 6) Wood & Products of Wood & Cork 59,501.0 60,628.6 66,958.0 76,071.9 77,821.2 7) Paper & Paper Products 75,308.0 73,664.8 74,319.0 84,372.5 87,800.6 8) Chemicals, Pharmaceuticals, & Botanical Products 124,716.9 143,460.2 157,042.1 180,037.2 209,288.1 9) Rubber Products & Plastics Products 72,006.0 76,425.0 76,466.3 80,262.9 85,961.9 10) Other Non-Metallic Mineral Products 55,606.4 63,028.2 69,400.6 76,852.0 83,491.6 11) Basic Metals 62,846.1 64,557.3 74,495.1 82,118.8 90,389.4 12) Fabricated Metal Products 142,059.4 162,969.7 186,194.9 198,080.6 226,661.9 13) Machinery & Equipment 23,376.4 24,832.1 25,504.2 33,078.8 37,255.3 14) Transport Equipment 154,863.9 166,390.7 192,768.0 207,401.4 220,360.3 15) Furniture 21,984.5 22,486.5 24,930.6 28,117.7 31,280.9 16) Other Manufacturing; 15,523.3 15,947.0 16,583.8 18,673.1 20,693.4 4 Electricity and Gas 91,721.9 95,637.8 91,721.9 95,637.8 98,686.8 1) Electricity 72,815.80 73,349.8 74,358.3 83,841.9 102,082.9 2) Manufacture of Gas & Production of Ice 18,906.10 22,288.0 24,328.5 30,776.0 29,181.3 5 Water Supply and Sewerage 6,208.8 6,603.8 6,208.8 6,603.8 7,209.0 6 Construction 712,184.4 805,208.1 712,184.4 805,208.1 905,990.5 7 Wholesale and retail trade 1,066,092.1 1,138,484.4 1,066,092.1 1,138,484.4 1,261,145.6 1) Wholesale, Retail of Motor Vehicle/Motorcycles 208,944.30 228,666.5 258,942.3 292,839.2 312,068.9 2) Wholesale, Retail Except of Motor Vehicles & Motorcycles 857,147.80 909,817.9 1,002,203.3 1,127,215.1 1,221,998.4 8 Transportation and Storage 276,122.4 313,156.2 276,122.4 313,156.2 375,305.9 1) Railways Transport 2,408.30 2,782.9 3,142.5 4,227.9 6,261.8 2) Land Transport 148,061.60 159,225.7 190,200.7 225,881.6 283,222.3 3) Sea Transport 24,082.70 26,614.7 30,061.9 36,074.9 39,306.8 4) River, Lake, & Ferry Transport 9,202.30 9,780.0 11,164.6 13,137.3 14,266.8 5) Air Transport 47,029.10 62,201.1 77,721.8 108,791.9 142,536.4 6) Warehousing & Support Services for Transportation; 45,338.40 52,551.8 63,014.4 78,855.3 93,369.8 9 Accommodation, Food and Beverage Services 224,215.3 252,612.3 224,215.3 252,612.3 289,498.3 1) Accommodation 41,102.40 51,052.4 63,489.0 74,255.1 81,237.7 2) Food & Beverage Service Activities 183,112.90 201,559.9 226,009.3 246,807.0 260,552.5 10 Information and Communication 281,777.6 311,362.4 281,777.6 311,362.4 341,009.4 11 Financial and Insurance Activities 270,586.3 320,534.3 270,586.3 320,534.3 370,131.9 1) Financial Intermediary Services 167,456.30 204,479.4 237,169.6 256,028.9 291,510.3 2) Insurance & Pension Fund 58,759.30 65,882.2 76,004.5 87,336.5 99,041.1 3) Other Financial Services 37,760.80 42,687.6 48,278.5 55,244.7 63,180.0 4) Financial Supporting Service 6,609.90 7,485.1 8,679.3 9,828.7 11,003.2 12 Real Estate Activities 218,796.6 237,913.9 218,796.6 237,913.9 264,275.0 13 Business Activities 113,975.3 127,724.2 113,975.3 127,724.2 144,604.1 14 Public Administration & Defence 304,755.7 340,567.6 304,755.7 340,567.6 372,195.0 15 Education 232,726.8 270,372.3 232,726.8 270,372.3 307,862.3 16 Human Health & Social Work Activities 76,404.9 86,235.4 76,404.9 86,235.4 96,881.3 17 Other Services Activities 113,022.0 122,566.2 113,022.0 122,566.2 140,315.5
Total 7,675,899.3 8,429,699.5 7,675,899.3 8,429,699.5 9,308,331.6
Source: 2016 (BPS-RI 2016), Central Statistical Agency of Indonesia Notes:
B. Gross Regional Domestic Product (GRDP) of West Java Province at Constant 2010 Market Prices by Industrial Origin Year 2011-2015 (in Billion Rupiahs) and SLQ Calculation
No. Industrial Origin GRDP
2011
SLQ 2011
GRDP 2012
SLQ 2012
GRDP 2013
SLQ 2013
GRDP 2014*
SLQ 2014
GRDP 2015**
SLQ 2015
AVG SLQ
CATEGO RY
∆ SLQ 1 Agriculture, Forestry and Fishery 88,386.5 0.66 88,409.5 0.63 92,390.1 0.62 92,926.2 0.59 93,036.1 0.55 0.61 Non-Basic -0.11
No. Industrial Origin GRDP 2011
SLQ 2011
GRDP 2012
SLQ 2012
GRDP 2013
SLQ 2013
GRDP 2014*
SLQ 2014
GRDP 2015**
SLQ 2015
AVG SLQ
CATEGO RY SLQ ∆ 6) Warehousing & Support Services for Transportation; 1,837.63 0.32 2,017.4 0.31 2,138.4 0.29 2,277.9 0.26 2,481.2 0.25 0.29 Non-Basic -0.08 9 Accommodation, Food and Beverage Services 23,196.04 0.82 24,806.72 0.80 25,985.30 0.76 27,545.03 0.77 29,776.55 0.81 0.79 Non-Basic -0.02 1) Accommodation 3,651.33 0.71 4,015.2 0.64 4,488.3 0.60 4,716.4 0.57 4,911.7 0.56 0.62 Non-Basic -0.15 2) Food & Beverage Service Activities 19,544.71 0.85 20,791.5 0.85 21,497.0 0.81 22,828.7 0.83 24,864.8 0.88 0.84 Non-Basic 0.04 10 Information and Communication 25,378.26 0.72 28,094.0 0.74 30,651.8 0.77 36,005.4 0.87 41,878.8 0.95 0.81 Non-Basic 0.24 11 Financial and Insurance Activities 21,567.18 0.63 23,437.32 0.60 26,347.77 0.61 27,497.25 0.60 29,521.63 0.59 0.61 Non-Basic -0.05 1) Financial Intermediary Services 16,756.71 0.80 18,413.3 0.74 21,091.1 0.76 21,722.0 0.76 23,317.4 0.74 0.76 Non-Basic -0.05 2) Insurance & Pension Fund 1,796.15 0.24 1,860.1 0.23 1,942.7 0.22 2,188.0 0.22 2,365.8 0.22 0.23 Non-Basic -0.02 3) Other Financial Services 2,637.96 0.56 2,775.3 0.53 2,911.7 0.51 3,150.0 0.51 3,365.8 0.49 0.52 Non-Basic -0.06 4) Financial Supporting Service 376.36 0.45 388.6 0.43 402.2 0.39 437.2 0.40 472.6 0.40 0.41 Non-Basic -0.05 12 Real Estate Activities 10,992.68 0.40 11,916.8 0.41 12,561.5 0.40 13,121.3 0.40 13,837.7 0.39 0.40 Non-Basic -0.01 13 Business Activities 3,676.30 0.26 3,957.5 0.25 4,265.9 0.25 4,561.1 0.25 4,932.6 0.24 0.25 Non-Basic -0.02 14 Public Administration & Defence 22,940.00 0.60 23,901.3 0.58 23,568.0 0.54 23,676.9 0.52 24,951.9 0.51 0.55 Non-Basic -0.09 15 Education 20,596.76 0.70 23,608.2 0.72 25,715.3 0.71 29,424.9 0.77 32,422.2 0.77 0.73 Non-Basic 0.07 16 Human Health & Social Work Activities 5,790.04 0.60 6,303.7 0.60 6,720.2 0.59 7,780.5 0.64 8,880.8 0.67 0.62 Non-Basic 0.06 17 Other Services Activities 17,450.14 1.23 18,862.2 1.26 20,347.9 1.23 22,137.5 1.21 24,120.8 1.17 1.22 Basic -0.06
Total 965,622.06 1,028,409.7 1,093,543.5 1,149,231.4 1,207,001.5
Source: own analysis Notes:
C. GDP Growth Rate of Indonesia and GRDP Growth Rate of West Java with DLQ Calculation
Industrial Origin
GDP Growth Rate of
Indonesia (%) Gi
GRDP Growth Rate of
West Java (%) Gin DLQ 11 12 13 14 15 11 12 13 14 15
1. Agriculture, Forestry and Fishery 11 9 11 11 11 10 -1 0 5 1 0 1 0.29 1) Agriculture, Livestock, Hunting, & Agriculture Services 10 8 10 10 9 9 -1 0 4 0 -1 0 0.29
(11) Food Crops 7 13 9 3 15 9 -2 -2 7 -2 -4 0 0.28 (12) Horticultural Crops 13 0 10 17 9 10 -2 -1 0 2 4 1 0.29 (13) Plantation Crops 13 7 11 11 3 9 4 4 3 -3 -1 1 0.31 (14) Livestock 8 11 13 13 10 11 0 1 2 4 4 2 0.30 (15) Agriculture Services & Hunting 11 11 10 7 11 10 -1 0 4 1 -1 1 0.29 2) Forestry & Logging 7 6 6 7 10 7 -4 0 -4 -2 -1 -2 0.28 3) Fishery 14 13 14 17 19 15 5 5 7 8 7 6 0.30 2. Mining and Quarrying 29 8 5 -1 -16 5 -3 -7 -1 2 1 -2 0.32 1) Crude Petroleum, Natural Gas, & Geothermal 32 11 6 -2 -25 4 -6 -8 -2 1 1 -3 0.32 2) Coal & Lignite Mining 57 7 4 -9 -23 7 - - - 0 0 0 0.31 3) Iron Ore Mining -5 -3 -2 -5 -14 -6 -12 -9 1 -4 -3 -5 0.46 4) Other Mining & Quarrying 10 10 10 22 19 14 10 0 0 4 1 3 0.26
3. Manufacturing 13 8 9 11 8 10 6 5 7 5 4 5 0.37
1) Coal & Refined Petroleum Products 22 5 5 5 -6 6 1 -1 0 6 -1 1 0.36 2) Food Products & Beverages 14 12 7 14 15 12 8 4 11 11 10 9 0.38 3) Tobacco Products 7 11 4 16 14 10 -2 1 1 8 9 3 0.33 4) Textiles & Wearing Apparel 12 8 11 7 0 8 5 3 9 8 7 6 0.42 5) Leather & Related Products, & Footwear 12 -2 14 15 10 10 5 -7 6 4 8 3 0.32 6) Wood & Products of Wood & Cork 5 2 10 14 2 7 -7 -6 7 -4 -3 -3 0.29 7) Paper & Paper Products 11 -2 1 14 4 5 5 1 1 -6 1 0 0.35 8) Chemicals, Pharmaceuticals, & Botanical Products 9 15 9 15 16 13 8 11 4 -4 4 5 0.31 9) Rubber Products & Plastics Products 8 6 0 5 7 5 8 1 -2 5 0 3 0.40 10) Other Non-Metallic Mineral Products 9 13 10 11 9 10 4 5 1 -8 2 1 0.28 11) Basic Metals 15 3 15 10 10 11 11 0 12 1 -1 4 0.33 12) Fabricated Metal Products 9 15 14 6 14 12 4 11 7 1 5 6 0.34 13) Machinery & Equipment -2 6 3 30 13 10 4 -1 -5 13 5 3 0.33 14) Transport Equipment 15 7 16 8 6 10 10 4 17 9 3 8 0.41 15) Furniture 10 2 11 13 11 9 3 -9 7 8 3 3 0.33 16) Other Manufacturing; 3 3 4 13 11 7 -1 -10 -1 13 5 1 0.35 4. Electricity and Gas 26 4 3 16 15 13 -4 9 8 5 -8 2 0.27 1) Electricity 24 1 1 13 22 12 4 13 6 4 -1 5 0.32 2) Manufacture of Gas & Production of Ice 38 18 9 27 -5 17 -7 7 9 5 -11 1 0.21 5. Water Supply and Sewerage 6 6 9 9 9 8 6 7 7 6 6 6 0.41
6. Construction 14 13 13 15 15 14 14 13 8 5 6 9 0.37
7. Wholesale and retail trade 15 7 11 13 8 11 8 12 5 3 4 6 0.37 1) Wholesale, Retail of Motor Vehicle/cycles 15 9 13 13 7 11 7 11 7 5 3 7 0.36 2) Wholesale, Retail Except of Motor Vehicle/cycles 16 6 10 12 8 11 8 12 5 3 4 6 0.37 8. Transportation and Storage 13 13 20 24 24 19 12 10 5 8 10 9 0.29 1) Railways Transport 1 16 13 35 48 23 -3 -8 6 13 3 2 0.18 2) Land Transport 9 8 19 19 25 16 13 8 5 8 9 8 0.32 3) Sea Transport 11 11 13 20 9 13 3 -6 -3 6 4 1 0.26 4) River, Lake, & Ferry Transport 13 6 14 18 9 12 -1 0 -1 -2 -2 -1 0.24 5) Air Transport 23 32 25 40 31 30 -13 66 7 7 15 16 0.26 6) Warehousing & Support Services for Transportation 15 16 20 25 18 19 16 10 6 7 9 9 0.30 9. Accommodation, Food & Beverage Services 12 13 15 11 6 11 7 7 5 6 8 7 0.36 1) Accommodation 15 24 24 17 9 18 -3 10 12 5 4 6 0.26 2) Food & Beverage Service Activities 11 10 12 9 6 10 9 6 3 6 9 7 0.39 10. Information and Communication 10 10 10 8 10 10 22 11 9 17 16 15 0.57 11. Financial and Insurance Activities 13 18 15 10 14 14 7 9 12 4 7 8 0.34 1) Financial Intermediary Services 12 22 16 8 14 14 7 10 15 3 7 8 0.34 2) Insurance & Pension Fund 14 12 15 15 13 14 5 4 4 13 8 7 0.32 3) Other Financial Services 15 13 13 14 14 14 6 5 5 8 7 6 0.31 4) Financial Supporting Service 14 13 16 13 12 14 3 3 3 9 8 5 0.30 12. Real Estate Activities 10 9 11 11 12 11 12 8 5 4 5 7 0.38 13. Business Activities 15 12 13 15 15 14 14 8 8 7 8 9 0.36 14. Public Administration & Defence 17 12 9 9 11 12 -3 4 -1 0 5 1 0.27
15. Education 15 16 14 11 14 14 15 15 9 14 10 13 0.42
16. Human Health & Social Work Activities 15 13 12 13 13 13 9 9 7 16 14 11 0.40 17. Other Services Activities 12 8 14 17 17 14 16 8 8 9 9 10 0.38
D. Development Priority of Water-Energy-Food Related Sectors in Long-Term Development Planning (RPJPD) West Java Province Year 2005-2025 (Local Regulation No. 24 Year 2010 Jo. No. 9 Year 2008)
No. Sector
1st Stage (RPJMN 2005-2008) Stage 2 (RPJMN 2008-2013) Stage 3 (RPJMN 2013-2018) Stage 4 (RPJMN 2018-2023) Stage 4 (RPJMN 2018-2023) Set up and preparation of
1 Water Regulation establishment of water infrastructures
Proceeding and performing infrastructures development to support (1) improvement of raw water availability for any purposes, (2) optimization of flood and droughts control (3) optimization of irrigation network availability, (4) improvement of clean water and sanitation availability
Completion of Jatigede Reservoir; Development planning of Sukahurip,
Improved raw water availability for any purposes, optimized flood and
Self-reliant raw water availability for any purposes, reliable flood and
2 Energy Institutional preparation, human resources
Improved institution, human resource, and regulation in energy sector
Preparation of regional master plan of energy in West Java Province; development planning of energy self-reliant village; improved energy conservation and saving; improved energy supply and access; increased people participation
Improvement of energy infrastructure; capacity improvement of PLTA, PLTP
Reliable energy supply, Energy self-reliant village, improved energy efficiency, reliable energy conservation and saving,
Private sector engagement in new and renewable energy by incentive scheme
Self-reliant energy by reliable energy infrastructures, energy self-reliant village, reliable energy supply, energy conservation and saving
Improved private sector and community participation in new and
Agriculture development focusing on:
Farmer’s welfare, rehabilitation of supporting
Marine and fishery business development through: commercial fishery development,
Marine and fishery business development through: intensive
Marine and fishery business development through: improvement