SUPPORTING INDONESIAN FIFTH-GRADE STUDENTS
TO LEARN ABOUT PROPORTION
MASTER THESIS
Andrea Arifsyah Nasution
NIM 127785079
STATE UNIVERSITY OF SURABAYA
POSTGRADUATE PROGRAM
SUPPORTING INDONESIAN FIFTH-GRADE STUDENTS
TO LEARN ABOUT PROPORTION
MASTER THESIS
A Thesis Submitted to Surabaya State University Postgraduate Program as a Partial fulfillment of the requirements for the Degree of Master of Science in
Mathematics Education Program
Andrea Arifsyah Nasution
NIM 127785079
STATE UNIVERSITY OF SURABAYA
POSTGRADUATE PROGRAM
APPROVAL OF SUPERVISORS
Thesis by Andrea Arifsyah Nasution, NIM 127785079, under the title Supporting Indonesian Fifth-Grade Students to Learn about Proportion has been qualified and
approved to be tested.
Supervisor I, Date,
Prof. Dr. Siti Magfirotun Amin, M.pd. ____ 25 Juni 2014_______
Supervisor II, Date,
Dr. Agung Lukito, M.S. ______ 24 Juni 2014 _______
Acknowledged by
APPROVAL
Thesis by Andrea Arifsyah Nasution , NIM 127785079, had been defended in front of the Board Examiners on July 17th, 2014.
Board of examiners
Name Signature Position
Dr. Agung Lukito, M.S. . . . . Chairman/Supervisor II
Prof. Dr. Siti M. Amin, M.Pd. . . . . Member/Supervisor I
Prof. I Ketut Budayasa, Ph.D. . . . . Member
Dr. Siti Khabibah, M.Pd. . . . Member
Prof. Dr. R. K. Sembiring . . . . . Member
Acknowledged by
Director of Post Graduate Program,
DEDICATION
This thesis is dedicated to my parents, my lovely wife and son, my brother, my sister and my lecturers who have always supported during my study at
UNESA, Indonesia and Utrecht University, the Netherlands I will always love you
ABSTRACT
Nasution, A. A. 2014. Supporting Indonesian Fifth-Grade Students to Learn about Proportion. Master thesis, Mathematics Education Study Program, Postgraduate Program of Surabaya State University. Supervisors: Prof. Dr. Siti M. Amin, M.Pd. and Dr. Agung Lukito, M.S.
Keywords: Students’ Visualization, Proportion, Proportional Reasoning, Realistic Mathematics Education (RME), Design Research
Generally, the way of teachers in teaching proportion usually stands at giving the students a ready-made formula, such as cross multiplication, to solve proportional problems involving fractions. As a result, the students tend to memorize the formula and just apply it in order to solve the problems. This will be meaningless for them because they do not even know and do not understand the meaning of proportionality. Additionally, proportion is also a difficult topic for students to study. Therefore, there is a need for us to support the students to learn about proportion and to develop their proportional reasoning to solve problems through innovations in teaching proportion.
To deal with this situation, we conducted a study which was aimed to support the fifth-grade students to learn about proportion and to develop their proportional reasoning. In order to achieve the aim of this study, we designed five instructional activities which were based on the heuristic of Realistic Mathematics Education (RME) within a learning trajectory. In this case, design research was chosen as an approach in order to investigate how the design works in the classroom.
In this study, HLT played an important role as a guideline to carry out the teaching and learning process. The HLT was implemented through six fifth-grade students from SD Al – Hikmah in the first cycle. All the students’ activities during the teaching and learning process were recorded so that they can be analyzed in a retrospective analysis. In this case, the retrospective analysis of the first cycle showed that the aims of the teaching and learning process had been achieved yet. Thus, the HLT was revised based on the retrospective analysis before they were applied in the second cycle. Subsequently, the improved HLT was used in the next cycle within 30 students from class 5C. In this case, the results of the teaching and
learning process indicated that the designed students’ activities could help students
ABSTRAK
Nasution, A. A. 2014. Supporting Indonesian Fifth-Grade Students to Learn about Proportion. Master thesis, Program Studi Pendidikan Matematika, Program Pasca Sarjana Universitas Negeri Surabaya. Pembimbing: Prof. Dr. Siti M. Amin, M.Pd. dan Dr. Agung Lukito, M.S.
Kata kunci: Visualisasi/model siswa, Perbandingan, Penalaran perbandingan, Realistic Mathematics Education, Design Research
Pada umumnya, cara guru mengajarkan perbandingan biasanya hanya memberikan siswa rumusan yang telah tersedia, seperti perkalian silang, untuk menyelesaikan masalah perbandingan. Hasilnya, siswa cenderung menghafal dan hanya mengaplikasikannya dalam menyelesaikan masalah. Hal ini akan menyebabkan siswa tidak mengetahui dan tidak mengerti arti dari perbandingan itu sendiri. Disamping itu, perbandingan juga merupakan topik yang sulit bagi siswa untuk dipelajari. Oleh karena itu, kita perlu membantu siswa untuk belajar mengenai perbandingan dan mengembangkan penalaran mereka dalam menyelesaikan masalah – masalah perbandingan melalui inovasi – inovasi dalam mengajarkan perbandingan.
Untuk menyikapi hal tersebut, dilaksanakanlah suatu penelitian yang bertujuan membantu siswa – siswa kelas lima sekolah dasar dalam belajar perbandingan. Supaya mencapai tujuan tersebut, lima aktivitas belajar mengajar didesain dengan berdasarkan prinsip Realistic Mathematics Education (RME) yang dirangkai dalam suatu proses pembelajaran. Oleh karena itu, design research digunakan sebagai suatu pendekatan untuk menginvestigasi bagaimana desain tersebut bekerja di kelas.
Dalam penelitian ini, HLT berperan penting sebagai sebuah pedoman untuk melaksanakan penelitian. HLT tersebut kemudian diterapkan kepada enam orang siswa kelas 5B SD Al – Hikmah di siklus pertama. Semua aktivitas belajar siswa selama siklus pertama direkam sehingga dapat dianalisis dalam “retrospective analysis”. Hasil analisis dari siklus pertama menunjukkan bahwa tujuan dari proses pembelajaran belum tercapai. Oleh karena itu, HLT tersebut direvisi dalam
PREFACE
My very special thanks I gratitude to Allah SWT for his blessing so that I can finish this thesis. In addition, my special thanks I gratitude to my wife, Sahri Ullya, S.Pd., my son and all my families that have helped and supported me during my study.
To begin with, my journey of doing research started when I was studying for my bachelor degree at State University of Medan (UNIMED). At that time, I was conducting a study which took place in secondary school since I was interested in that level. I got so much help from the lectures and my supervisor about how to conduct a research and how to write the thesis of my research. Furthermore, two years after my graduation in 2010, I got a chance to continue my study at State University of Surabaya and Freudenthal Institute, Utrecht University, the Netherlands. In order to fulfill the requirements of the regulations, I got much help from my lectures in UNIMED, Prof. Dian Armanto, M.Pd., M.A., M.Sc., Ph.D. and Dr. Hasratuddin Siregar, M.Pd. During my study at both universities, I was involved in PMRI as a student to implement Realistic Mathematics Education (RME) in Indonesia. In order to get my master degree, I needed to conduct a study which was aimed to investigate and to develop mathematics education in Indonesia especially in primary and secondary education.
In order to conduct my study, I needed to prepare for the design and learning materials that would be implemented in that study. The preparation started in the second semester of my study in Utrecht University, the Netherlands. During the preparation, I got so much help from my supervisor, Mieke Ables. She guided me how to create a good learning design but it was not easy for me. However, I know that there will be no progress if there is no struggle. Therefore, I would like to give my gratitude to her and to all the lectures and stuffs that helped me during my study at Utrecht University, such as: Maarten Dolk, Dolly van Eerde, Frans van Galen, Martin Kindt and others.
After finishing my study and making the preparation at Utrecht University, I, subsequently, needed to conduct the research in primary education in Surabaya, Indonesia. During the research in Indonesia, I also got so much help from my supervisors, Prof. Dr. Siti M. Amin and Dr. Agung Lukito, M.S., the principle, Ustadzah Endah, the staffs and the mathematics teacher, Ustadz Anwar Musyaddat, of the SD Al – Hikmah where this study was conducted. I also express my gratitude to the director of post graduate program, Prof. Dr. I Ketut Budayasa, M.Sc., for his support to my study.
order to improve this thesis so that this thesis can be a good and helpful reference for the other researchers to conduct their studies.
TABLE OF CONTENTS
2.4. Students’ strategies to solve proportional problems ... 11
2.5. Ratio table ... 11
2.5.1. What is ratio table?... 11
2.5.2. How to operate ratio table? ... 13
2.6. Realistic Mathematics Education (RME) ... 15
2.6.1. What is Realistic Mathematics Education? ... 15
2.6.2. The five tenets of Realistic Mathematics Education ... 15
2.6.3. Emergent modeling ... 17
2.6.4. Guided reinvention ... 20
2.8. The role of the teacher in the classroom ... 22
2.9. Proportion in the Indonesian primary school curriculum ... 22
CHAPTER III: RESEARCH METHODOLOGY ... 24
3.3.1.2. Interview with the teacher and the students ... 30
3.3.1.3. Classroom observation ... 30
3.5.5. Timeline of the research ... 37
CHAPTER IV: HYPOTHETICAL LEARNING TRAJECTORY (HLT) ... 39
4.1. Solving rice problem by using students’ models ... 42
4.2. Solving rice problem with a ratio table ... 45
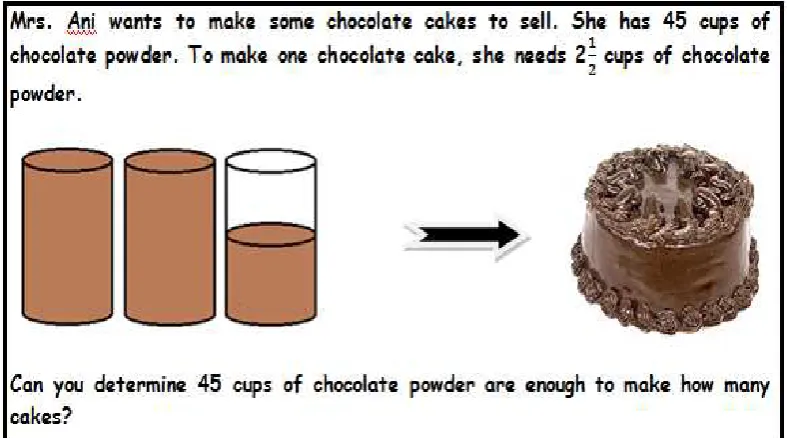
4.3. Making cakes to sell ... 47
4.4. Proportion in unit fraction ... 51
4.5. Proportion in non-unit fraction... 62
CHAPTER V: TESTING HYPOTHETICAL LEARNING TRAJECTORY ... 67
5.1. Teaching experiment ... 68
5.1.1. Preliminary teaching experiment (first cycle) ... 68
5.1.1.1. Classroom observation ... 69
5.1.1.2. Pretest ... 69
5.1.1.3. Interview with the students ... 69
5.1.1.4. Teaching and learning process ... 70
5.1.1.5. Posttest ... 74
5.1.2. Teaching experiment (second cycle) ... 75
5.2. Retrospective analysis ... 76
5.2.1. Preliminary teaching experiment (Cycle I) ... 76
5.2.1.1. Pretest ... 76
5.2.1.2. Interview with the students ... 83
5.2.4. Remarks and improvement of the Hypothetical Learning Trajectory .... 127
5.2.5. Teaching experiment (second cycle) ... 129
5.2.5.1. Students’ knowledge in the pretest ... 129
5.2.5.2. Interview with the students ... 132
5.2.5.3. Teaching and learning process ... 134
5.2.5.4. Posttest ... 158
5.2.5. Conclusion of students’ learning process in the second cycle ... 164
CHAPTER VI: CONCLUSIONS AND RECOMMENDATIONS ... 167
6.1. Conclusion ... 167
6.1.1. Answer to sub-questions ... 168
6.1.1.1. An answer to the first sub-question ... 168
6.1.1.2. An answer to the second sub-question... 169
6.1.1.3. An answer to the third sub-question ... 170
6.1.2. An answer to the research question ... 172
6.2. Reflection ... 172
6.2.1. The weakness of this study ... 172
6.2.2. The implementation of PMRI in the design of learning series ... 174
6.2.3. Contribution to the local instructional theory of proportion ... 174
6.2.3. A Local Instruction Theory (LIT) for the development of proportion 175 6.3. Suggestion ... 179
6.3.1. Suggestion for the teacher ... 179
6.3.2. Recommendation for future research ... 180
REFERENCES ... 182
LEARNING LINE OF STUDENT’S THINKING ... 185
LIST OF TABLES
Table 2.1. Strategies to operate a ratio table ... 14
Table 2.2. Short fifth-grade syllabus of Indonesian primary school ... 23
Table 3.1. The timeline of the study ... 38
Table 4.1. The overview of Hypothetical Learning Trajectory ... 42
Table 5.1. The improved HLT (HLT1)... 129
LIST OF FIGURES
Figure 2.1. Ratio table ... 12
Figure 2.2. Ratio table with multiplication strategy ... 12
Figure 2.3. Four levels models in designing RME approach ... 18
Figure 3.1. A cyclic process in Design-Based Research ... 27
Figure 4.1. Student’s worksheet 1 ... 43
Figure 4.2. Student’s representation of ... 44
Figure 4.3. Student’s strategy to solve proportional problem ... 44
Figure 4.4. Student’s worksheet 3 ... 47
Figure 4.5. Student’s worksheet 5 ... 62
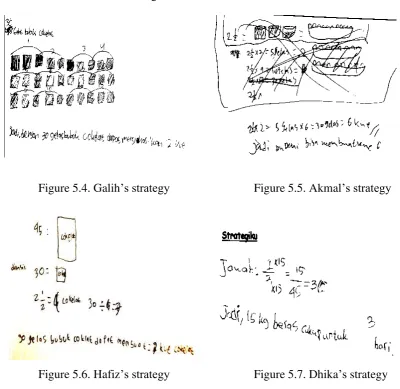
Figure 5.1. Galih’s strategy ... 77
Figure 5.2. Akmal’s strategy ... 77
Figure 5.3. Adit’s strategy ... 78
Figure 5.4. Galih’s strategy ... 80
Figure 5.5. Akmal’s strategy ... 80
Figure 5.6. Hafiz’s strategy ... 80
Figure 5.7. Dhika’s strategy ... 80
Figure 5.8. Raya’s strategy... 81
Figure 5.9. Adit’s strategy ... 81
Figure 5.10. Akmal’s strategy ... 82
Figure 5.11. Galih’s strategy ... 82
Figure 5.12. Hafiz’s strategy ... 82
Figure 5.13. ADhika’s strategy ... 82
Figure 5.14. Raya’s strategy... 82
Figure 5.15. Adit’s strategy ... 82
Figure 5.16. Question of interview ... 83
Figure 5.17. The strategy of group 1 ... 88
Figure 5.18. The strategy of group 2 ... 88
Figure 5.19. Strategy of group 1 ... 89
Figure 5.20. Strategy of group 2 ... 89
Figure 5.21A. Students’ visualization ... 95
Figure 5.21B. Students’ visualization ... 95
Figure 5.22A. Students get the idea of proportion ... 97
Figure 5.22B. Students get the idea of proportion ... 97
Figure 5.23. Rewriting students’ answers in a table ... 98
Figure 5.24. Dhika’s ratio table... 102
Figure 5.25. Strategy of group 1 ... 104
Figure 5.26. Ratio table of group 1 ... 104
Figure 5.27. Discussion of group 2 ... 105
Figure 5.28. Ratio table of group 2 ... 106
Figure 5.29. Ratio table of group 1 ... 107
Figure 5.30. Strategy of group 1 ... 110
Figure 5.33. Discussion in Group 1 ... 116
Figure 5.34. Adit’s strategy ... 120
Figure 5.35. Galih’s strategy ... 120
Figure 5.36. Dhika’s strategy ... 120
Figure 5.37. Akmal’s strategy ... 120
Figure 5.38. Hafiz’s strategy ... 121
Figure 5.39. Adit’s strategy ... 122
Figure 5.40. Galih’s strategy ... 122
Figure 5.41. Dhika’s strategy ... 122
Figure 5.42. Hafiz’s strategy ... 122
Figure 5.43. Akmal’s strategy ... 123
Figure 5.44. Adit’s strategy ... 124
Figure 5.45. Galih’s strategy ... 124
Figure 5.46. Dhika strategy ... 124
Figure 5.47. Hafiz’s strategy ... 124
Figure 5.48. Akmal’s strategy ... 125
Figure 5.49A. Students’ strategies in the pretest... 130
Figure 5.49B. Students’ strategies in the pretest ... 130
Figure 5.49C. Students’ strategies in the pretest ... 130
Figure 5.50A. Students’ strategies in the pretest... 131
Figure 5.50B. Students’ strategies in the pretest ... 131
Figure 5.51. Question for interview ... 132
Figure 5.52A. Students’ visualizations ... 141
Figure 5.52B. Students’ visualizations ... 141
Figure 5.52C. Students’ visualizations ... 141
Figure 5.53A. Students get the idea of proportion ... 143
Figure 5.53B. Students get the idea of proportion ... 143
Figure 5.54. Putting students’ answers in a table ... 144
Figure 5.55. Students’ ratio table ... 146
Figure 5.56. Students’ ratio table ... 150
Figure 5.57. Students’ representation ... 153
Figure 5.58. Students’ ratio table ... 155
Figure 5.59. Students’ ratio table ... 157
Figure 5.60. Ryan’ strategy ... 160
Figure 5.61. Dekka’s strategy ... 160
Figure 5.62. Farhan’s strategy ... 161
Figure 5.63. Nanda’s strategy ... 161
Figure 5.64. Ryan’s strategy ... 162
Figure 5.65. Raka’s strategy... 162
Figure 5.66. Farhan’s strategy ... 162
Figure 5.67. Nanda’s strategy ... 162
Figure 5.68. Ryan’ strategy ... 163
Figure 5.69. Farhan’s strategy ... 163
LIST OF FRAGMENTS
Fragment 5.1. Galih’s struggle to answer the third problem of pretest... 83
Fragment 5.2. The strategies of group 1 to solve the first problem ... 88
Fragment 5.3. Akmal uses his own model in solving problem ... 89
Fragment 5.4. The teacher guides the students to get the idea of proportion ... 94
Fragment 5.5. The students build the sense of proportion ... 96
Fragment 5.6. The students start using the ratio table... 98
Fragment 5.7. Student’s struggle to operate ratio table ... 99
Fragment 5.8. Students in Group 1 try ratio table ... 103
Fragment 5.9. Students in group 2 try ratio table ... 104
Fragment 5.10. Students in group 1 use repeated addition strategy... 106
Fragment 5.11. Students in group 1 use their own model to solve problem ... 109
Fragment 5.12. Students in group 2 use their own model in solving problem ... 112
Fragment 5.13. Students in group 1 use ratio table to solve problem ... 114
Fragment 5.14. Students use repeated addition strategy to solve problem ... 116
Fragment 5.15. Interview with Raka ... 133
Fragment 5.16. Students use their own model to solve problem ... 135
Fragment 5.17. Students’ mistake to solve proportional problem ... 136
Fragment 5.18. Variety of students’ strategies... 136
Fragment 5.19. Students’ visualization to solve problem ... 141
Fragment 5.20. The teacher guides the students to the idea of proportion ... 143
Fragment 5.21. Students use ratio table with multiplication strategy ... 145
Fragment 5.22. Students use ratio table with repeated addition strategy ... 149
Fragment 5.23. Students’ presentation in the whole-class discussion ... 149
Fragment 5.24. Students use their own model to solve proportional problem ... 153
Fragment 5.25. Students use their own model to solve proportional problem ... 154
LIST OF APPENDICES
Appendix 1. Teacher’s Interview Scheme ... 186
Appendix 2. Classroom Observation Scheme ... 187
Appendix 3. Teacher Guide ... 188
Appendix 4. Pretest ... 201
Appendix 5. Posttest ... 204
Appendix 6. Student’s Worksheet ... 207
Appendix 7. Rencana Pelaksanaan Pembelajaran (RPP) ... 214
CHAPTER I INTRODUCTION
1.1. Research Background
It is a truism that proportion is very close to children’s daily life since they can find it everywhere. An example of this situation is that when they want to buy milk in a supermarket, when we want to buy t-shirts in a department store, when we want to cook rice at home and other situations. Thus, they can apply the concept proportion so often in those situations. For instance, the price of one box of milk is Rp. 45.000,00 what is the price of 5 boxes of milk? In this case, the
statement “one box of milk costs Rp. 45.000,00” describes a proportion between
an amount of boxes of milk that can be bought and the amount of money (Lo & Watanabe, 1997). Based on this situation, it can be seen see that proportion has a wide scope in a real-life situation. However, they do not know what proportion is.
kilogram of rice and the number of days and others. Thus, it is necessary for the children to learn about this topic.
In Indonesian educational system, children start learning about proportion when they are in the fifth grade of elementary schools. At this level, most of the young children are required to use the fixed mathematical procedures and algorithms in order to solve problems related to proportion (e.g. Soenaryo , 2007; Sumanto et al., 2008; cited in Sumarto, 2013). The reason of this situation is that many mathematics text books used in Indonesia which mostly contains a set of formal rules and algorithms and they are lack of applications based on realistic problems (Zulkardi, 2002). For instance, Sumarto (2013) stated that most of the mathematics teachers teach cross multiplication to solve proportional problems. She also stated that when the students are taught formal procedure, they will not be able to develop their proportional reasoning. Thus, it is necessary to help children develop their mathematical thinking about proportion.
Moreover, the results of recent studies also identified that it is very difficult for fifth-grade students to solve proportional problems and their proportional reasoning (e.g. Hiebert and Behr, 1988; van Dooren et al., 2010; Lo & Watanabe, 1997; Widjaja et al., 2010; Silvestre & da Ponte, 2012). The possible reason for this situation is that proportional reasoning involves an understanding of the
“relation between relation” (Piaget, 1975; cited in Boyer, 2008). Additionally, students feel difficult to deal with fractions since fractions, itself, are the most complicated numbers to deal with arithmetic (Ma, 1999).
Furthermore, these studies also identified three factors that can lead most students to errors, such as: the existence of an integer ratio, the complexity of the numbers, such as: fractions and decimals, and the order of the number. This can be a reason why the development of proportional reasoning which includes fractions is one of the most difficult aspects for students’ mathematical thinking. For these reasons, we attempt to conduct a study which is aimed to investigate the
development of students’ proportional reasoning which includes fractions by
creating a meaningful teaching and learning situation, such as: making the topic
real in students’ mind through the use of concrete models.
Dealing with this, many researchers suggest the mathematics teachers to use
(Widjaja et al., 2010; Middleton & van den Heuvel-Panhuizen, 1995). Relating to these circumstances, one way of assisting the students to develop mental strategies for solving proportion problems is through the use of ratio tables (Middleton & van den Heuvel-Panhuizen, 1995, cited in Dole, 2008). Moreover, Dole (2008) pointed out that using ratio table is an efficient way to symbolize the elements within proportion situations, and for supporting thinking strategies for solutions. However, it is rarely found that the researchers use a ratio table as the concrete
model in their studies in order to support students’ proportional reasoning in terms of fractions. Therefore, it is necessary to conduct more researches in order to find
out how the ratio table can develop the students’ proportional reasoning which
includes fractions.
1.2. Research question
To deal with the problems, this study is conducted in order to develop a number of learning activities which are designed to support students to learn about proportion. Therefore, the research question of this study is formulated as follows:
How can models support students to develop their proportional
reasoning involving fractions?
To answer the research question above, we also attempt to formulate research questions, such as:
1. How do the 5th grade students solve proportional problem including fraction?
3. How can ratio table support students to develop their proportional reasoning?
1.3. Research aim
In order to help students learn about proportion, we conducted a research which is aimed to contribute to the classroom practices in learning about proportion which involves fractions. To be more specific, this research is
purposed to investigate the development of students’ proportional reasoning by
using models.
1.4. Definition of key terms
In order to clarify the key terms used in this study, we, in this case, provide the descriptions of each of them, such as:
1. Proportion can be stated as a statement of equality of two ratios = (Tourniaire & Pulos, 1985) and a comprehensive concept since it includes fractions, percentages and decimals (Van Galen, 2008).
3. Basically, model is a representation which is used to solve problems. Furthermore, Sumarto (2013) pointed out that models are important to
bridge the students’ informal knowledge into formal mathematics.
4. Supporting, in general, can be defined as a process of giving help to somebody (merriam-webster dictionary). In relation of this study, supporting students to learn refers to a process of giving help for students to learn about proportion through designing learning activities and educational materials.
1.5. Relevant research
CHAPTER II
THEORETICAL FRAMEWORK
This chapter will provide the structure of the main theories that contribute to the groundwork of this study. In this case, several studies, related to the teaching and learning about developing students’ proportional reasoning, were studied to find out a meaningful way in order to support students to develop their proportional reasoning which includes fractions and to design the instructional materials for the curriculum of Indonesian primary education within the fifth grade.
Furthermore, a proportional situation is used as a starting point to investigate the students’ mathematical thinking in terms of proportion. In this case, the Realistic Mathematics Education approach is embedded in this study in order to design and to examine situations in which these instructional activities are expected to lead the students to a more formal mathematical thinking.
2.1. Proportion
Meanwhile, a proportion, in mathematics perspective, can be stated as a statement of equality of two ratios = (Tourniaire & Pulos, 1985) and can be defined as a comprehensive mathematical concept (Galen et al., 2005). This means that understanding proportionality is also important in mathematics since it is a foundation of rational operations, unit partitioning in problem solving (Empson, 1999; Fuson & Abramamson, 2005; Haseman, 1981, Pitkethly & Hunting, 1999; Saxe et al., 1999; Sopian et al., 1997; cited in Boyer et al., 2008).
Dealing with this situation, Shield and Dole (2002) stated that students’
understanding of proportion generally poor since it is not easy for them to solve proportional problems. Dealing with this, there are several factors that influence
students’ performance to solve proportional problems, such as:
1. Tourniaire & Pulos (1985) identified two common factors, such as: - Structural variables of the proportional problem
Structural variables of the proportional problem can be stated as a factor that comes from the chosen number, such as: presence of integer ratio, numerical complexity, and the order of the number, the presence of a unit and the presence of unequal ratio for comparison problem.
- Context variables of the proportional problem
the problem, such as the problems which contain mix numbers will be more difficult than the problems that include no mix numbers. Understandable problem means that it will be easier for students to solve proportional problems if they understand the problem.
2. Steinthorsdottir (2006) distinguished two variables that contribute to the difficulties for students to solve proportional problems, such as: number structure and problem contextual structure.
2.2. Proportional reasoning
In general, reasoning refers to the students’ ability to think about and to use
mathematics in a meaningful way (National Council of Teachers of Mathematics, 2007). Thus, the students can give their opinion to look for solutions to the problem and they can justify/prove their solutions or even they can evaluate the solutions.
Furthermore, proportional reasoning is used as a major tool for human being to interpret those everyday-life phenomena (Centre de Recherchesor
l’Enseignement des Mathematiques, 2002; Lesh et al., 1988; cited in van Dooren
et al., 2009). Besides, proportional reasoning has been called the backbone, the cornerstone, the gateway to higher level of mathematics success and is considered
as a “capstone” of primary school mathematics (Kilpatrick, Swafford & Findell,
2001; Lamon, 1999; Lesh et al. 1988; cited in Parish, 2010). According to
Piagetian theory, proportional reasoning involves understanding the “relation
think about and the way how the students use mathematics to solve proportional problem in a meaningful way.
Relating to this situation, the development of proportional reasoning, then, can be seen as an important goal of primary school mathematics (Shield & Dole,
2002). This is because many topics in mathematics require students’ proportional
reasoning and thinking. For instance, it is used when students solve geometry, percentages, fractions, ratio, decimal, scale, algebra and probability problems
(Dole et al., 2008). In this study, we attempt to investigate students’ proportional
reasoning when they are given proportional problems which include fractions. 2.3. Fraction
In the earliest stage of the introduction of fraction, one of the commonly used meanings of fraction is the part-whole relation (Van de Walle et al., 2010 & Streefland, 1991). For instance, one-second is commonly represented by one part over the two equal parts. However, there are still many mathematics teachers, who teach in elementary schools, do not realize that there are other representations of fraction.
2.4. Students’ strategies to solve proportional problems
Many studies have been conducted to investigate students’ proportional
reasoning in primary and secondary schools (e.g. Tourniaire & Pulos, 1985; Shield & Dole, 2002; Dole et al., 2008; van Dooren et al., 2009; Langrall & Swafford, 2000; Widjaja et al., 2010; Sumarto, 2013 and others). The results of these studies have shown that there are several strategies that students mostly do, such as:
1. Students incline to use additive methods to solve proportional problems (Hart 1981; Karplus et al., 1983; Misailidou & Williams, 2003; Tourniaire & Pulos, 1985; cited in van Dooren 2010).
2. Students’ initial attempts to solve proportional problems suggest their tendency to use procedural algorithms, such as the division algorithm and multiplication (Widjaja et al., 2010).
3. Students, in a certain case, will use repeated subtraction to solve proportional which indicates a better understanding of the problem (Widjaja et al., 2010).
4. Students use standards solution procedure for solving proportional problems
which is the “cross-multiply and solve for x” (Post et al., 1988; cited in Shield & Dole, 2002).
2.5. Ratio Table
2.5.1. What is ratio table?
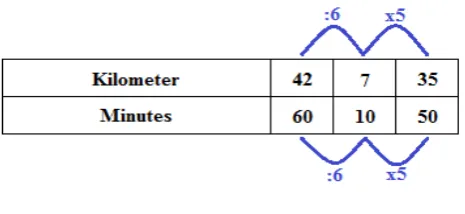
calculations and to make students reason with proportion. Middleton & van den Heuvel-Panhuizen (1995, cited in Dole 2008) pointed out that a ratio table is one way of assisting the students to develop mental strategies for solving proportion problems. For instance, to determine how many kilometers that we have travelled in 50 minutes if we can reach 42 km in 60 minutes by a car. In this case, ratio table shows clear visualizations of the calculations since we can add more columns as we need (see figure 2.1.).
Figure 2.1. Ratio table
Beside ratio table can be used to deal with proportional problems, it can also be applied to solve division problems. Streefland (1991) argued that “division can
be handled fairly smoothly with the aid of ratio table”. This is because it is very
Figure 2.2. Ratio table with multiplicative strategy
Thus, it is obvious that a ratio table can be used by the teachers to teach proportion in the classroom.
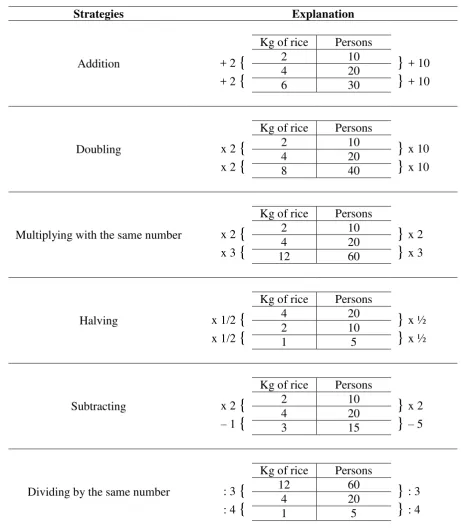
2.5.2. How to operate ratio table?
When teachers want to use ratio table in teaching proportions including fractions at the elementary level, then it is necessary for them to discuss what can be done in a ratio table. Indeed, context plays an important role to make the students realize what mathematical operations that they can use, such as the number of paper bee and the number of its legs. In this case, student can multiply both units with the same number; they, however, can not add them with the same number. This is because each unit, in a ratio table, must have the same proportion.
Van Galen et al. (2008) proposed that “the advantage of ratio table is that all
numbers have their own place and that the unit measurement must stay the same”.
Thus, teachers need to state clearly what units are used and the arrows to see the operations.
2.6. Realistic Mathematics Education (RME) 2.6.1. What is Realistic Mathematics Education?
Realistic Mathematics Education (RME) is a domain-specific teaching and learning instruction theory for mathematics education (e.g. Treffers, 1987; De Lange 1987; Streefland 1991; Gravemeijer, 1994; Van den Heuvel-Panhuizen 1996; Van den Heuvel-Panhuizen, 2003) and originally adopted from The Netherlands. According to Van den Heuvel-Panhuizen (2003), the word ‘realistic’
comes from ‘zich realiseren’ which means ‘to imagine’.
In Realistic Mathematics Education, mathematics means that it must be related to the reality and is viewed as a human activity (Freudenthal, 1991). In this
case, the term “realistic” does not always refer to the students’ real word. The
word ‘realistic’, however, denotes more to problems situation that students can
imagine and are meaningful for them (Van den Brink, 1973; Wijdeveld, 1980; cited in Van den Heuvel-Panhuizen, 2003). In other words, mathematics, in classroom practices, can be related to problem situations as long as these
situations are real in students’ mind.
2.6.2. The Five Tenets of Realistic Mathematics Education
1. Phenomenological exploration
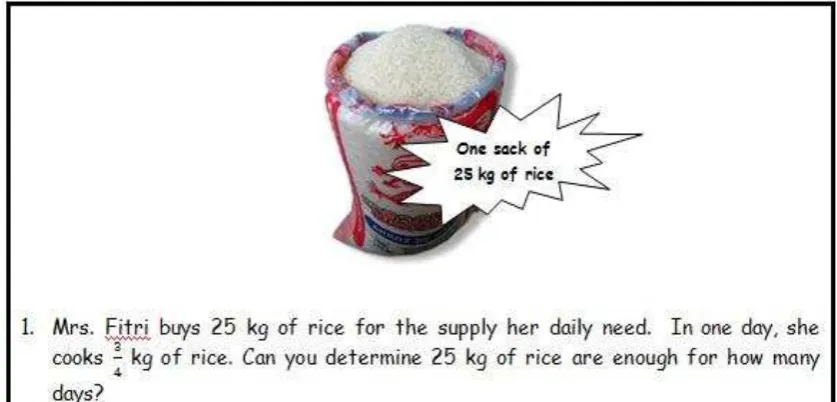
From the point of view of Realistic Mathematics Education, the preliminary instructional mathematical activities must be concrete and real to students. This means that the mathematical activity should not be started at a formal level. Therefore, this study employs the proportional situation to determine 20 kg of rice are enough for how many days.
2. The use of models
In order to bridge the students’ informal to more formal level understanding, mathematical models are needed. In this study, the preliminary knowledge of the students towards proportion which includes fractions needs to be developed. Thus, it is expected that models, such as: students’ visualization and ratio table, can
bridge students’ thinking from a concrete to a more formal level in this study.
3. The use of students’ own creation and contributions
This is the most crucial part in teaching mathematics based on Realistic
Mathematics Education approach. Students’ creations and contributions during the teaching and learning activity are used in order to promote the next steps in the
learning process. In relation of this study, the various solutions of students’
strategies when they are working with a ratio table can be used to develop the next
learning activity. In this case, the students’ strategies to work with a ratio table
4. The interactivity
The learning activities in Realistic Mathematics Education approach do not stand only between teacher and students which is called a one way of teaching method. However, the interactivity, in this case, means the interactions between students and also between students and teacher. In relation to this study, the interaction between students takes place when they present their work to the whole class and in discussions. Moreover, the interaction between the students and the teacher also happens during the class discussion. Therefore, teacher plays an important role in leading the discussion.
5. The intertwinement of various mathematics strands
Intertwinement of various mathematics strands signifies the relation of a mathematics topic which is being observed to other topics, such as geometry, percentages, fractions, ratio, decimal, scale, algebra and probability problems (Dole et al., 2008). In this study, the proportional situations in terms of fractions, in this study, are intertwined with the use of ratio table. In this case, the informal way of working with ratio table is emerged through the proportional activities since they embed the use of ratio table.
2.6.3. Emergent modeling
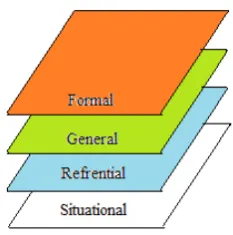
for more formal mathematical reasoning. Thus, the function of the model in designing teaching and learning based on Realistic Mathematics Education is that it should help students develop their thinking from an informal to a more formal level.
Gravemeijer (1994) proposed that there are four levels of mathematical activities used in teaching RME in classrooms, situational activities, referential activities, general activities and formal mathematics reasoning. The sequence of the model from a model-of thinking that represents a problem to model-for more formal reasoning can be seen in figure 2.3.
Figure 2.3. Four levels models in designing RME approach
In relation to this study, the implementation of these four levels of emergent models can be seen as the following.
1. Situational activity
quantities, the number of kilograms of rice and the number of days. The students will use their prior understanding about comparing whole numbers and fraction, such as: 20 kg of rice are enough for how many days if one day Mrs. Ani’s family consumes kg of rice. At this level, they may draw pictures to explain their answer.
2. Referential activity
The referential level can be stated as the level of model-of among the whole learning sequence. In this case, a class discussion will encourage students to move from the situational to the referential level by promoting students to make the representations of the problem.
In this study, students will write their strategies that represent the proportional problems and present it in class discussion. Indeed, the students will not automatically come up with the ratio table which is the model-of the situation. Thus, teacher plays an important role during the discussion. In this case, the teacher will discuss and guide the students to more structured representations.
3. General activity
The general activity can be stated as an activity where students start working with the model-for thinking. In this activity, the model is used to show a framework of mathematical relations which focus on strategies.
the relations among units which they can see in the ratio table. In order to do this, they need to remember what they have learned in order to operate ratio table.
4. Formal mathematics reasoning
Formal mathematics reasoning signifies the mathematical activities which do not depend on the support of the model for. In this case, the design of the instructional activities, in this study, does not reach this formal mathematics
reasoning. This is because this study only focuses on students’ reasoning to solve proportional problems which include fractions by using ratio table.
2.6.4. Guided reinvention
One of the characteristics of RME teaching is the guided reinvention. In this case, guided reinvention can be defined as experiencing the process of learning mathematics as a process which is similar to the process of the mathematics when it was invented (Gravemeijer, 1994). A process of guided reinvention then would have to ensure that this mathematical activity would foster the construal of mathematics as a body of knowledge by the students (Gravemeijer and Cobb, 2006). Therefore, the main objective of the guided reinvention is that the students experience real towards the mathematics that they have created.
2.7. Socio Norms and socio-mathematics norms
social norms can be seen when they explained and justified their solutions, attempted to make sense of explanations, show an agreement or a disagreement and give alternative solutions when a conflict or disagreement happened.
Meanwhile, the socio-mathematics norm can be differentiated from socio norms as the ways of clarifying and acting in the whole-class discussions which are specific to mathematics (Gravemeijer and Cobb, 2006). They also mentioned the example of the socio-mathematics norms that it includes what count as a different mathematical solution, a sophisticated mathematical solution, an efficient mathematical solution, an acceptable mathematical solution and justification. Therefore, socio mathematics norms were very important in this study where the students could make the socio norms when a mathematics conflicts happened.
In investigating the development of students’ proportional reasoning, the socio mathematics norm and socio-mathematics norm needed to be established in the classroom. In creating the socio norms and the socio-mathematics in the classroom, the teacher played an important role to create the socio norm and the socio mathematics norm in the classroom. The teachers needed to change their traditional teaching into the new teaching method. Indeed, this will take more time to set such learning situation.
were familiar to work together in group. Therefore, it was not difficult to develop the socio and socio-mathematics norms in the classroom.
2.8. The role of the teacher in the classroom
In conducting design research in the classroom, we have to pay attention to the role of the teacher. In this case, the teacher plays an important role to establish the expected classroom situation. According to Gravemeijer and Cobb (2006) stated that:
“The role of teacher will include introducing the instructional
activities, guiding the process of talking. Further, the teacher will have to select possible topics for discussion and orchestrate the whole-class
discussions on these topics”.
In addition, the teacher played an important role to guide students to reinvent the desired mathematics notions. In this case, guiding students mean directing the students to reinvent the mathematical phenomenology based on their own way of thinking. The teacher should create such learning situation so that the students can experience the process of learning mathematics as the similar process when mathematics was invented (Gravemeijer, 1994).
2.9. Proportion in the Indonesian primary school curriculum
In this case, table 2.2. shows that the proportion is included in the Indonesian primary education.
Standard Competence Basic Competence 5. Using fraction in order
to solve mathematical problems
5.1. Changing fraction into percents, decimals and vice versa.
5.2.Adding and subtracting fractions.
5.3.Multiplying and dividing fractions.
5.4.Using fraction to solve problems related to ratio and scale.
CHAPTER III
RESEARCH METHODOLOGY
3.1. Participants
This study was conducted at SD Al – Hikmah in Surabaya, Indonesia. In this case, this study will take place in the second semester of the fifth grade. In this semester, students in the fifth grade will learn about proportion and kinds of proportions, such as: direct proportion and indirect proportion.
The participants of this study are the students who study in the fifth grade and the mathematics teacher. In this case, the fifth-grade students of SD Al – Hikmah would be envolved to conduct the teaching and learning process of this study.
3.2. Research Approach
order to make an improvement and to make an innovation to the development of local instruction theory in mathematics education related to this topic.
For these purposes, the design-based research is selected as an appropriate approach in order to answer the research question and to reach the research aims.
In this case, Bakker and Van Eerde (2013) proposed that “design-based research is
claimed to have potential to bridge between educational practice and theory”. This
is because the aim of design research is to develop local instruction theories about both the process of learning and the means designed in order to support that learning (Bakker & Van Eerde, 2013; Gravemeijer & Cobb, 2006). In the relation to this study, a number of instructional activities are designed to enhance and to make innovations in educational practices, especially the 5th grade, about proportion in Indonesian elementary schools. This indicates that this study concentrates not only to know whether mathematical model can support students to learn proportion which includes fractions, but also more specific on how it can support the 5th grade students in Indonesia.
According to Gravemeijer and Cobb (2006), conducting a design study consists of three fundamental phases, such as (1) preparing for the experiment, (2) experimenting in the classroom, and (3) conducting retrospective analysis. Based on this situation, these three phases in this research will be described as follows:
(1) Phase one, preparing for the experiment
ideas of this study are inspired by studying literatures about the concepts of proportion which includes fractions before designing the learning activities. During studying these literatures, the researcher started designing the learning activities. The order of these learning activities is arranged and described more detail in the learning line which is part of a Hypothetical Learning Trajectory (HLT).
Basically, a Hypothetical Learning Trajectory (HLT) involves four components: the starting point, the learning goals which define the directions, the learning activities and the hypothetical learning process which includes the
conjectures of students’ thinking and understanding in the context of learning
activities (Simon, 1995; Van Eerder, 2013). In this case, these conjectures of hypothetical learning trajectory are dynamic. In other words, the term dynamic means the conjectures of hypothetical learning trajectory can be changed and
modified depending on the actual situations of students’ learning experience
during the teaching and learning process.
(2) Phase two, experimenting in the classroom
The second phase of the design research is the experimenting in the classroom. Basically, there is a process of (re)designing, testing the instructional
activities, conjectures of students’ thinking and other aspects in a design research
limitation in conducting the number of cycles. In this case, Gravemeijer (2004) visualized the cyclic process in design research in the figure 3.1.
Figure 3.1. A cyclic process in Design-Based Research
In relation to this study, we did not know the number of cycles that this research would take place in the actual teaching experiment. To deal with this situation, we conducted a pilot experiment which was also considered as the first cycle of the design study. It could be considered as a bridge that intertwines the preliminary design and the teaching experiment. In this case, the aim of this pilot experiment is to know the prior knowledge of the students and to investigate whether the instructional activities in the Hypothetical Learning Trajectory (HLT) were doable for students. Thus, the preliminary hypothetical learning trajectory is tested. Subsequently, the investigated actual teaching and learning experiment was used in order to make adaptations in the HLT. After improving the initial HLT, the new HLT could be tested in the next cycle.
Initially, the aim of teaching experiment is to collect data in order to answer the research question. In fact, it is more than just answering the research question. According to Gravemeijer and Cobb (2006), the purpose of the teaching experiment is both to test and to improve the conjectured local instruction theory developed during the preliminary phase and to develop an understanding of how it works. In order to investigate how it works, a discussion between the researcher and the teacher is important to make an agreement about the upcoming activities on how the lesson will be delivered based on the point of view of the researcher and the teacher. Moreover, there is also a reflection about the whole series that focuses on the strong and the weak points of the teaching and learning process.
After conducting the second cycle, we did reflections to the teaching experiment whether the actual teaching experiment had met the learning goals in the HLT that had beed made by the researcher before. On the one hand, if the actual teaching experiment had corresponded to the HLT, then we could stop the teaching and learning, within two cycles. On the other hand, if the actual teaching experiment did not correspond to the HLT, then we needed to conduct more cycles to revise the HLT and to see how the HLT worked in the actual teaching experiment.
(3) Phase three, conducting retrospective analysis
instruction theory. Gravemeijer and Cobb (cited in Van den Akker et al., 2006) pointed out that one of the primary aims of a retrospective analysis is to contribute to the local instruction theory. In making this retrospective analysis, the Hypothetical Learning Trajectory played an important role as a guideline for us in order to conduct this study. In this case, we compared the HLT to the actual teaching and learning process in the classroom in order to improve the initial HLT.
3.3. Data Collection
In this study, we use different types of data in order to answer the research question. The data obtained from different phases, such as: pre-test, preliminary phase, teaching experiments and post-test. The description of data collecting data for each phase can be seen as follows.
3.3.1. Preliminary Phase
Collecting data in the preliminary phase is aiming to investigate the present knowledge of the students that will become the starting point in the teaching experiment and to gain information about the teaching and learning environment in the observed classroom. During this phase, we will conduct classroom observation, pre-test, interview with the teacher and the students and video recording in order to collect the data in this study.
3.3.1.1. Pre-test
is to get an insight about the prior knowledge of the students related to the proportion. Thus, we get the students’ written work as our data collection.
3.3.1.2. Interview with the teacher and the students
After conducting pre-test, we conduct an interview with the teachers and the students. Before the teaching experiment, the researcher will conduct some interviews with the teacher. This interview aims to get the information about the
students’ prior knowledge, classroom norms which include socio norms and socio
mathematics norms and the understanding of the students towards the topic. Moreover, the researcher will also conduct an interview with several students in
order to get the data about the level of students’ thinking and ability before the experiment is carried out. In this phase, the video recording is used to record the interview with the teacher and the students.
3.3.1.3. Classroom observation
Classroom observation is conducted before starting the teaching experiment (the first cycle). The aim of conducting classroom observation is to investigate the
situation of students’ learning, how the teacher teaches the students and to
investigate the socio norms and the socio mathematics norms during the teaching and learning process. Thus, it is necessary to record the whole teaching and learning process during the classroom observation and make some field notes to see what happens in the classroom.
Trajectory (HLT) in terms of the students’ prior knowledge and the starting point of the design experiment for the next cycles.
3.3.2. Teaching experiments
In this study, we conducted the first phase of teaching experiments which was purposed to pilot the HLT in the actual teaching experiment. In other words, the first cycle was not only purposed to know the students’ thinking and reasoning, but also to test the conjecture in the Hypothetical Learning Trajectory. This pilot teaching experiment was carried out with a small group of students by trying out the initial HLT that had been designed before. In this case, we selected students from the fifth grade who had high, middle and lower level of understanding as the participants in conducting this pilot teaching and those students were different from the students who would work in the second cycle.
In this phase, the data would be collected through students’ written work, by making a video recording of the whole activities in this lesson. Furthermore, the researcher would teach the students during this phase. After the data had been gained, then they were used in order to make reflections aimed to revise and to improve the initial HLT. Subsequently, we used the revised HLT as the guideline to conduct the next cycle.
During the next teaching experiments, the researcher collected the data in the form of video registration, students’ written work and field note. The video recording was used to record the whole series of students’ activities in order to get
the data of the students’ thinking and reasoning during the teaching experiment.
whole teaching and learning process and the students’ activities of the focus group. In this case, the students also had a high, middle and lower levels of understanding which were obtained based on the interview with the teacher.
Moreover, we also used field note in order to collect data in this study. This was because field note was also an important aspect to collect the data in this study. In this case, although two cameras had been installed to record the whole class activities, the field note, however, was still needed to investigate a certain moment of the student’s activities and strategies which might not be recorded properly by the video cameras.
3.3.3. Post-Test
In the end of the learning activities, the students will be given post-test within the whole students in the classroom. The aim of this post-test is to evaluate
the students’ understanding towards what they have learned within the whole
teaching experiment. In this case, the data collected from the students’ work. After conducting the post-test, we continue conducting an interview with the students about their work in the post-test. The aim of the interview is to investigate the
students’ thinking and reasoning to solve the problems in the post-test. In order to
record the students’ reasoning during the interview, a video recording is needed.
3.4. Validity and reliability
refers to the independence of the researcher. In this study, the description of validity and reliability can be seen as follows.
3.4.1. Validity
The data gathered through the learning activities which are designed in order to help students learn about proportion which involves fractions. In a design based research, the validity is distinguished into two aspects, the internal and external validity (Bakker and Van Eerde, 2013). The internal validity stands for the quality of the data collections and the soundness of the reasoning which will lead to the conclusions. In the relation to this study, the internal validity of this study, on the one hand, includes the data collection, the method of data analysis and triangulation. This is because the internal validity refers to the quality of the data collections and the power of argumentations which led to the conclusions (Bakker et. al, 2012). Meanwhile, the external validity can be simply defined as the “generalizability” or “transferability” of a study. In other words, the external validity of this study extends to which findings are transferable to some broader domain (Van den Akker et. al, 2006).
In order to contribute to the internal validity in this study, the researcher will collect the different data during the teaching experiment, such as video recording of observations will be made during the teaching and learning process of each
lesson, student’s work, interview with the teacher and the students and field notes.
3.4.2. Reliability
The term reliability refers to the consistency of the results that are drawn based on this study. In this case, reliability is also distinguished in to two guidelines namely internal reliability and external reliability (Miles & Huberman, 1994; cited in Bakker and Van Eerde, 2013; & Bakker, 2004).
In order to improve the internal reliability of a research, there are several methods that a researcher can do. Bakker and Van Eerde (2013) pointed out that data collection by objective devices such as audio and video registrations contribute to the internal reliability of a research. Thus, in this research the researcher uses video recorder in order to make the analysis reliable internally. Furthermore, the external reliability usually refers to the replicability of the results of this study. Additionally, Bakker and Van Eerde (2013) argued that external reliability usually denotes replicability, meaning that the conclusions of the study should depend on the subjects and conditions and not on the researcher. In this case, the term replicability is commonly illuminated as virtual replicability in which a criterion of this is trackability (Gravemeijer & Cobb, 2006; Bakker & Gravemeijer, 2004; Bakker & Van Eerde, 2013; Maso & Smaling, 1998).
3.5. Data Analysis
There are different kinds of data involved in this study, such as data from interview with the teacher and the students, data from classroom observation,
students’ written work obtained from pre-test, teaching experiments, and post-test and field notes. In this session, we analyze these data by using the Hypothetical Learning Trajectory as a guideline in order to answer the research question and to draw conclusions of this study.
3.5.1. Pre-Test
Pre-test is designed in order to investigate the present relevant knowledge and to identify the starting point of the students towards the proportion which includes fractions. The result of the test is expected to uncover students’ prior knowledge, their thinking and also their errors solving proportional problems which include fractions. Therefore, the preliminary Hypothetical Learning Trajectory needs to be adjusted based on the outcomes of the pre-test so that it fits the level of students thinking and understanding.
3.5.2. Teaching Experiments
The data gathered from the students’ written works and video recording of
the whole activities during the preliminary teaching are analyzed to see the
development of students’ learning. In this case, the conjectures of students’
thinking in the Hypothetical Learning Trajectory are compared to the actual
it can be seen whether the preliminary Hypothetical Learning Trajectory can support students to develop their proportional reasoning including fractions or not based on the analyses of this cycle. As a result, the Hypothetical Learning Trajectory needs to be revised and to be improved so that it can be implemented in the next cycle.
In the next cycle, the video recordings are analyzed to investigate the moments happened during the teaching experiment. Some interesting short fragments from the video recording are selected and transcribed to show the
readers about students’ thinking and reasoning. In this case, an interesting fragment means a moment when students get the idea of the crucial parts of a
learning process. Then, these fragments and the students’ written work are
compared to the new Hypothetical Learning Trajectory which has been improved from the previous cycle. Once the researchers have achieved the goals of the HLT in the actual teaching experiment, they can stop conducting the cycles. In addition, the analysis of the cycle can be used to answer the research question and to make
conclusions about students’ development in learning about proportion. 3.5.3. Post-Test
At the end of the whole lessons, we give the students a post-test. Basically, a post-test is made to see the development of students’ understanding and the achievement from the learning activities. In this case, the post-test will have the similar questions with the pre-test. This is because the researcher wants to see the
After getting the result of the post-test, the researcher compares it to the results of the pre-test. This analysis aims to see the development of students’ thinking and understanding about the division of a whole number by a fraction. The result of analyzing post-test will produce additional results that can support the analysis of teaching experiment in order to draw conclusions of this study. 3.5.5. Validity and reliability
There are different kinds of data collected in this study, such as video
recording, students’ written work and field notes. Thus, we use data triangulation in order to analyze these different kinds of data. These various types of data collection together with the testing the HLT will contribute to the internal validity of the data analysis of this research.
In this conducting this study, we realize that making the data analysis transparent will contribute to the external reliability of this study. Therefore, it is very important to present a clear and detailed description of how we analyze the collected data so that if other researchers follow the data analysis, they will yield the same result.
4.6. Timeline of the study
Date Description research which included the plans of the research with the
Meeting III March 12th, 2014 Conducting activity III: Making cakes to sell Meeting IV March 13th, 2014 Conducting activity IV:
Proportion in unit fraction
Meeting III March 19th, 2014 Conducting activity III: Making cakes to sell Meeting IV March 20th, 2014
Conducting activity IV: Proportion in unit fraction and
CHAPTER IV
HYPOTHETICAL LEARNING TRAJECTORY
In conducting this study, we develop a hypothesis of teaching and learning process which is commonly called a Hypothetical Learning Trajectory (HLT). An HLT is a useful instrument to manage an instructional theory and a real teaching experiment (Bakker & van Eerde, 2013). In this case, Simon (1995, p.136) outlined a Hypothetical Learning Trajectory as follows:
“The Hypothetical Learning Trajectory is made up of three
components: the learning goal that defines the direction, the learning activities and the hypothetical learning process – a prediction of how
students’ thinking and understanding will evolve in the context of the learning activities”.
It has been mentioned that the aim of this research is to investigate how a
ratio table can support students’ proportional reasoning which includes fractions. In order to reach this aim, we also design instructional activities which are aimed
to introduce ratio table and to develop students’ proportional reasoning by using
ratio table. In a design based research, the Hypothetical Learning Trajectory needs to be tested (Bakker & van Eerde, 2013). This is because the results of this study are expected to give a contribution to the development of local instructional theory of proportion.
kilograms of rice will be enough for how many days if one family consumes kg of rice. Table 4.1. The overview of Hypothetical Learning Trajectory (HLT)
To be more specific, the description of the Hypothetical Learning Trajectory of this study can be seen as follows:
4.1.Activity 1 : “Solving rice problem by using student’s model” a. Learning goals
- Use the models to solve problem. b. Starting points
- Students in the fourth grade have learned about the mathematical operations, such as: addition, subtraction, multiplication and division with whole numbers.
- Students have learned about fraction and how to represent a fraction when they were in the fourth grade.
- Students have learned about how to operate fractions in the fifth grade before this topic is taught.
c. Description of the activity
Figure 4.1. Student’s worksheet 1
After that, the teacher asks students to solve the problem individually (about 10 minutes) and then discuss it in group.
When the students discuss the problem in group, the teacher can walk around to see how the students solve the problem. If there are students draw a rectangle to explain their strategy, then the teacher can make a discussion based on this answer. However, if there are no students can draw rectangle or they do not know how to represent in a picture, then the teacher can draw a box or a rectangle that represents 1 kg of rice in the white board.
d. Conjecture expectations of the students’ strategies
1. The students will apply the repeated subtraction strategy. For instance, - = - = - = - = - = - = - = - = - = - = -
= - = - = - = - = - = - = - = - = - = - = - = - = - = - = - =
So, 20 boxes of one-kilogram rice are enough for 26 days, remains .
2. The students attempt to multiply the two numbers, such as: x 20 = 15 days. 3. The students draw as a fragmented notion of collections of three things over four things. An example of this strategy can be seen in the figure below.
Figure 4.2. Student’s representation of