July-December 2011, Volume 4, No. 2, pp. 531-538
COMPARATIVE STUDY AND ANALYSIS OF AODTPRR WITH DSR,
DSDV AND AODV FOR MOBILE AD HOC NETWORK
Amit D. Kothari1, Ashok R. Patel2& Divyakant T. Meva3
Mobile Adhoc NETwork [8] is collection of wireless mobile nodes dynamically forming a temporary network without the use of existing network infrastructure of centralized administration. Each node acts as a router by itself and forwards all the packets which it receives. This concept of AODTPRR [2] is basically useful when there is a very high link failure due to migration of nodes from the available network region. There is a frequent link failure in ad hoc networks, which causes packet to be lost or packets doubts to reach destination. The mechanism used is a special propagation which propagates a unique kind of parallel route discovery [3] for real time application scenario to send the time critical data safely. The scheme used is temporary parallel route recovery builds a temporary parallel path between the nodes during link failure. The important node then forwards [1] the buffered packets to the destination without any loss which is on-demand based on type of information a node forwards. Special buffer is allocated and simulated by using a simulation tool NS-2. This extensive mode is compared with standard models performance metrics such as packet delivery ratio, average delay, routing overheads, packet forward ratio and packet drop ratio are analyzed.
Keywords:MANETS, AODTPRR, Special Propagation Mechanism, Temporary Parallel Route Request [2], Route Maintenance [11], NS-2 [10], Temporary Parallel Route Reply [2].
1Marwadi Education Foundation’ s Group of Institutions, Rajkot,
INDIA
2Hemchandracharya North Gujarat University, Patan, INDIA
3Marwadi Education Foundation’ s Group of Institutions, Rajkot,
INDIA
E-mail:1[email protected],2[email protected], 3[email protected].
1. I
NTRODUCTIONIn ad hoc network [3] when a source wants to send time critical information to a destination and found frequent route failure for it, then it generates a Temporary Parallel Route Request[2] (TPRREQ) packet and broadcasts the packet to its netighbours. The TPRREQ uses the following fields in its packet.
<Hop Count, TPRREQ ID, Destination IP Address, Destination Sequence Number, Originator IP Address, and Originator Sequence Number>
The hop count is the number of hops need the source to the node handling the TPRREQ. Thus when node receives a TPRREQ, if it is not the destination and nor does it has path to the destination it increments the hop count by 1 and rebroadcasts the packet to its neighbours. The destinations IP address of the destination and source generating the TPRREQ respectively. TPRREQ ID is a number that uniquely identifies the TPRREQ. If the TPRREQ ID in the TPRREQ packet matches the TPRREQ ID in the nodes route entry table the TPRREQ will be dropped if that node does not the final destination node. Destination sequence number is the greatest sequence number received in the past by the originator for any route towards the destination.
When the destination receives the TPRREQ packet it prepares a Temporary Parallel Route Reply (TPRREP) [2] packet increments its current destination sequence number by one and sends the TPRREP packet to the source through the nodes from which it receives the TPRREQ packets at first. The source waits for the TPRREP for a fixed interval of time and then transmits the TPRREQ again and retries for a predefined number of times. If no response is received then the source declares that the destination is unreachable. If the source gets TPRREP it preferred the two most economical paths and all the data transmitted in that routes are taken to the destination. Each and every node that is assigned a buffer so that if there is any link failure the data that is on fly without reaching destination will be stored in the buffer of the intermediate nodes.
2. E
XPERIMENTALS
ETUPWe preferred NS-2 version 2.33 software is for the model implementation. The simulations were based on 500 by 500 flat space scattered 5, 10, 20 and 40 wireless nodes. The nodes move from a random starting point to a destination with a speed ranging from 0-5 m/sec. The mobility model used is random waypoint in square field. Duration of simulation is 900 seconds. Simulation is done using the NS-2[10] simulator version 2.33 on Linux Red Hat operating system.
(1) Type – CBR.
(3) Interval between 2 CBR packets is 1 second. (4) Simulation is implemented by considering the
pause time for 5, 10, 20 and 40 nodes as 1.25, 2.50, 5, 10, 20 seconds.
(5) Maximum speed of movement is 5.0 m/s.
This extensive model is compared with standard models performance metrics such as packet delivery ratio, average delay, routing overheads, packet forward ratio and packet drop ratio.
3. P
ACKETD
ELIVERYR
ATIOPacket delivery ratio = Number of packet receives/ Number of packet sends.
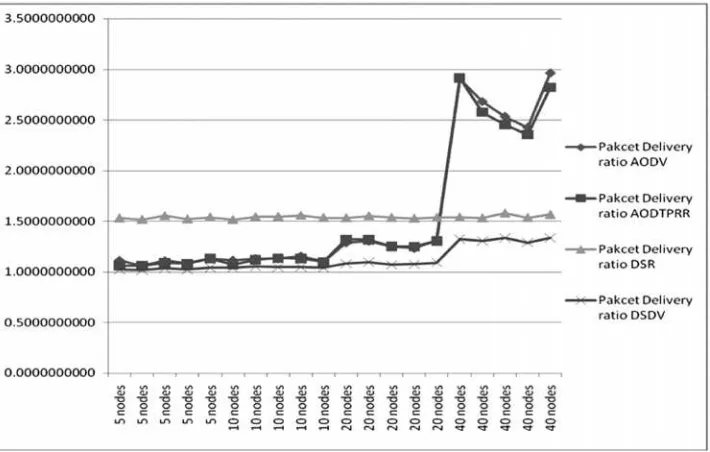
Packet delivery ratio is defined as the ratio of total number of packets receives and total number of packet sends.
In Packet Delivery Ratio from Fig.1 and Table1, 1. AODTPRR protocol gives tough competition to
AODV [4] [5] [6] for packet delivery ratio. Both the AODV and AODTPRR give good outcomes as the number of nodes are increase and reach at 40, packet delivery ratio increase as well.
2. The packet delivery ratio of AODTPRR increases as soon as the number of nodes and the pause time of node-movement are increased for those nodes. 3. DSR[7] gives the better outcomes up to 20 nodes
but as soon as the density of the nodes is increased and reaches up to 40 in the specified area the result of packet delivery ratio of AODV and AODTPRR bounce and give the best value among all four protocols.
Table 1 Packet Delivery Ratio
Packets Delivery Ratio
Nodes AODV AODTPRR DSR DSDV
5 nodes 1.1121651616 1.0598877839 1.5326800811 1.0223921721
5 nodes 1.0575330642 1.0576360852 1.5195475252 1.0178457682
5 nodes 1.1090582858 1.0902514798 1.5568796255 1.0364697497
5 nodes 1.0802306933 1.0805135443 1.5227951255 1.0225058550
5 nodes 1.1307069863 1.1307069863 1.5431754375 1.0441246499
10 nodes 1.1142165853 1.0717777688 1.5174660633 1.0391565418
10 nodes 1.1302213040 1.1173687625 1.5462443064 1.0545626029
10 nodes 1.1288479111 1.1343516377 1.5489494658 1.0469310172
10 nodes 1.1550482518 1.1302932258 1.5604263274 1.0485035749
10 nodes 1.1008183333 1.0975034102 1.5376433302 1.0397517068
20 nodes 1.2863385118 1.3203781074 1.5344815416 1.0821963412
20 nodes 1.3029181908 1.3150900435 1.5552908828 1.0961070955
20 nodes 1.2511910996 1.2493921391 1.5386386796 1.0391546124
20 nodes 1.2303845649 1.2487166053 1.5303633655 1.0767640490
20 nodes 1.3066983222 1.3047153439 1.5389859267 1.0926305607
40 nodes 2.9048500586 2.9166538305 1.5412395512 1.3250358969
40 nodes 2.6810101883 2.5774657043 1.5341150497 1.3070949839
40 nodes 2.5331032046 2.4559273784 1.5824537350 1.3357629002
40 nodes 2.4264848291 2.3556068003 1.5378872046 1.2896059021
40 nodes 2.9629893279 2.8213108657 1.5678334330 1.3364203153
4. R
OUTINGO
VERHEADSRouting overheads = Total bytes of control message transmitted / total bytes transmitted.
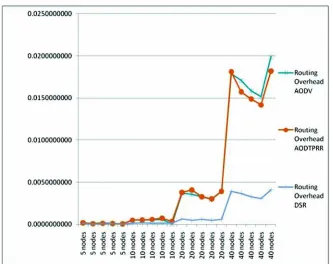
Routing overheads is a ratio of total bytes of control message transmitted against total bytes transmitted in the network.
1. In case of implementing the parallel (two) path by the intermediate nodes it requires equivalent efforts to maintain it from their side also. As soon as the number of nodes increases in the network, the chances of occurrences of route failure are increases as well. To maintain the parallel link towards the destination nodes number of AODTPRRs (Ad hoc On Demand Temporary
Ta ble 1 Contd…
Parallel Route Requests) and AODTPRRs (Ad hoc On Demand Temporary Parallel Route Replies) are increased. Result is greater number of routing overheads compared to others.
2. In case of less number of nodes there is lesser chance of establishment of two unique (parallel) paths towards the destination so we found equivalent value of routing overheads as AODV and DSR for the 0 to 10 nodes.
3. Fig.2 and Table2 shows that though applying the parallel route for transferring the data less number of control messages are send compare to AODV. So AODTPRR is scalable in the routing overhead aspect also.
Table 2 Routing Overheads
Routing Overhead
Nodes AODV AODTPRR DSR
5 nodes 0.0001808408 0.0001672940 0.0000836287
5 nodes 0.0000624503 0.0000622686 0.0000228843
5 nodes 0.0001442226 0.0001140107 0.0000612827
5 nodes 0.0000817482 0.0000817482 0.0000490130
5 nodes 0.0000379378 0.0000379378 0.0000172266
10 nodes 0.0005039188 0.0004920995 0.0001371287
10 nodes 0.0005507385 0.0005111422 0.0001847778
10 nodes 0.0005189463 0.0005827615 0.0001622533
10 nodes 0.0006013920 0.0007285729 0.0001440306
10 nodes 0.0000422590 0.0003349090 0.0001445826
20 nodes 0.0036988852 0.0037897383 0.0006569951
20 nodes 0.0035814014 0.0040903323 0.0004952375
20 nodes 0.0032587655 0.0032727315 0.0006277798
20 nodes 0.0029728359 0.0030134326 0.0004978118
20 nodes 0.0039389972 0.0039240926 0.0006142703
40 nodes 0.0178645650 0.0181073492 0.0039037120
40 nodes 0.0170931829 0.0157121351 0.0036887046
40 nodes 0.0158534803 0.0148828618 0.0032947363
40 nodes 0.0151488712 0.0141755017 0.0030950971
40 nodes 0.0198818459 0.0181927345 0.0040945514
5. A
VERAGED
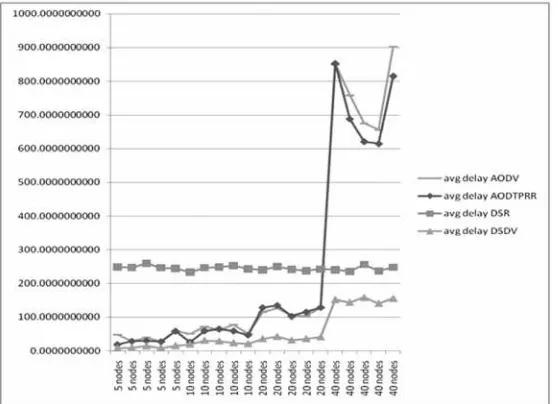
ELAYAverage delay = (Σ Packet receive time - Σ Packet send time) / Total packets transmitted
1. The average delay value of AODTPRR found lesser than AODV and DSR up to 20 nodes exist in the network as per Fig.3 and Table3.
2. As soon as the strength of nodes reaches at 40 the average delay is rises instantly but it remains lesser than AODV’ s average delay value for the 40 nodes. 3. If there is greater value of pause for node
movements, route failure will not occur frequently. Due to less occurrence of the route failure, parallel
route implementation strategy is not followed and AODTPRR gives the result equals to AODV for 5, 10, 20 and 40 nodes with maximum pause value i.e. 5 seconds (in our case) respectively.
4. If the pause time value is lesser means greater number of movement and the nodes of the ad hoc
network are not stable. So greater route failures can occur. In such case from fig3 AODTPRR offers the faster service than AODV and takes less delay time to send the packet successfully. It shows that as the node movement is high AODTPRR performs well.
Table 3 Average Delay
Average Delay
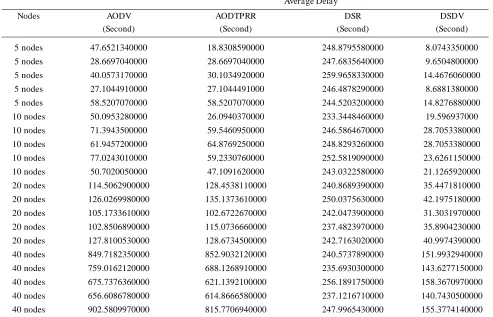
Nodes AODV AODTPRR DSR DSDV
(Second) (Second) (Second) (Second)
5 nodes 47.6521340000 18.8308590000 248.8795580000 8.0743350000
5 nodes 28.6697040000 28.6697040000 247.6835640000 9.6504800000
5 nodes 40.0573170000 30.1034920000 259.9658330000 14.4676060000
5 nodes 27.1044910000 27.1044491000 246.4878290000 8.6881380000
5 nodes 58.5207070000 58.5207070000 244.5203200000 14.8276880000
10 nodes 50.0953280000 26.0940370000 233.3448460000 19.596937000
10 nodes 71.3943500000 59.5460950000 246.5864670000 28.7053380000
10 nodes 61.9457200000 64.8769250000 248.8293260000 28.7053380000
10 nodes 77.0243010000 59.2330760000 252.5819090000 23.6261150000
10 nodes 50.7020050000 47.1091620000 243.0322580000 21.1265920000
20 nodes 114.5062900000 128.4538110000 240.8689390000 35.4471810000
20 nodes 126.0269980000 135.1373610000 250.0375630000 42.1975180000
20 nodes 105.1733610000 102.6722670000 242.0473900000 31.3031970000
20 nodes 102.8506890000 115.0736660000 237.4823970000 35.8904230000
20 nodes 127.8100530000 128.6734500000 242.7163020000 40.9974390000
40 nodes 849.7182350000 852.9032120000 240.5737890000 151.9932940000
40 nodes 759.0162120000 688.1268910000 235.6930300000 143.6277150000
40 nodes 675.7376360000 621.1392100000 256.1891750000 158.3670970000
40 nodes 656.6086780000 614.8666580000 237.1216710000 140.7430500000
40 nodes 902.5809970000 815.7706940000 247.9965430000 155.3774140000
6. P
ACKETD
ROPR
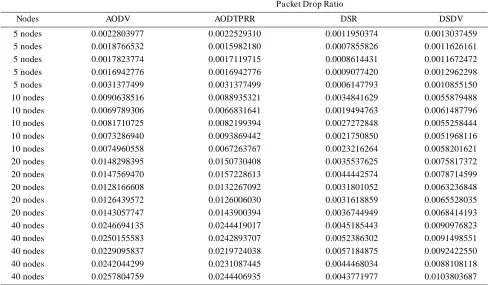
ATIOPacket Drop Ratio = Total Number of Packet Drop/Total Number of Packet Sent.
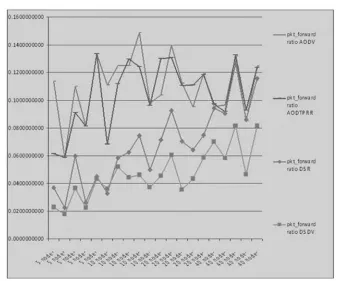
1. The graph of packet drop ratio in Fig.4 and Table 4 is increase gradually as the number of nodes increase in the ad hoc network.
2. In AODTPRR, as the number of nodes are increasing in the ad hoc network, due to their random movement in the network greater number of route failure will occurred compared to less number of nodes exist in the network. To resolve the route failure parallel route recovery procedure started. Intermediate node broadcast the Parallel Route Recovery Request (to establish two paths towards the destination) in the network, and the request propagates in the network for establishing
the parallel path (two links) from the intermediate node to destination node. The node which has a link toward the destination node replies to the node from where the parallel route request was generated. The best two paths are preferred among all the available options for further communication. Once the parallel route is established, to maintain the parallel (i.e. two) routes require greater efforts and more number of Parallel Route Requests and Parallel Route Replies are generated in the network. So greater numbers of duplicates packets are received by the nodes in the network due to broadcasting and greater number of packet are dropped compared to DSR and DSDV protocols. 1. The graph of packet drop ratio is increase gradually
Table 4 Packet Drop Ratio
Pa cket Drop Ratio
Nodes AODV AODTPRR DSR DSDV
5 nodes 0.0022803977 0.0022529310 0.0011950374 0.0013037459
5 nodes 0.0018766532 0.0015982180 0.0007855826 0.0011626161
5 nodes 0.0017823774 0.0017119715 0.0008614431 0.0011672472
5 nodes 0.0016942776 0.0016942776 0.0009077420 0.0012962298
5 nodes 0.0031377499 0.0031377499 0.0006147793 0.0010855150
10 nodes 0.0090638516 0.0088935321 0.0034841629 0.0055879488
10 nodes 0.0069789306 0.0066831641 0.0019494763 0.0061487796
10 nodes 0.0081710725 0.0082199394 0.0027272848 0.0055258444
10 nodes 0.0073286940 0.0093869442 0.0021750850 0.0051968116
10 nodes 0.0074960558 0.0067263767 0.0023216264 0.0058201621
20 nodes 0.0148298395 0.0150730408 0.0035537625 0.0075817372
20 nodes 0.0147569470 0.0157228613 0.0044442574 0.0078714599
20 nodes 0.0128166608 0.0132267092 0.0031801052 0.0063236848
20 nodes 0.0126439572 0.0126006030 0.0031618859 0.0065528035
20 nodes 0.0143057747 0.0143900394 0.0036744949 0.0068414193
40 nodes 0.0246694135 0.0244419017 0.0045185443 0.0090976823
40 nodes 0.0250155583 0.0242893707 0.0052386302 0.0091498551
40 nodes 0.0229095837 0.0219724038 0.0057184875 0.0092422550
40 nodes 0.0242044299 0.0231087445 0.0044468034 0.0088108118
40 nodes 0.0257804759 0.0244406935 0.0043771977 0.0103803687
Fig.4: Comparison of Packet Drop Ratio
2. To resolve the route failure parallel route recovery procedure started. Intermediate node broadcast the Parallel Route Recovery Request (to establish two paths towards the destination) in the network, and the request propagates in the network for establishing the parallel path (two links) from the
Once the parallel route is established, to maintain the parallel (i.e. two) routes require greater efforts and more number of Parallel Route Requests and Parallel Route Replies are generated in the network. So greater numbers of duplicates packets are received by the nodes in the network due to broadcasting and greater number of packet are dropped compared to DSR and DSDV protocols.
7. P
ACKETF
ORWARDR
ATIOPacket Forward Ratio = Total Number of Packet Forward / Total Number of Packet Sent
1. Compare to other protocols (i.e. AODV, DSDV and DSR) AODTPRR is more supportive nature wise. 2. As soon as the numbers of nodes increases in the
network (see Fig.5 and Table5) major numbers of supports are achieved by the intermediate node in the form of establishments of parallel path, result
more number of packets are forwarded in the dense network.
3. To handle parallel links towards the destination greater number of Parallel Route Requests and Parallel Route Replies are generated and forwarded, result is greater value of packet forward ratio.
4. We can see from the graph in fig5 AODTPRR performed better than DSDV and DSR in all the cases.
5. The performances of AODTPRR is increasing gradually and performed best among all protocols (i.e. AODV, DSDV, DSR and AODTPRR) as the number of nodes rises and reach up to 40 nodes. 6. We can conclude AODTPRR gives greater support
in terms of forwarding the packets towards the destination.
Table 5 Packet Forward Ratio
Packet Forward Ratio
Nodes AODV AODTPRR DSR DSDV
5 nodes 0.1137736021 0.0612452825 0.0366897463 0.0226986196
5 nodes 0.0586913546 0.0586913546 0.0226522617 0.0177654985
5 nodes 0.1098557435 0.0912260746 0.0596129466 0.0363917540
5 nodes 0.0813564404 0.0813564404 0.0261650856 0.0224542124
5 nodes 0.1335069614 0.1335069614 0.0449582975 0.0433770782
10 nodes 0.1109532543 0.0683033980 0.0326847662 0.0361120555
10 nodes 0.1250136307 0.1117678806 0.0584974077 0.0520040853
10 nodes 0.1250224036 0.1295260462 0.0625580872 0.0444232529
10 nodes 0.1488258329 0.1240139642 0.0742264502 0.0459244165
10 nodes 0.0978354930 0.0961337860 0.0498621454 0.0371908355
20 nodes 0.1037974972 0.1299207905 0.0713630268 0.0454420980
20 nodes 0.1396436679 0.1305408522 0.0923558212 0.0602506836
20 nodes 0.1121078671 0.1106650916 0.0704089738 0.0356214673
20 nodes 0.0951743114 0.1109488675 0.0642061285 0.0433882609
20 nodes 0.1191510923 0.1183407487 0.0747856545 0.0586733666
40 nodes 0.0954612102 0.0973797709 0.0941401376 0.0698640343
40 nodes 0.0966815320 0.0919301762 0.0905471087 0.0582418628
40 nodes 0.1318278436 0.1325490196 0.1264219318 0.0814695071
40 nodes 0.0849868692 0.0929507258 0.0860980332 0.0463232640
40 nodes 0.1245031265 0.1235709790 0.1157681252 0.0813887893
R
EFERENCES[1] Amit D. Kothari, Dharmendra T. Patel. “Methodology to Solve the Count-To-Infinity Problem by Accepting and Forwarding Correct and Updated Information Only Using “Test” Packet”, 2009, IEEE International Advance Computing Conference (IACC 2009)P atiala, India, 6-7 March 2009.
[2] Amit D. Kothari, Dr. Ashok R. Patel. “On Demand Temporary Parallel Route Recovery for Frequent Link Failure in Adhoc Networks”, International Journa l of Computer Applications, (0975 – 8887) 11– No.11, December 2010.
[3] Andrew S. Tanenbaum: “Computer Networks, Third Edition, Prentice Hall of India Private Limited”, 2000.
[4] Charles E. Perkins, Elizabeth M. BeldingRoyer, and Samir Das. “Ad Hoc On Demand Distance Vector (AODV) Routing”, IETF Internet Draft, Draft-ietfmaneta odv-10.txt, March 2002 (work in progress).
[5] C. Perkins, E. Belding-Royer, and S. Das, “Ad hoc On-Demand Distance Vector routing,” RFC 3561, July2003.
[6] C. E. Perkins and P. Bhagwat, “Highly Dynamic Destination-Sequenced Distance-vector Routing (dsdv) for Mobile Computers”, in ACM Sigcomm, London, UK, 31 August -2 September 1994.
[7] D. Johnson, Y. Hu, and D. Maltz, “The Dynamic Source Routing Protocol (DSR) for Mobile Ad Hoc Networks for IPv4”, RFC 4728, February 2007.
[8] Levente Buttyan, Jeen-Pierre Hubaux “Simulating Cooperation in Adhoc Wireless Network Mobile Network and Applications”, October 2003, 8.
[9] L. Buttyan and J.P.Hubaux, “Stimulating Cooperation in Self-Organizing Mobile Adhoc Networks”, Technical Report No.DSC/2001/046, August 2001.
[10] NS-2 manuals - http://www.isi.edu/nsnam/ns/
[11] Shih-Lin Wu, Sze-yaoNi,Yu-Chee Tseng, and Jang-Ping Sheu “Route Maintenance in a Wireless Mobile Ad Hoc Network”, Proceeding of the 33rd Ha wa ii Interna tiona l Conference on System Sciences-2000.