SPATIAL VARIABILITY OF SOIL NUTRIENTS USING GEOSPATIAL TECHNIQUES: A CASE STUDY
IN SOILS OF SANWER TEHSIL OF INDORE DISTRICT OF MADHYA PRADESH
G.S. Tagore
a, G.D. Bairagi*
b, R. Sharma
band P. K. Verma
ba
Department of Soil Science and Agril. Chemistry, JNKVV, Jabalpur (M.P.)
b
M. P. Council of Science and Technology, Vigyan Bhawan, Bhopal (M.P.)
KEY WORDS: Spatial Variability, Soil Properties, semi -variogram, Sanwer, Kriging, GPS
ABSTRACT:
A study was conducted to explore the spatial variability of major soil nutrients in a soybean grown region of Malwa plateau. From the study area, one hundred sixty two surface soil samples were collected by a random sampling strategy using GPS. Then soil physico-chemical properties i.e., pH, EC, organic carbon, soil available nutrients (N, P, K, S and Zn) were measured in laboratory. After data normalization, classical and geo-statistical analyses were used to describe soil properties and spatial correlation of soil characteristics. Spatial variability of soil physico-chemical properties was quantified through semi-variogram analysis and the respective surface maps were prepared through ordinary Kriging. Exponential model fits well with experimental semi-variogram of pH, EC, OC, available N, P, K, S and Zn. pH, EC, OC, N, P, and K has displayed moderate spatial dependence whereas S and Zn showed weak spatial dependence. Cross validation of kriged map shows that spatial prediction of soil nutrients using semi-variogram parameters is better than assuming mean of observed value for any un-sampled location. Therefore it is a suitable alternative method for accurate estimation of chemical properties of soil in un-sampled positions as compared to direct measurement which has time and costs concerned.
1. INTRODUCTION
Soil macronutrients are essential to plants growth; maintain ecosystems and high crop yields. However, imbalance fertilization, deteriorate the precious soil environment particularly N and P can be potentially hazardous to water resources when their available components in soils are excessive, because available macronutrients can be transported off site in runoff due to rain or irrigation (Smith et al., 1998, Phupaibul et al., 2004 and Ju et al., 2007) and subsequently degrades the fertility of soil and reduced the productivity.
Several studies have documented that soil properties vary across agricultural fields, causing spatial variability in crop yields. Therefore, their proper management is necessary to avoid deteriorating the environment while meeting the requirement of high crop productivity and farmer must be advised to use balanced of fertilizers/manures, special soil
amendment (if any) and accordingly adopt suitable cropping pattern. Hence it is necessary to evaluate the fertility status of the soil and promote the recommendations of soil test for balanced nutrition to maintain soil health. The application of parametric statistics is inadequate for analysis of spatially dependant variables because, they assume that measured observations are independent in spite of their distribution in space. Now days, Geographic information systems (GIS), as new technology, and Geo-statistics provide a tool for improving sampling design by utilizing the spatial dependence of soil properties within a sampling region and useful to illustrate the spatial interrelationship of soil data which reduces error, biasness and increase the accuracy of data for interpolation. Therefore, the present study has been planned to quantify the spatial variability of soils in Sanwer of Indore district of M.P.
2. MATERIALS AND METHODS 2.1 Study Area
Geographically, the Sanwer is located between 22°55’48.90” N latitudes and 75°51’10.80”E longitudes in Indore district, M.P having temperature range of 25°C to 44°C in summer and 10°C to 31°C in winter. The total area of the block is 694 sq km. Based on soil taxonomy (USDA, 2010), this region has Vertisols and associated soil orders. These soils are montmorillonitic, neutral to slight alkaline and having high swell shrink potential.
Soybean (Glycine max is an important oilseed grown as rain fed crop (80% area) during kharif season in the semi-arid Malwa region of Madhya Pradesh. The farmers usually apply a lower dose of fertilizer for soybean in study area impose the assessment and delineation of the extent of nutrients status and their variability in soils of Sanwer tehsil, so that a picture regarding depletion and build up may be obtained. *Corresponding author:[email protected]
2.2 Soil sampling and their chemical analysis
In the present study, one hundred sixty two topsoil samples were collected from soybean-wheat cropping system in 2011-12. The sampling scheme considered the distributional uniformity of samples and also ensured that all samples were located in soybean-wheat fields (Figure-1). All samples were taken in fall after harvest and before next cropping season to avoid the effect of fertilization during crop cultivation. For each soil sample, soils at 6– 8 points within a small area of approximately 0.01 ha were collected from surface layers (0–15 cm) and then mixed and delivered to a laboratory for analysis. Exact sample locations were recorded using a hand-held global position system. All samples were air-dried at room temperature (20–22∘C), ground using wooden mortar and pestle, and sieved into soil particles less than 2 mm.
Soil pH was measured using a pH meter (Systronic pH meter) with a soil/water ratio of 1: 2.5 (Jackson, 1973) Electrical conductivity was determined in 1:2.5 soil: water supernatant solution with the help of conductivity -bridge (Jackson, 1973). Soil organic carbon was estimated using the Walkley and Black wet oxidation method (Jackson, 1973). Available nitrogen was estimated by alkaline permanganate
method (Subbiah and Asija, 1956). The available Phosphorus was estimated by 0.5 M sodium bicarbonate method as described by (Olsen et al., 1954) and the P concentration was quantified using spectrophotometer. Available Potassium was extracted with Neutral 1 N ammonium acetate as described by Jackson (1973) and determined by flame photometer. Available S (AS) was extracted using 0.15% CaCl2 and then determined
by the turbidimetric method Chesnin and Yien (1951). Available Fe, Available Mn, Available Cu, and Available Zn were extracted with diethylenetriaminepentaacetic acid (DTPA), and the extracted Fe, Mn, Cu, and Zn were determined with flame atomic absorption spectrometry by Lindsay and Norvell. (1978).
The nutrient index (NI) values for available nutrients present in the soils were calculated utilizing the formula suggested by Parker et al. (1951) and classified this index as low (<1.67), medium (1.67 to 2.33) and high (>2.33).
NI= [(Nl x 1) + (Nm x 2) + (Nh x 3)]/Nt,
Where: N1, Nm and Nh are the number of soil samples falling in low, medium and high categories for nutrient status and are given weightage of 1, 2 and 3, respectively. Nt is the total
number of samples.
2.3 Geo-statistical analysis
The presence of a spatial structure where observations close to each other are more alike than those that are far apart (spatial autocorrelation) is a prerequisite to the application of geo-statistics. The experimental variogram measures the average degree of dissimilarity between unsampled values and a nearby data value (Deutsch and Journel, 1998) and thus can depict autocorrelation at various distances. The value of the experimental variogram for a separation distance of h (referred to as the lag) is half the average squared difference between the value at z(xi) and the
value at z(xi+h) (Lark, 2000; Robinson and Metternicht, 2006):
Where: N (h) is the number of data pairs within a given class of distance and direction. If the values at z(xi) and
z(xi+h) are auto correlated the result of Eq.(1) will be small,
relative to an uncorrelated pair of points. From analysis of the experimental variogram, a suitable model is then fitted, usually by weighted least squares, and the parameters (e.g. range, nugget and sill) are then used in the Kriging procedure.
3. RESULTS AND DISCUSSIONS
3.1Descriptive Statistics of Soil Properties
The mean values for pH, EC, OC content were 7.57, 0.45 dSm-1 and 6.99 g kg-1 with a range of 6.53-8.52, 0.08 to 1.24 dS m-1 available micronutrients Zn, Cu, Fe and Mn varied from 0.17 to 1.58, 0.62 to 7.8, 1.96 to 14.76 and 1.06 to 20.92 mg kg-1 with mean values of 0.68, 3.01, 6.84 and 10.14 mg kg-1.
normally distributed due to higher value of skewness and kurtosis.
Table-1 Statistical overview for physico-chemical properties of soils of study area (N=162)
Parameters Range Minimum Maximum Mean S.D. Skewness Kurtosis CV%
pH 1.99 6.53 8.52 7.57 0.48 -0.57 -0.38 6.37
EC dSm-1 1.16 0.08 1.24 0.45 0.31 1.01 -0.14 68.89
lnEC dSm-1 2.735 -2.52 0.215 -1.031 0.689 0.03 2.15 -66.83
OC gkg-1 7.35 2.6 9.95 6.99 1.65 -0.44 0.06 23.58
Avail. N kg ha-1 225.68 167.98 393.66 273.78 55.46 0.07 -0.68 20.26
Avail. P kg ha-1 31.55 7.77 39.32 19.38 8.61 0.85 -0.21 44.43
ln Avail. P kg ha-1 1.62 2.05 3.67 2.87 0.43 0.171 2.13 14.98
Avail. K kg ha-1 747.04 104.56 851.6 461.35 197.12 0.03 -0.98 42.73
S mgkg-1 14 6 20 10.8 3.4 0.55 -0.51 31.44
ln S mgkg-1 1.20 1.79 2.99 2.33 0.32 0.05 2.05 13.65
Zn mgkg-1 1.41 0.17 1.58 0.68 0.34 0.71 -0.39 49.59
ln Zn mgkg-1 2.227 -1.77 0.457 -0.51 0.515 -0.197 2.4 -100.98
Cu mgkg-1 7.18 0.62 7.8 3.01 1.86
0.87 -0.17 61.81
ln Cu mgkg-1 2.52 -0.47 2.05 0.907 0.643 -0.103 2.12 70.89
Fe mgkg-1 12.8 1.96 14.76 6.84 2.61 0.6 0.16 38.13
ln Fe mgkg-1 2.016 0.674 2.69 1.84 0.398 -0.339 2.77 21.63
Mn mgkg-1 19.85 1.06 20.92 10.14 4.61 0.17 -0.46 45.49
3.2Soil fertility status using classical statistics
On the basis of the ratings suggested by Subbiah and Asija (1956), 37.65 per cent samples were found to be low while 62.3 were medium and none of samples were high. On the basis of the limits suggested by Muhr et al. (1963), only 9.26 per cent soil samples were found low, 56.2 were found in medium and rest of high (<20 P2 O5 kg ha-1). This might be due to the
presence of phosphorus in organic forms and after
decomposition of organic matter as humus is formed which forms complex with Al and Fe and that is a protective cover for P fixation with Al and Fe thus reduce phosphorus adsorption/ Phosphate fixation (Tisdale et al. 1997). According to Muhr et al. (1963) 16.67 samples were low, 25.3 percent samples were found in medium and remaining (58.0) were high in potassium content.
The limits of micronutrients (mg kg-1) were used for various categories (low, medium and high) as suggested by (Singh et. al., 2007) are given as under:
Micronutrients Low Medium High
Zn <0.6 0.6-1.2 >1.2
Cu <0.2 0.2-0.4 > 0.4
Fe < 4.5 4.5-9.0 >9.0
Mn <2.0 2.0-4.0 >4.0
B <0.1 0.1-0.60 >0.60
N.I. <1.67 1.67-2.33 >2.33
Result revealed the soils were low in organic carbon content and for these soils available micronutrients status using 0.6, 0.2 and 4.5 mg kg-1 soil as the critical limit for DTPA-extractable for Zn, Cu, and Fe (Follet and Lindsay 1970) 51.85 percent soil samples were found to be deficient in available Zn. The data from the table showed the 1.0 mg kg-1 and 0.2 mg kg-1 soil as the critical limit for DTPA-extractable Mn and Cu respectively (Follet and Lindsay 1970), none of the soils samples were tested low in Mn and Cu content respectively. All soil samples found in sufficient quantity of available Cu content. Similar reported by Mehra et al. (2005). Considering 10 mg kg-1 as the thresh hold value (Balanagoudar &
Satyanarayan, 1990), 45.68 and 54.3 percent samples were found to be deficient and sufficient respectively in Sanwer tehsil. Results are supported by Rathore et al. (1995).
Table 2 Percent sample deficiency and NI generated using classical statistics of (N=162) Nutrients
parameters
Percent samples under different categories NI NI class
LOW MEDIUM HIGH
OC 11.73 35.2 53.1 2.23 Medium
Available macronutrients
N 37.65 62.3 0.0 1.62 Low
P 9.26 56.2 34.6 2.25 Medium
K 16.67 25.3 58.0 2.41 High
Secondary nutrient (S) 45.68 0.0 54.3 1.54 Low
Micronutrients Zn 51.85 38.3 9.9 1.58 Low
Cu 0 0.0 100.0 3.00 High
Fe 22.22 57.4 20.4 1.98 Medium
Mn 0 10.5 89.5 2.90 High
3.3 Relationship with micronutrients
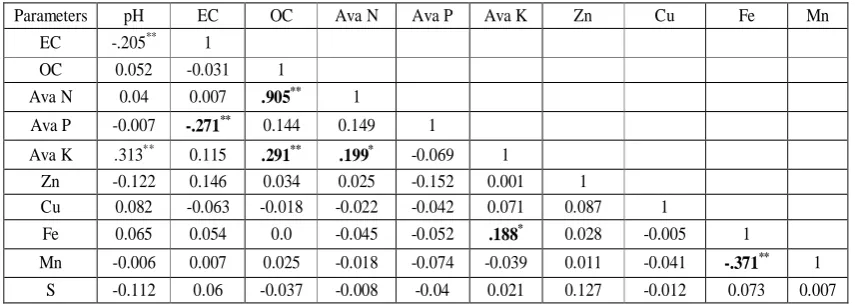
Correlation studies showed the significant positive correlation between organic carbon and available N, K were found with having values of r=0.91 and r= 0.29 respectively. The
relationship between availability of N, Fe with available K
showing value r=.199* r =0.188* also exist.
Table 3 Pearson’s correlation coefficients between major, S, micronutrients and other soil properties
Parameters pH EC OC Ava N Ava P Ava K Zn Cu Fe Mn
EC -.205** 1
OC 0.052 -0.031 1
Ava N 0.04 0.007 .905** 1
Ava P -0.007 -.271** 0.144 0.149 1
Ava K .313** 0.115 .291** .199* -0.069 1
Zn -0.122 0.146 0.034 0.025 -0.152 0.001 1
Cu 0.082 -0.063 -0.018 -0.022 -0.042 0.071 0.087 1
Fe 0.065 0.054 0.0 -0.045 -0.052 .188* 0.028 -0.005 1
Mn -0.006 0.007 0.025 -0.018 -0.074 -0.039 0.011 -0.041 -.371** 1
S -0.112 0.06 -0.037 -0.008 -0.04 0.021 0.127 -0.012 0.073 0.007
**. Correlation is significant at the 0.01 level (2-tailed). *. Correlation is significant at the 0.05 level (2-tailed).
The relationship between available Mn and Fe were found to be negative and statistically significant, (r=-0.371**), Correlation between EC and pH, available P were found
negative significant (r=-0.205**) and (r=-0.271**) whereas available K and pH were found positive and significant, (r=0.313**).
3.4 Spatial variability
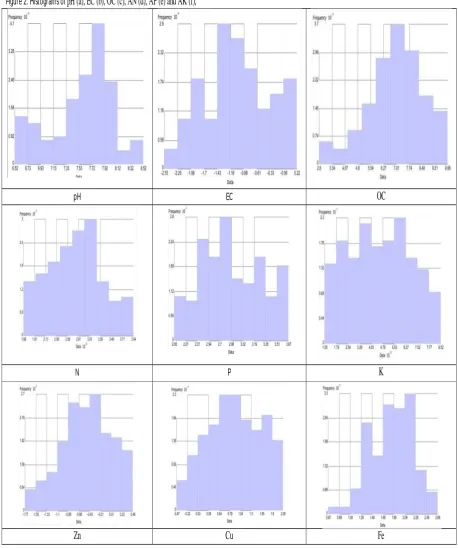
Geo-statistical methods were used to analyze the spatial correlation structures of the available contents of N, P, K and S and micronutrients in soil and spatially estimate their values at unsampled locations. Because Kriging assumes the normal distribution for each estimated variable, it is necessary to check whether the available contents of N, P, K and S and micronutrients in soil samples are approximately normally distributed or not. The first step in using of Kriging methods is to check the presence of spatial structure among data by variogram analysis. The distribution of data should be normal for the parameter estimation, and the K-S test was used to examine the distribution of the data. From Table 1, one can see that the skewness and kurtosis indices of all the soil properties are close to the standard value of 0, but those of S, EC, and Zn are not. In this study, natural logarithmic transformation was used to reduce the skewness of the data distributions of P and K. The histograms of N, P, and K
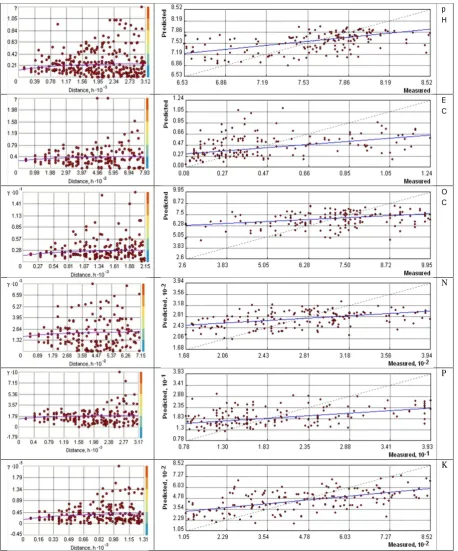
In this study, no apparent anisotropy was found for any studied variable through experimental variograms. So, all experimental variograms were in isotropic form and were fitted using basic math models, such as Spherical, exponential, Gaussian and linear based on the values of weighted residual sums of squares, regression coefficient (r²) and relative spatial structure indicator (Nugget/Sill) that indicated spatial dependency for Kriging interpolation. The ratio of nugget variance to sill expressed in percentages (C0/C+C0) can be regarded as a criterion for
classifying the spatial dependence of the soil parameters. If this ratio is less than 25%, then the variable has strong spatial dependence (Shi et al., 2005). The pH, EC, OC, N, P, K, Zn and Cu showed the values between 25% and 75% considered as moderate spatial dependence, and the values greater than 75% have weak spatial dependence as shown in table, S Fe and Mn have moderate spatial structure. A filled contour map (prediction map) and a relevant prediction standard error map were created for soil properties using the ArcGIS Geo-statistics tool.
Experimental variograms and fitted models for are presented in
Figure 3. Exponential models are chosen for pH, EC, OC, AN,
ln (AP), K, (Zn), ln(Cu), and ln(Fe) and spherical models for Mn. The nugget/sill ratios of variogram models for pH, EC, OC, N, P, K, Zn and Cu all fall between 25% and 75%, which exhibit moderate spatial dependency. Usually, a strong spatial dependence of soil properties can be attributed to intrinsic factors, and a weak spatial dependence can be attributed to extrinsic factors (Cambardella et al., 1994). The correlation range measures the spatial separate distances within which data are auto correlated (Cahn et al., 1994). The approximate correlation ranges for pH, EC, OC, AN, ln(AP), K,S, (Zn), ln(Cu), ln (Fe) and Mn are 3.112 km, 0.783 km, 2.14 km, 0.706 km, 3.13 km, 1.29 km, 16.57 km, 4.74 km, 1.53 km, 14.64 km, and 0.602 km, respectively. Apparently, pH, OC, AK, S, (Zn), ln(Cu) and ln(Fe) are auto correlated in longer ranges than AN, EC, and Mn are. This result is consistent with their CV values. This may imply that AP, and AK contents are more sensitive to extrinsic factors such as fertilization. To map the spatial distributions of pH, EC, OC, AN, ln (AP), K,S, (Zn), ln(Cu), ln(Fe) and Mn, we used ordinary Kriging to interpolate their respective sample data (Figure 4).
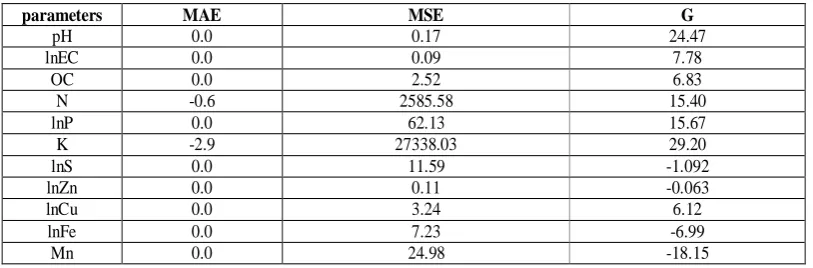
Table 4 Characteristic of calculated semivariogram of spatial soil fertility using ordinary Kriging
Soil property Squared Error (MSE) was observed for K followed by N, P, Mn ,S, Fe,Cu, OC, pH, Zn and EC. The goodness of fit (G) values was positive and highest G value was observed for K followed
by pH. Lower MSE value was observed for organic carbon, EC and pH and Zn. Higher G value was observed for pH compared to EC N, P organic carbon and Cu. The G values for S, Zn, Fe and Mn were negative. Higher G values were observed for available N, P compared to EC, OC and available Cu. Table-5 Evaluation performance of Krigged map of soil properties through cross-validation
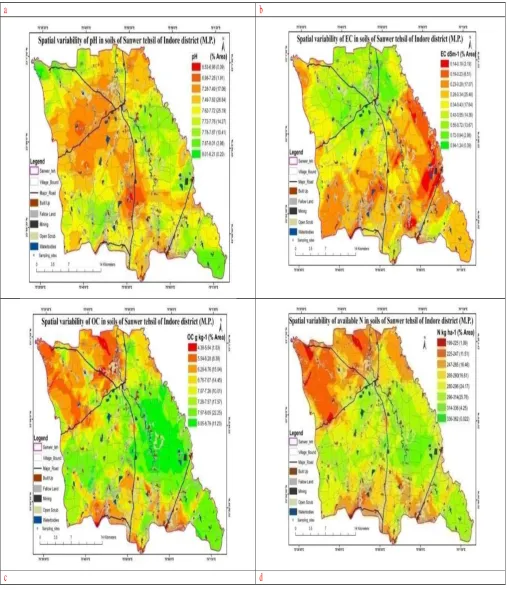
Among the two different theoretical models tested, the exponential model was found best fit for soil properties including pH, EC, OC, N, P, K, S, Zn, Cu and Fe whereas, spherical model was found as the best fit for Mn. In order to identify the spatial distribution patterns of soil properties in the surveyed area, it is necessary to present soil properties data in
the form of a map. For this purpose, spatial distribution maps of all fertility parameters in soil obtained by ordinary Kriging based on exponential model for surface (0 – 15cm) soil in Sanwer tehsil are presented in figure 3. The results also supported by Reza et al., 2010.
4.0CONCLUSIONS
Spatial variability of soil fertility was quantified through semivariogram analysis and interpolated through ordinary Kriging using best fit exponential model. Based on prediction and error maps, it was realized that all soil nutrients has no toxic status and that the application of fertilizer will
improve crop yields in the study area. Cross validation of kriged maps shows spatial prediction of soil properties with reasonable accuracy. It was concluded that geo-statistical techniques are applicable to investigate the spatial variability of soil properties in the study area.
REFERENCE
Cahn M. D., J. W. Hummel, and Brouer, B. H. 1994.Spatial analysis of soil fertility for site-specific crop management. Soil Science Society of America Journal, 58, (4), pp. 1240–1248. Cambardella, C.A., Moorman, T.B., Novak, J.M., Parkin, T.B., Karlen, D.L., Turco, R.F. and Konopka, A.E., 1994. Field scale variability of soil properties in Central Iowa soils. Soil Science Society of America Journal, 58, 1501–1511.
Follet. R. H. and Lindsay, W.L. 1970. Profile distribution of Zn, Cu, Fe and Mn in Colorado State University Experimental Station. Fort Collin Co. Technical Bulletin 110.
Goovaerts, P. 1997. Geo-statistics for Natural Resources Evaluation, Oxford University Press, New York, NY, USA. Hillel, D. (1980). Fundamentals of Soil Physics. Academic Press, Inc., New York
Ju X. T., C. L. Kou, P. Christie, Z. X. Dou, and F. S. Zhang, 2007.Changes in the soil environment from excessive application of fertilizers and manures to two contrasting intensive cropping systems on the North China Plain. Environmental Pollution, vol. 145 (2), pp. 497–506.
Lindsay, W.L and W.A. Norvell. 1978. Development of a DTPA soil test for Zn, Fe, Mn and Cu. Soil Sci. Soc. Am. J. 42: 421-428.
Muhr G.R., Datta N.P., Shankara Subraney N., Dever F., Lecy V.K. and Donahue R.R., 1963. Soil Testing in India. USAID Mission to India.
Parker, F,W., Nelson, W.L.. Winter Eric and Miller, L.E. 1951. The broad interpretation of soil test informations. Agronomy Journal 43, 105-112.
Phupaibul, P., C. Chitbuntanorm, N. Chinoim, P.
Kangyawongha, and T. Matoh, 2004.Phosphorus accumulation in soils and nitrate contamination in underground water under exportoriented asparagus farming in Nong Ngu Lauem Village, Nakhon Pathom Province, Thailand. Soil Science and Plant Nutrition, 50(3), pp. 385–393.
Reza, S.K., Sarkar, D., Baruah, U. and Das, T.H., 2010. Evaluation and comparison of ordinary Kriging and inverse distance weighing methods for prediction of spatial variability of some chemical parameters of Dhalai district, Tripura. on Soil, Plant and Water Analysis. Westville Publishing House, New Delhi.
Smith V. H., G. D. Tilman, and J. C. Nekola 1998. Eutrophication: impacts of excess nutrient inputs on freshwater, marine, and terrestrial ecosystems. Environmental Pollution, 100 (1– 3), pp. 179–196.
Subbiah, B. V. and Asija G. L. 1956. A rapid procedure for the determination of available nitrogen in soils. Curr. Sci., 25: 259-260.
Figure 2: Histograms of
pH (a), EC (b), OC (c), AN (d), AP (e) and AK (f),
pH
EC
OC
N
P
K
Figure 3: Variogram s of pH (a), EC (b), OC (c), AN (d), AP (e) and AK (f)
p H
E C
O C
N
P