FOREST AREA DERIVATION FROM SENTINEL-1 DATA
Dostálová Alena a*, Hollaus M arkus a, M ilenković M ilutin a and Wagner Wolfgang a
a
Department of Geodesy and Geoinformation, TU Wien, 1040 Vienna, Austria - (alena.dostalova, markus.hollaus, milutin.milenkovic, wolfgang.wagner)@geo.tuwien.ac.at
ThS 3
KEY WORDS : Classifications, time series, SAR, forest area, full-waveform ALS, LiDAR
ABS TRACT:
The recently launched Sentinel-1A provides the high resolution Synthetic Aperture Radar (SAR) data with very high temporal coverage over large parts of European continent. Short revisit time and dual polarization availability supports its usability for forestry applications. The following study presents an analysis of the potential of the multi-temporal dual-polarization Sentinel-1A data for the forest area derivation using the standard methods based on Otsu thresholding and K -means clustering. Sentinel-1 data collected in winter season 2014-2015 over a test area in eastern Austria were used to derive forest area mask with spatial resolution of 10m and minimum mapping unit of 500m2. The validation with reference forest mask derived from airborne full-waveform laser scanning data revealed overall accuracy of 92% and kappa statistics of 0.81. Even better results can be achieved when using external mask for urban areas, which might be misclassified as forests when using the introduced approach based on SAR data only. The Sentinel-1 data and the described methods are well suited for forest change detection between consecutive years.
* Corresponding author
1. INTRODUCTION
Since 1991 radar data are available on a continuous basis from different sensors (e.g. ERS-1, ERS-2, JERS, SIR-C/X-SAR, RADARSAT, SRTM , EnviSAT-ASAR, RADARSAR-II, LIGHTSAR, ALOS-PALSAR, TerraSAR-X). The recently launched Sentinel-1A and the planned Sentinel-1B satellites continue this time series and will provide a Synthetic Aperture Radar (SAR) data base with much higher spatial and temporal resolution than with previous radar missions. Sentinel-1A, C-Band (central frequency of 5.405 GHz) SAR was launched on 3rd April 2014. Starting in October 2014, regular coverage is available in both VV and VH polarizations for central Europe. The Interferometric Wide Swath mode (IW) offers regular, dual polarization coverage with 20x5m spatial resolution.
The high potential of radar data for forestry applications is known since several decades. The main advantages are the capability for mapping vegetation cover in regions characterized by frequent cloud cover as for example tropical and boreal forests and the provision of time series data with high calibration stability as e.g. achieved with ERS-1 and ERS-2 data. In addition to being almost insensitive to weather conditions, SAR data is a useful data source providing information on the structure and moisture status that is complementary to the information provided by optical remote sensing (Toan et al., 1998).
These strengths were used in a multitude of studies e.g. on forest mapping (Dontchenko et al., 1999; Dwyer et al., 2000; Quegan et al., 2000; Sgrenzaroli et al., 2002; Strozzi et al., 1998; Wagner et al., 2003), forest change detection (Gimeno et al., 2002; Hese and Schmullius, 2003; Saatchi et al., 1997) and biomass measurements (Dobson et al., 1992; Toan et al., 1992; Toan and Floury, 1998; Wagner et al., 2003). The delineation of forested areas from remote sensing data is a fundamental task in forestry. The area and location of forests is an essential input in studies on forest resources, forest contribution, global carbon cycle, forest ecosystems and on their productivity functions. Furthermore, the changes of the forest areas are in the focus of operational forest management and forest studies of forest change detection due to e.g. fire, storm, diseases or logging activities. Due to the relatively low spatial and temporal resolution of available SAR data their application for operational forest mapping is still limited. The availability of Sentinel-1 data will change this situation significantly.
The data from Sentinel-1 satellite were already demonstrated to be useful for land cover classification as a possibility to complement the cloud-covered areas (Balzter et al., 2015) or to be used for a forest change detection to identify clear-cuts (Olesk et al., 2015). Similarly, the dual-polarization data from Radarsat C-Band sensor were already used to complement forest cover maps from ALOS-PALSAR L-Band SAR systems (Anthea et al., 2014). Due to the high temporal coverage of Sentinel-1 data with an acquisition up to every three days in central Europe, the advantage of multi- and hyper-temporal
combination of images may be used for forest classification. The short revisit time also strongly supports the change detection applications.
The objective of this paper is to show first results of delineated forest areas from multi-temporal Sentinel-1 data from an Austrian study site. The results are validated with a reference forest mask derived from airborne full-waveform laser scanning data.
2. S TUDY AREA AND DATA 2.1 S tudy area
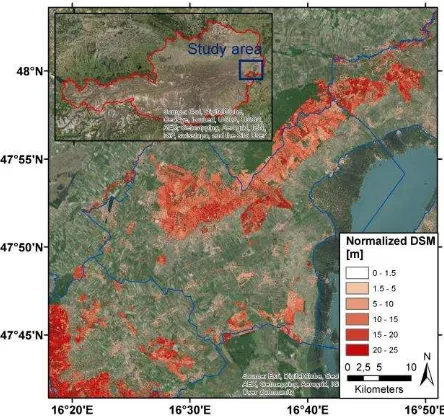
The northern part of the federal state Burgenland in Austria was selected as study area (Figure 1). In addition to the flat area around the Lake Neusiedl, this region contains two hilly areas with the highest elevation of 748 m and 484 m a.s.l., respectively. Both hilly regions are almost completely covered with mixed forest (deciduous and coniferous trees) with about 400 km2 each, while there are also several smaller forest areas up to 40 km2 outside the closed forests. The rest of the study area is rather flat, open land or urban area, with elevations ranging from 110 m to 260 m a.s.l., while in the eastern part the lake Neusiedl is located.
Figure 1: Overview of the study area. The ArcGIS Online basemap orthophoto is overlaid with the normalized DSM , derived from ALS data. The cells where the normalized DSM is
smaller than 1.5 m are plotted as transparent.
2.2 Data:
Sentinel-1A IW Ground Range Detected (GRD) Level-1 product was used in this study. The IW data have spatial resolution of 20m with the pixel spacing of 10m. Over the study area, regular coverage in VV and VH polarization is available since October 2014 with a temporal resolution of 4 days on average.
As the volume scattering at C-Band in forests (representing permanently vegetated areas) and dense agricultural crops (representing seasonally vegetated areas) may cause similar backscatter values over these two classes in summer time acquisitions and thus make the two classes less separable (Balzter et al., 2015), only the winter period (1st December 2014 to 31st M arch 2015) data were selected. All acquisitions from the specified time frame were used, regardless of the environmental conditions (snow, precipitation, temperature) or differences in orbit and thus in local incidence angles. On average, 30 acquisitions are available for each pixel within the study area.
In addition to Sentinel-1 data, full-waveform airborne laser scanning (ALS) data are available. The ALS data were collected in April 2010 with Riegl LM S-Q560 and LM S- Q680 sensors under the leaf-off and snow-free conditions. The ALS data cover the whole study area with an average point density in the non-overlapping areas of 4 points/m2, while recording up to 15 echoes per single laser shoot. The laser footprint of the recorded data was not larger than 60 cm in diameter. The ALS data are used for deriving a reference forest mask used for validating the Sentinel-1 derived forest area.
2.3 Reference forest mask
For the generation of the reference forest mask the approach from Eysn et al. (2012) is applied. This comprehensive approach is based on ALS data by considering the criterions tree height, crown coverage (CC) and the minimum area and width. The criterion of land use is not considered in this approach. Based on the slope adaptive echo ratio map, which describes the transparency for laser beams of the top most surface, it is possible to differentiate between buildings and trees. For the calculation of the CC the approach from Eysn et al. (2011) is applied, which uses clear geometric definition of the CC and works on a similar way than it is the case for manual assessment of the CC based on aerial orthophotos. This approach uses the area of the convex hull of three neighbouring trees as reference unit and thus overcomes limitations from e.g. pure moving window approaches such as smoothing effects along the forest border or the dependency on the kernel size and shape of the moving window. The entire workflow is implemented in the software package Opals (Pfeifer et al., 2014).
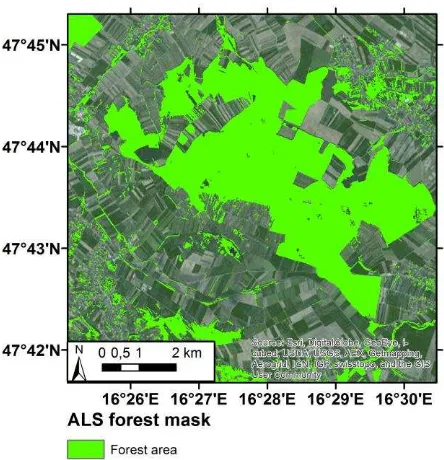
Figure 2: Subset of the derived forest mask with a minimum mapping unit of 500 m², crown coverage ≥30%, minimum height
3 m and minimum width of 10 m. In the background an ArcGIS Online basemap orthophoto is shown.
3. METHODS
The presented SAR forest map is based on statistical parameters derived from Sentinel-1 multi-temporal data-series over single winter period. The methodology is divided into the following steps: Sentinel-1 data pre-processing that includes processing of the level-1 data into the stack of georeferenced and quality checked images; forest area derivation, which includes statistical parameters derivation, their analysis and forest classification and validation using the ALS reference forest map.
3.1 S entinel-1 data pre-processing
The Sentinel-1 data were pre-processed using the Sentinel-1 Toolbox software (version 1.1.1). The processing steps included radiometric calibration to the sigma 0 values, range-Doppler terrain correction using SRTM digital elevation model (Jarvis et al., 2008) and conversion from linear to decibel scale. The data were checked for corrupt or shifted images and the precision of the georeferencing was tested. Extremely low backscatter values (below -30 dB) at the image edges caused by the thermal noise
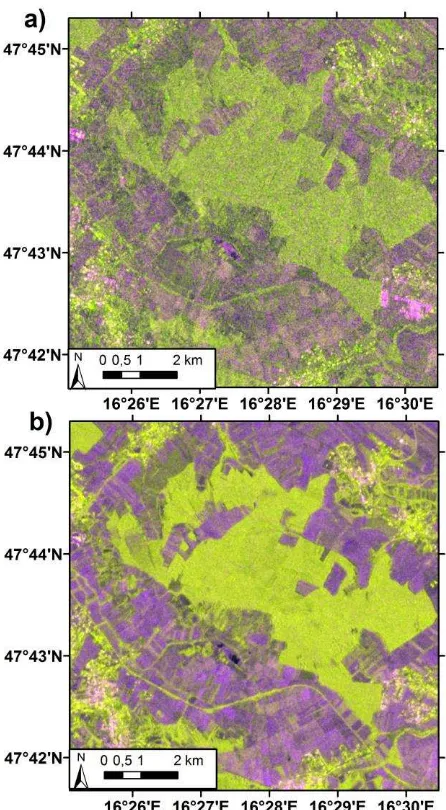
The combination of two polarization bands (VV and VH in this case) offers the possibility to use the backscatter intensities from the C-Band SAR sensor for a classification of various land cover types (Balzter et al., 2015). This is illustrated on Figure
3-a, which presents an RGB composite of the two polarizations and their difference for a single Sentinel-1 acquisition from 25th December 2014 over a 10 by 10 km subset of the region of interest. Forested areas (appearing green on the RGB composite) are typical for their relatively high backscatter intensities in both polarizations (especially in VH) and relatively low difference between the two polarizations when compared to the agricultural cropland. However, speckle noise and relatively strong topographic effects in the single SAR acquisition decreases the precision of a single image based classification. To reduce these limitations, acquisitions from entire winter period (1st December 2014 to 31st M arch 2015) were combined.
Number of statistical parameters was computed from the backscatter time-series for each pixel (e.g. mean, median, quartiles or standard deviation). Those providing the highest separability of forested and non-forested areas quantified by Bhattacharyya distance (Fukanaga, 2013) together with a low sensitivity to terrain variations were selected for the classification. The best results for both polarizations are achieved by the so-called dry parameter computed as the average of all values below first quartile of each pixel. The RGB composite of VH and VV polarization and their difference is presented in Figure 3-b. When compared to Figure 3-a, the speckle noise is reduced and the contrast bet ween forested and non-forested land is enhanced.
For the classification, the dry parameter for VV and VH polarizations and the difference between the two polarizations is used. Two approaches are tested: a thresholding method based on the thresholds derived by the Otsu algorithm (Otsu 1975) (Fig. 4-a) and a k-means clustering (Hartigan and Wong, 1979) (Fig. 4-b). The thresholds and cluster centres for the forest and non-forest classes were specified over the 10 by 10 km training area presented at Figures 2, 3 and 4 and were used for the entire region of interest. M inimal mapping unit of 500m2 was applied.
Both algorithms based on the above mentioned parameters tend to falsely classify urban areas as forests. For urban areas mapping, different parameters need to be selected. Dekker (2003) showed that the measure with the best preformation for the urban areas delineation is the mean SAR intensity. This approach works well in flat areas, however it leads to over classification in hilly areas. Another possibility is to use external ancillary data such as Corine land cover dataset (Bossard et al., 2000) to mask out the urban areas. Both approaches were evaluated in this study.
Figure 3: 10 by 10 km training area: a) RGB composite of VV polarization backscatter in red band, VH polarization backscatter in green band and their difference in blue band from
25th December 2014, b) RGB composite (VV, VH and their difference) of the dry parameter over the winter period
3.3 Validation
For the validation of the derived forest masks from the ALS derived forest mask (cp. section 2.2) is used as a reference. The minimum mapping unit for all forests masks is set to 500m2. The accuracy statistics are summarized in error matrixes, In addition to the overall accuracies, the producer and user accuracies as well as the kappa coefficients (Congalton and Green, 1999) are calculated for each derived forest mask.
Figure 4: 10 by 10 km training area: a) result of the thresholding approach classification, b) result of the k-means clustering
approach classification
4. RES ULTS AND DIS CUS S ION
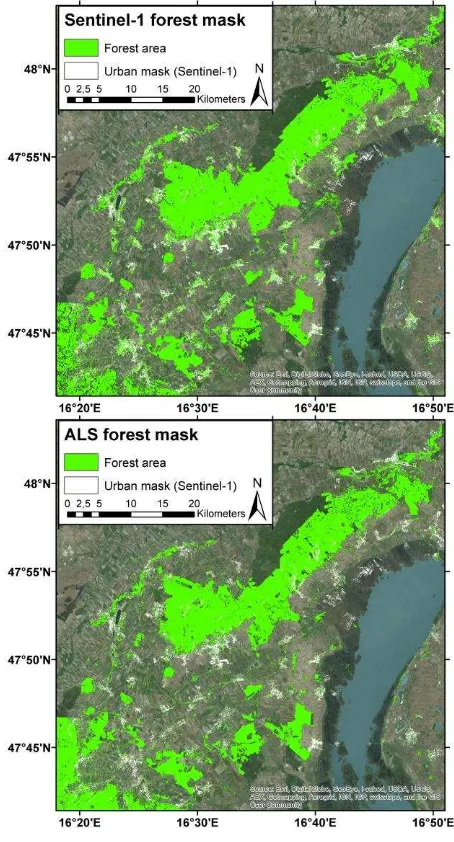
The ALS and Sentinel-1 (thresholding approach) forest masks for the entire test area are presented at Figure 5 and their differences are highlighted at Figure 6. The urban areas are masked with the mean SAR backscatter parameter. Spatial resolution of both datasets is 10m and minimal mapping unit is 500m2. The accuracy statistics for both the thresholding and the k-means approach are summarized in Table 1. The results are listed separately also for the different urban area masks (based on Sentinel-1 data and Corine land cover).
Both methods show overall good correspondence of the derived Sentinel-1 forest mask and the reference ALS forest mask. The kappa values range between 0.77 in case of k-means clustering
approach complemented with the urban mask based on mean Sentinel-1 backscatter and 0.83 in case of thresholding approach with Corine land cover urban mask. The generally lower user’s accuracy (75 and 78%) and very high producer’s accuracy (96%) of forests in case of the k-means clustering approach show that the method tends to overestimate the forest area. The overall accuracy is also lower than in case of the thresholing method. The thresholding method shows overall accuracies over 90% with balanced user’s and producer’s accuracies for both classes.
Thresholding approach
Urban mask Sentinel-1 Corine land cover Producer’s
accuracy: forest 87% 87%
Producer’s
accuracy: no forest 94% 96%
User’s accuracy:
forest 85% 89%
User’s accuracy: no
forest 95% 95%
Overall accuracy 92% 93%
Kappa statistic 0.81 0.83
K-means clustering approach
Urban mask Sentinel-1 Corine land cover Producer’s
accuracy: forest 96% 96%
Producer’s
accuracy: no forest 88% 90%
User’s accuracy:
forest 75% 78%
User’s accuracy: no
forest 98% 98%
Overall accuracy 88% 92%
Kappa statistic 0.77 0.80
Table 1: Accuracy statistics for Sentinel-1 forest masks using ALS forest mask as reference.
The urban mask based on external Corine land cover data performs better than the SAR based urban mask. The mask based on average SAR backscatter does not classify areas with lower building density as urban areas and these are then often falsely classified as forests (Figure 6). Strong topographic effects in some hilly areas might also lead to misclassifications as these are recognized as build up areas when using the simple approach based on average SAR intensity . Further research is needed to develop a better classification approach to distinguish forested and urban areas using Sentinel-1 data.
As the training area included only deciduous forests, the SAR based forest masks tend to underestimate forest area in regions, dominated by mixed and coniferous forests (Figures 5 and 6, South-Western part of the test area). Classification of multiple forest classes might further improve the result.
It should also be noted, that the temporal difference between the ALS and Sentinel-1 forest map is almost 5 years. No manual correction of the forest changes (clear-cuts, forest grow) was applied before the validation. This reduces the achieved accuracies, but also highlights the potential of the Sentinel-1 data to be used for change detection. Figure 7 represents the area where the changes in forest area are visible between the ALS and Sentinel-1 acquisition time (April 2010 and December 2014 to M arch 2015 respectively).
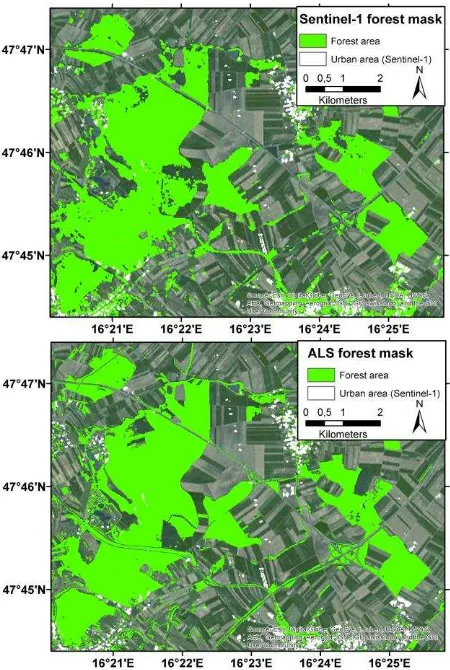
Figure 5: The ALS and Sentinel-1 (thresholding approach) forest mask for the entire region of interest overlaid on the ArcGIS
Online basemap orthophoto.
Generally, the accuracy of the Sentinel-1 forest mask exceeds 90% when compared to the reference ALS mask at the 10m spatial resolution. As the Sentinel-1 forest mask is based on data from a single winter season, yearly forest masks might be derived in future in case of a sufficient temporal coverage. Especially after the launch of Sentinel-1B, even interseasonal change detection might be possible with the presented accuracy.
Further research is needed to assess the applicability of the approach for a larger scale and diverse forest types.
Figure 6: Differences between the ALS and Sentinel-1 (thresholding approach) forest mask for the entire region of interest overlaid on the ArcGIS Online basemap orthophoto.
Figure 7: Subset of the ALS and Sentinel-1 based forest mask showing the clear-cut and forest grow changes between April 2010 and winter 2014/2015. The masks are overlaid on the
ArcGIS Online basemap orthophoto.
5. CONCLUS ION
Forest mask was derived over a study area in eastern Austria using a single winter season Sentinel-1A acquisitions. The resulting 10m resolution mask was validated using the reference ALS forest mask of the same area. Despite the temporal gap of almost 5 years between the ALS and Sentinel-1 data acquisitions, the overall accuracy reached 93% with kap pa statistics of 0.83 when using the threshold method and Corine land cover data to mask the problematic urban areas. Without external data for urban masking, the overall accuracy reached 92% with kappa value of 0.81. The forest mask from Sentinel-1 data has high potential for forest change detection mapping. Further research is needed to assess the applicability of the method on larger scale and for various forest types.
ACKNOWLEDGEMENTS
This work is founded from the European Community’s Seventh Framework Programme (FP7/2007–2013) under grant agreement No. 606971, the Advanced_SAR project.
REFERENCES
Anthea, L.M ., Ian, T., Anthony K., M ., M ark L., W., Zheng-Shu, Z., Eric, L., Peter, C., Kim, L. and Alex, H., 2014. C- and L-band SAR interoperability: Filling the gaps in continuous forest cover mapping in Tasmania. Remote Sensing of Envir onment, 155, pp. 58-68.
Balzter, H., Cole, B., Thiel, C. and Schmullius, C., 2015. M apping CORINE Land Cover from Sentinel-1A SAR and SRTM Digital Elevation M odel Data using Random Forests. Remote Sensing, 7, pp. 14876-14898.
Bossard, M ., Feranec, J. and Otahel., J., 2000. CORINE land cover technical guide: Addendum 2000.
Congalton, R.G. and Green, K., 1999. Assessing the accur acy of r emotely sensed data: Pr inciples and pr actices. CRC Press Inc.
Dekker, R.J., 2003. Texture analysis and classification of ERS SAR images for map updating of urban areas in The Netherlands. IEEE Tr ansactions on Geoscience and Remote Sensing, 41(9), pp.1950-1958.
Dobson, M .C., Ulaby, F.T., LeToan, T., Beaudoin, A., Kasischke, E.S. and Christensen, N., 1992. Dependence of Radar Backscatter on Coniferous Forest Biomass. IEEE Tr ansactions on Geoscience and Remote Sensing, 30(2), pp. 412-415.
Dontchenko, V.V., Johannessen, O.M ., Bobylev, L.P. and Bartalev, S.A., 1999. ERS\SAR Data Application for Russian Boreal Forests M apping and M onitoring. In: Pr oceedings, IGARS'99, July 1999, 3, Hamburg, Germany, pp. 1652-1654.
Dwyer, E., M onaco, S. and Pasquali, P., 2000. An operational Forest M apping Tool using spaceborne SAR Data. In: ERS-ENVISAT Symposium, Göteborg, Sweden.
Eysn, L., Hollaus, M ., Schadauer, K. and Roncat, A., 2011. Crown coverage calculation based on ALS data. In: 11th Inter national Confer ence on LiDAR Applications for Assessing For est Ecosystems (Silvilaser 2011), Hobart, Australia, Oct. 16-20, p. 10.
Eysn, L., Hollaus, M ., Schadauer, K. and Pfeifer, N., 2012. Forest Delineation Based on Airborne LIDAR Data. Remote Sensing, 4(3), pp. 762-783.
Fukunaga, K., 2013. Intr oduction to statistical patter n r ecognition. Academic press.
Gimeno, M ., San-M iguel, J., Barbosa, P. and Schmuck, G., 2002. Using ERS-SAR images for burnt area mapping in M editerranean landscapes. For est Fir e Resear ch & Wildland Fir e Safety, 14.
Hartigan, J. A. and Wong, M . A., 1979. Algorithm AS 136: A k-means clustering algorithm. Applied statistics, pp. 100-108.
Hese, S. and Schmullius, C., 2003. Forest Cover Change Detection in Siberia. In: Joint ISPRS\EARSeL Workshop “High Resolution Mapping from Space 2003”, Institut für Photogrammetrie und Geoinformation, Universität Hannover.
Jarvis, A., Reuter, H. I., Nelson, A. and Guevara, E., 2008. Hole-filled SRTM for the globe Version 4. available from the CGIAR-CSI SRTM 90m Database (http://srtm. csi. cgiar. org).
Olesk, A., Voormansik, K., Pohjala, M . and Noorma, M ., 2015. Forest change detection from Sentinel-1 and ALOS-2 satellite images, Synthetic Aperture Radar (APSAR), IEEE 5th Asia-Pacific Confer ence, 1-4 Sept. 2015, pp. 522-527.
Otsu, N., 1975. A threshold selection method from gray-level histograms. Automatica, 11, pp. 23-27.
Pfeifer, N., M andlburger, G., Otepka, J. and Karel, W., 2014. OPALS - A framework for Airborne Laser Scanning data analysis. Computer s, Envir onment and Ur ban Systems, 45, pp. 125-136.
Quegan, S., Toan, T.L., Yu, J.J., Ribbes, F. and Floury, N., 2000. M ultitemporal ERS SAR Analysis Applied to Forest M apping. IEEE Tr ansactions on Geoscience and Remote Sensing, 38(2), pp. 741-753.
Saatchi, S.S., Soares, J.V. and Alves, D.S., 1997. M apping Deforestation and Land Use in Amazon Rainforest by Using SIR-C Imagery. Remote Sensing of Envir onment, 59, pp. 191-202.
Sgrenzaroli, M ., Grandi, G.F.D., Eva, H. and Achard, F., 2002. Tropical forest cover monitoring: estimates from the GRFM JERS-1 radar mosaics using wavelet zooming techniques and validation. Inter national Jour nal of Remote Sensing, 23(7), pp. 1329-1355.
Strozzi, T., Dammert, P., Wegmüller, U., M artinez, J.-M ., Beaudoin, A., Askne, J. and Hallikainen, M ., 1998. European Forest M apping with SAR Interferometry. In: Second International Workshop on “Retrieval of Bio- and Geo-physical Parameters from SAR data for Land Applications”, ESTEC, 21 -23 October 1998, Noordwijk, The Netherlands.
Toan, T.L. and Floury, N., 1998. On the Retrieval of Forest Biomass from SAR Data. In: Second International Workshop on “Retrieval of Bio- and Geo-physical Parameters from SAR data for Land Applications”, ESTEC, 21-23 October 1998, Noordwijk, The Netherlands.
Toan, T.L., Askne, J.I.H., Hallikainen, M ., Beaudoin, A., M anninen, T., Wegmüller, U. and Quegan, S., 1998. European Forest Observation using Radars - EUFORA. Theme \ Area: 3-1-1, European Union: Environment - Climate Programme.
Toan, T.L., Beaudoin, A., Riom, J. and Guyon, D., 1992. Relating Forest Biomass to SAR Data. IEEE Tr ansactions on Geoscience and Remote Sensing, 30(2), pp. 403-411.
Wagner, W., Luckman, A., Vietmeier, J., Tansey, K., Balzter, H., Schmullius, C., Davidson, M ., Gaveau, D., Gluck, M ., Toan, T.L., Quegan, S., Shvidenko, A., Wiesmann, A. and Yu, J.J., 2003. Large-scale mapping of boreal forest in SIBERIA using ERS tandem coherence and JERS backscatter data. Remote Sensing of Envir onment, 85, pp. 125-144.