A B S T R A C T :
We have investigated how the quality of stereoscopically measured topography degrades with varying illumination, in particular the ranges of incidence angles and illumination differences over which useful digital topographic models (DTMs) can be recovered. Our approach is to make high-fidelity simulated image pairs of known topography and compare DTMs from stereoanalysis of these images with the input data. Well-known rules of thumb for horizontal resolution (>3–5 pixels) and matching precision (~0.2–0.3 pixels) are generally confirmed, but the best achievable resolution at high incidence angles is ~15 pixels, probably as a result of smoothing internal to the matching algorithm. Single-pass stereo imaging of Europa is likely to yield DTMs of consistent (optimal) quality for all incidence angles ≤85°, and certainly for incidence angles between 40° and 85°. Simulations with pairs of images in which the illumination is not consistent support the utility of shadow tip distance (STD) as a measure of illumination difference, but also suggest new and simpler criteria for evaluating the suitability of stereopairs based on illumination geometry. Our study was motivated by the needs of a mission to Europa, but the approach and (to first order) the results described here are relevant to a wide range of planetary investigations.
* Corresponding author
1 . B A C K G R O U N D
One of the primary objectives of a mission to Europa (e.g., NASA’s notional Europa Clipper: Thomas and Klaasen, 2013) would be to determine the thickness and structure of Europa’s icy shell by probing it with an ice penetrating radar (IPR). A high resolution topographic model of a strip straddling the ground track is essential to “declutter” the radar echoes, i.e., to determine which features in them arise from subsurface reflectors and which are generated by surface reflections to the sides of the ground track. Clipper’s notional payload therefore also included a Topographical Imager (TI) that would operate simultaneously with the IPR to obtain the needed stereo image coverage. The quality of the images will vary along track because neither the range (hence, image resolution) nor the illumination is constant. As an extreme example, topographic mapping and decluttering will not be possible on the night side. Some degradation of DTM quality is also to be expected in areas of both low incidence angle (i.e., sun high in the sky, where the surface appearance will be bland) and high incidence angle (where shadows will be present). We aim to estimate what fraction of stereo coverage from a typical flyby is likely to be useful.
We use the notional instrument designs in this study, but NASA has since authorized the start of an Europa Multiple Flyby Mission and selected instruments including the REASON radar profiler (Moussessian et al., 2015) and EIS imaging system (Turtle et al., 2015), and our results will apply directly to these. EIS includes two cameras: a wide-angle camera (WAC) that addresses the TI objectives and a narrow-angle camera (NAC) for higher resolution imaging of scientific targets and potential landing sites. EIS WAC is a multi-line pushbroom camera, similar to the Mars Express High Resolution Stereo Camera
(HRSC; Heipke et al., 2007) in that it is designed to obtain a stereo image set in a single pass with effectively no change in illumination between the images. EIS NAC is a framing camera and will be mounted on a two-axis gimbal to allow imaging of targets offset from the subspacecraft point. Oblique pointing also makes stereo imaging possible, but stereopairs will generally be obtained by imaging on two separate flybys with different illumination conditions. We therefore also investigate how DTM quality degrades with mismatched illumination in order to set a limit on acceptable illumination differences for observation planning (Becker et al., 2015). Such guidelines would also be of interest for the majority of planetary imaging systems that are not designed to obtain stereopairs in a single pass, both for selecting pairs from image collections already in hand and for planning future stereo observations.
(1999b; 2003a; 2008; 2011) have investigated ρin different ways for a variety of planetary image types and the results have generally validated the rule of thumb that ρ is 0.2 to 0.3 pixel for images of good quality. The degradation of ρ for non-ideal images has received less study, but Kirk et al. (1999b) showed that ρincreases as images are lossily compressed.
2 . T E C H N IC A L A P P R O A C H
Simulating images of known topography and trying to recover that topography provides a straightforward way of investigating the factors that affect DTM quality. It is important that the input data represent the target of interest fairly realistically, and crucial that the simulations be of sufficiently high fidelity to capture key effects such as realistic photometric behavior and cast shadows. It is less important that the source DTM be perfectly accurate, because the test of success is how well we recover the input data rather than how accurately it represents the target. This is a key advantage of carrying out numerical simulations rather than the alternative approach of physically imaging a planet-like target and comparing stereo DTMs to some independent source of information about its shape. Nor is it crucial to match the resolution of the TI or EIS images (which in any case varies substantially within each flyby), because Europa has similar geologic features at a range of scales and we can express our results in terms of image pixels so they can be scaled to the TI or other cameras.
Comparable studies using simulated images to investigate the quality of stereo and other imaging are relatively rare at least in planetary exploration and mapping. A notable exception is the Virtual Vesta project conducted by the Dawn mission team (Raymond et al., 2011), in which an entire suite of images of the asteroid Vesta were simulated in advance of the spacecraft encounter. Because Vesta had not yet been observed at high resolution, geologically plausible landforms (impact craters and random variations) and albedo variations were simulated. Rather than investigating the dependence of quality for a single stereomodel on illumination as we do here, Raymond et al. focused primarily on the overall suitability of the planned imaging campaign for generating global shape models by stereophotogrammetry and stereophotoclnometry and estimating the accuracy of those models. Based on the results of the simulations, the actual spacecraft observation plan was modified
to increase the total number of images obtained and improve the geometry off-nadir imaging.
2 .1 S o u rc e D a ta
In the late 1990s we produced more than 20 high-resolution DTMs of Europa by photoclinometry (shape from shading; see Kirk et al. 2003b) applied to Galileo SSI images of Europa to produce numerous DTMs with GSD ranging from 26 to 630 m. A multi-image data set (Figueredo et al., 2001) was centered on Castalia Macula at -0.7°N 134.7°E and was based on 3 images with ~210 m GSD and incidence angle ~80° along with one having lower resolution (1570 m GSD) and 21° incidence. For the present work we reprocessed the same data set with the addition of three additional high-resolution images, yielding a DTM 1400x2250 pixels or 294x472.5 km in size (Figure 1). The mosaic of high-incidence images was divided by the low-incidence image to provide first-order correction of albedo variations before photoclinometry was performed. The resulting DTM contains topographic features (e.g., single and double ridges, wedge bands, and domes) down to the limit of the image resolution. A map of the Hapke (1981) single-scattering albedo needed for the simulations was approximated by linearly scaling the low-incidence image data. The scaling was adjusted iteratively until a simulation at the approximate geometry of the low-incidence image reproduced the relative contrast that was actually observed.
2 .2 Im a g e S im u la tio n
We use the image simulation package OASIS (Jorda et al., 2011) to generate synthetic images. Its advantages include the following:
• Flexible setup of hypothetical cameras, hypothetical camera orientations, and hypothetical illumination via text files.
• Rigorous photometric modeling including Hapke (1981; 1984) scattering with spatially varying single-scattering albedo. We use the low-incidence SSI image appropriately scaled, as our albedo map and choose Europa-appropriate values of other Hapke parameters (Buratti, 1995; Domingue and Verbiscer, 1997).
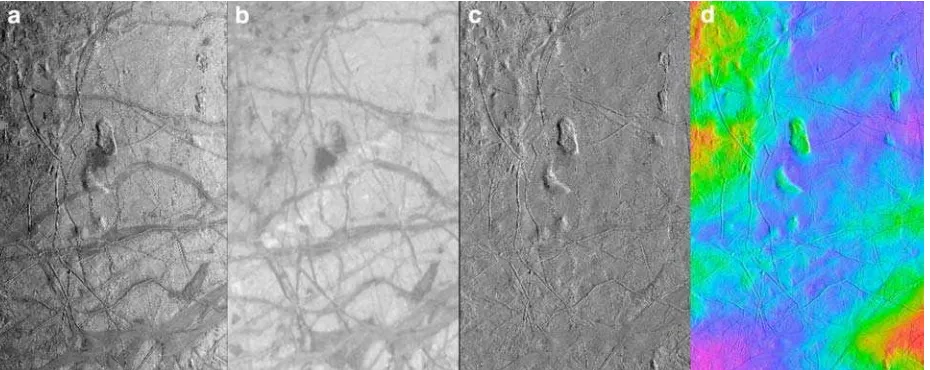
F ig u re 1 . Input data for Europa stereo simulations. (a) Mosaic of 6 Galileo SSI frames with ~80° incidence angle, 210 m GSD. (b) Coregistered single frame with 21° incidence, 1570 m GSD serves as an albedo map of the region after appropriate scaling. (c) Ratio of a to b is effectively albedo corrected. (d) DTM generated from c by two-dimensional photoclinometry [7] shown as color-coded elevations overlaid on c. Range of elevations from purple (low) to red (high) is 3200 m. All images are 294x472.5 km, Equirectangular projection centered at 0.7°N, 225.3°W (134.7°E), north at top.
• Modeling of cast shadows, camera optical point spread function (PSF), and finite signal to noise ratio (SNR).
For simplicity, we have set up a framing camera with p/h equal to that of the Clipper TI and GSD matched to the 210 m raster of the source data. We generate images in pairs with identical illumination and offset camera stations providing the needed stereo convergence. Pairs have been generated at incidence angles spanning the full range from 0° to 90° and at multiple sun azimuths in order to assess the extent to which results are affected by chance alignments of topography and illumination. Mismatched pairs with a range of incidence angle or sun azimuth differences were also generated.
2 .3 Im a g e Q u a lity A sse ssm e n t
Objective and subjective measures of the quality of the simulated images were investigated prior to stereoanalysis. We evaluated the fractional local contrast of each image (standard deviation after highpass filtering with a 5x5 pixel boxcar, which is smaller than the details resolved in the albedo image, divided by the mean of the unfiltered image) and the fraction of each image in shadow (as reported by OASIS). We also viewed the pairs on a stereo display and made a subjective assessment of stereo quality on a scale from 1 to 10 based on our past experience with a variety of planetary images.
2 .4 S te re o a n a ly s is
We use the commercial stereo mapping software package SOCET SET® (Miller and Walker, 1993; 1995; Zhang et al., 2006) from BAE Systems to produce DTMs from the images simulated. This software, which we use for a wide range of planetary mapping projects, is state-of-the-art and a world leader in terms of number of licenses sold. Results from different image matching algorithms can be expected to differ slightly, but those from SOCET SET should be representative, particularly in terms of the degradation of quality factors with
illumination. Controlling the images, usually a time consuming step of DTM production, is not necessary because the simulated camera stations are exactly known. Manual editing of the DTMs, the other time-consuming step, can also be omitted because the objective is to evaluate the success of automated image matching. All stereo DTMs were collected with a GSD of 820 m (4 image pixels). This is coarser than the theoretical minimum DTM resolution of 3 pixels, but our results show that the estimated resolution is larger and is not limited by our choice of sampling.
2 .5 D T M Q u a lity A sse ssm e n t
The DTM quality measures of greatest interest are the horizontal resolution and vertical precision. Vertical precision was estimated by collecting statistics on the difference between the stereo DTM and the input “truth” DTM, downsampled to a GSD of 4 pixels and trimmed to match the region over which stereo DTMs were collected. Because of parallax and edge effects this overlap area is slightly smaller than the region covered by the truth data. By smoothing the truth DTM with a lowpass filter and adjusting the size of this filter to give the best agreement with the stereo DTM, it is possible to estimate the resolution of the DTM as well (Kirk et al., 2011). We report the horizontal resolution in units of the image GSD and scale the vertical precision to the matching precision ρ so that they are independent of the details of the simulation geometry. In particular, the scaled results can be used to estimate the performance of EIS WAC or NAC at any desired altitude. We also made a qualitative assessment of the abundance and appearance of artifacts in the DTM as a function of incidence angle, as well as the extent to which they are associated with shadows.
3 . R E S U L T S
3 .1 E ffe c t o f In c id e n c e A n g le
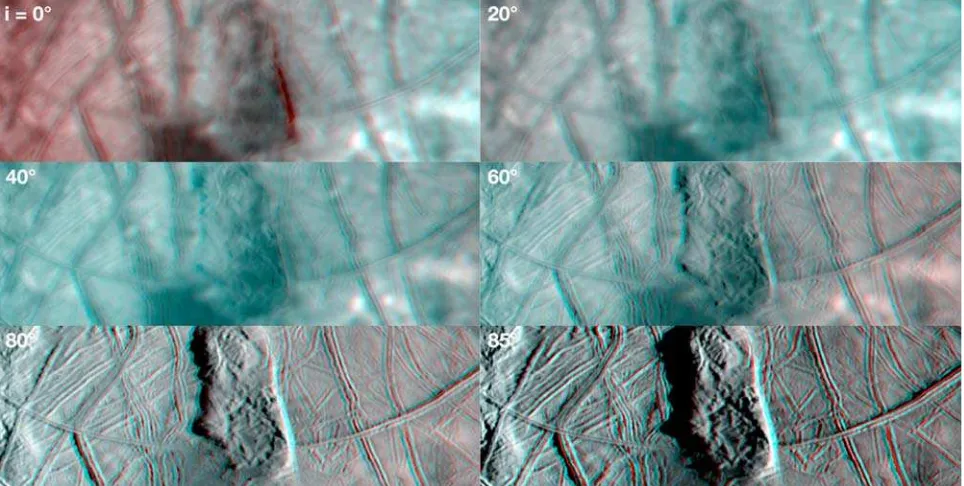
Figure 2 shows a subarea of several of the simulated image pairs in anaglyphic form (view with red lens on the left eye, cyan on the right). The improvement in image quality with incidence angle as small details become more visible is immediately apparent. Our subjective evaluation indicates that the quality drops off somewhat at 85° incidence. This evaluation is supported by measurements of the local contrast, which increases monotonically with incidence angle, closely approximating the function tan(i) that would be expected for a Lambertian scatterer. The shadowed area increases from ~1% at 80° to ~10% at 85° and ~90% at 90° incidence (which is therefore not shown in Fig. 2). The combination of the contrast and shadowing effects directly explains the variation of subjective quality with incidence angle. These results hold at multiple sun azimuths, though the details vary slightly.
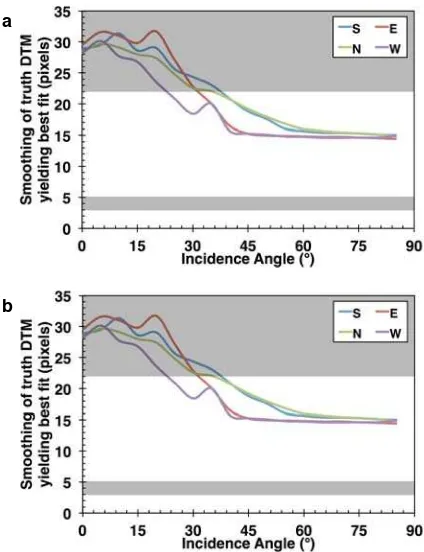
Figure 3 shows DTM resolution and matching precision in pixels as a function of incidence angle, for sun azimuths corresponding to the cardinal directions. The rules of thumb (resolution >3–5 pixels, ρ ~0.2–0.3 pixel) are also shown for both the high resolution shading images and the albedo image. The results show a transition from approximately expected matching error for the albedo image at low incidence to that expected for the shading images at high incidence. The DTM
resolution makes a similar transition from about the value expected for the albedo pixel scale to an optimum value of ~15 pixels at high incidence angles, substantially greater than the theoretical minimum. A likely explanation is that the automatic matching algorithm incorporates internal smoothing of its results at this scale. Because the albedo image, which contributes most of the contrast in the low-incidence simulations, is oversampled, it would not be affected. The transition occurs at slightly different incidence angles depending on the sun azimuth. These variations, like those in shadow fraction, are likely a consequence of the slight anisotropy of surface slopes.
Figure 4 shows the difference between a stereo DTM collected in SOCET SET from an optimal (80° incidence) stereopair and the downsampled truth DTM. It is clear that the residuals are highly non-random; the positive and negative excursions visible in Fig. 4 mostly correspond to geologic features, mainly ridges and domes, visible in Fig. 1. This is partly but not entirely a consequence of the limited resolution of the stereo matching process. Smoothing the truth DTM reduces the RMS residuals slightly, but similarly localized residuals are seen even relative to the smoothed reference. DTMs from the low incidence angle simulations are blockier and the errors are larger, but artifacts are also highly correlated with the real topography. In many cases ridges appear in the DTM as troughs or troughs with raised rims. This suggests that the artifacts reflect not simply a failure to resolve surface features, but a tendency toward greater matching errors where the images show more structure. An important consequence is that the vertical precision of the DTMs, particularly at low incidence, could be improved at the expense of resolution by postprocessing with additional smoothing.
a
b
F ig u re 3 . Variation of (a) horizontal resolution and (b) matching precision with incidence angle for stereopairs with matching illumination from the cardinal directions. Both quantities are scaled to the GSD of the high resolution shading image. Gray bands indicate the rules of thumb (resolution >3–5 pixels, ρ ~0.2–0.3 pixel). The lower band is based on the GSD of the shading images. The upper band in b is appropriate to the albedo image GSD.
F ig u re 4 . Difference between the DTM produced by stereonalysis of an “optimal” simulated image pair (80° incidence) and the “truth” DTM used in the simulations. Extent and color scale are as in Fig. 1d but the range of elevation differences is only 320 m, 1/10 as large as the full range of topography. The RMS difference is 36 m, corresponding to 0.17 pixel matching precision. Errors are not random, but highly correlated with topographic features. ISPRS Annals of the Photogrammetry, Remote Sensing and Spatial Information Sciences, Volume III-4, 2016
images of Europa at low incidence angle and high resolution (Kreslavsky et al., 2000), which suggest that albedo variations are significant down to decameter scales, much smaller than the sampling of our input data. Whether such small-scale albedo contrasts are widely prevalent is impossible to demonstrate with current data, but we can evaluate the consequences if, as is geologically plausible, they are.
The high resolution, low incidence images of Europa are unfortunately not overlapped by either stereo observations or images with high incidence images useful for photoclinometry. To address the effects of small-scale albedo variations, we therefore artificially enhanced the albedo map with pixel-scale details and repeated the image simulations and DTM evaluations described above at the same set of illumination and viewing geometries. The added details were not random, but were derived from the truth DTM, ensuring that they would (like observed albedo markings on Europa) be associated with topographic features. Specifically, we computed the Laplacian of the truth DTM and multiplied the albedo map derived from our low resolution image by a scaled version of this. The scaling was chosen so that the RMS variation of albedo at single-pixel scales was about 10%, similar to what is actually observed at kilometer scales (Figure 5).
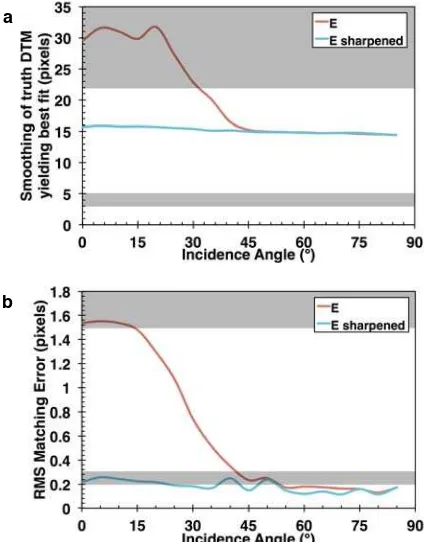
The resulting images have much higher local contrast and subjective quality at low incidence than the simulations based purely on Galileo data. Figure 6 shows the DTM resolution and precision compared to the original simulations for images illuminated from the east. The strong variation of these DTM quality factors with incidence angle is eliminated. If, as seems likely based on geologic experience and the highest resolution available images, Europa’s albedo varies by ~10% even at small
scales, then stereo DTMs of near-optimal quality can be obtained at all incidence angles less than about 85°.
3 .3 E ffe c t o f M ism a tc h e d Illu m in a tio n
As already noted, the performance of stereo matching on image pairs with differing illumination is relevant to the EIS NAC as well as to a host of other planetary cameras. To investigate this problem, we analyzed stereopairs in which the left image was illuminated from the east at an incidence angle of 20°, 40°, 60°, or 80° and the right image was illuminated either from the east at an incidence angle from 0° to 85° or at the same incidence angle and sun azimuth differing by 0° to 180° at 5° angular increments. We primarily used the artificially enhanced albedo model described in the previous section for these tests but also examined the behavior of images based on the unenhanced albedo. As expected, both the resolution and precision of the derived DTMs become greater (worse) as the discrepancy in either incidence or azimuth angle is increased, and this degradation is more severe at larger incidence angles.
We are interested in comparing our results to criteria for acceptable stereo imaging that have been proposed and used in the past. Some of these consist of separate bounds on azimuth and incidence differences. For example, Cook et al. (1996) imposed an upper limit of 45° sun azimuth difference when selecting candidate stereopairs from the Clementine mission to the Moon. Kirk et al. (1999a) pointed out that illumination differences would have less effect at lower incidence angles and relaxed this limit for pairs with i < 60° and further for i < 30°. They also imposed limits on the incidence angle differences at 1/6 of their azimuth limits. More recently, a criterion combining azimuth and incidence differences has been adopted by the
F ig u re 6 . Plots of (a) horizontal resolution and (b) matching precision as a function of incidence angle. Red curves are for illumination from the east, as shown in Fig. 3. Blue curves are for images pairs generated identically but with an albedo map enhanced with pixel-scale details (Fig. 5, right).
Mars Reconnaissance Orbiter High Resolution Imaging Science Experiment (HiRISE) team for stereo planning. Known as shadow tip distance (STD; Becker et al. 2015) this quantity considers the shadows that a meter stick placed vertically on the surface would cast in the two images. STD is defined as the distance between the tips of these hypothetical shadows and is directly analogous to the parallax to height ratio used to characterize stereo strength, but is calculated based on the sun direction rather than the spacecraft direction. Even if the images contain no real shadows (because surface slopes are smaller than the complement of the incidence angle), the STD characterizes differences in topographic shading in a smooth way. But is there a well-defined threshold value of STD that separates good from bad stereopairs?
Figure 7 shows the stereo matching precision for simulations with both azimuth and incidence differences, plotted against STD. The corresponding plot for resolution (not shown) is qualitatively similar. The curves for incidence angles 20° to 60° (in the left image) cluster around a common trend and suggest that DTM quality is noticeably degraded for STD > 1. The curves for pairs in which the right image has a large incidence angle, suggest that STD as large as 4 could be tolerated in these cases, while that for azimuth differences at i = 80° is intermediate. This is understandable, because increasing the incidence angle (short of shadowing) mostly increases the contrast but not the pattern of topographic shading. Decreasing the incidence angle or changing the sun azimuth, on the other hand, leads to qualitative changes in shading. It is also worth noting that the greater tolerance for shadow tip differences at large incidence angles does not contradict the earlier assertion that high-incidence images are more sensitive to illumination differences. This is because the shadow length and thus STD increase without bound as i –> 90°.
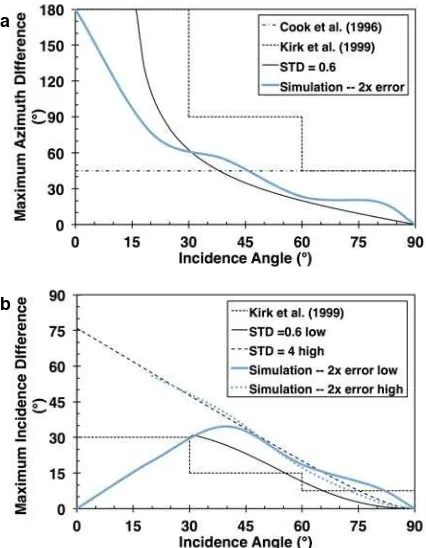
In Figure 8 we compare the separate azimuth and incidence criteria of Cook et al. (1996) and Kirk (1999a) to the bound STD < 0.6 (Becker et al., 2015) and the looser bound STD < 4 for increasing incidence suggested by Fig. 7. Overlaid on these are curves for the azimuth and incidence differences at which
we find DTM precision to be degraded to twice its optimal value for matching illumination. There is reasonable agreement between the proposed criteria and simulation results, though some criteria are too restrictive and others likely too loose. The STD bounds (with increased incidence treated as a special case) agree the most closely with the simulations and should be usable in practice. Given the minor discrepancies between the different curves, as well as the likelihood that the simulation results would vary slightly if the balance of slopes and albedo variations were different, we propose the following new criteria for stereo planning:
Δ az <(90° - i) Δ i <0.8 (90° - i)
where Δ az and Δ i are the sun azimuth and incidence angle differences. In the first equation, the average incidence angle should be used for i. In the second, either incidence angle can be used to calculate a bound on acceptable Δ i to the other image. These simple bounds have the advantage of eliminating the need to calculate STD. Note that, although this azimuth criterion reproduces the simulation results reasonably well for i ≥ 20°, it unfairly excludes some pairs with very low incidence angles and larger but actually acceptable azimuth differences.
The results for simulations based on the unenhanced albedo model are at first sight much more complex, but can be summarized as follows: if either image has low (<40°) incidence, DTM quality will be poor. If both images have i > 40° the criteria for acceptable stereo are similar to the enhanced albedo case. Although we argue that these simulations are unlikely to reflect the true behavior of high resolution Europa images, the results are likely to be relevant to stereo imaging of other targets that are known to have little local albedo contrast, such as the martian polar layered deposits.
F ig u re 7 . DTM precision for stereopairs with mismatched sun azimuth (solid curves) or incidence angle (dashed curves). The legend indicates the incidence angle of the left image, which is illuminated from the east in all cases. Results are plotted as a function of shadow tip distance STD (see text). Dashed curves extending to the right correspond to pairs in which the right image has a higher incidence angle than the left. In general, DTM quality is more forgiving of incidence angle increases than of decreases or azimuth differences.
a
b
F ig u re 8 . Proposed criteria (black lines) for acceptable limits on (a) sun azimuth mismatch and (b) incidence angle mismatch for stereo matching. Blue lines show the angular differences at which our simulations indicate 2x degradation ISPRS Annals of the Photogrammetry, Remote Sensing and Spatial Information Sciences, Volume III-4, 2016
corroborate well-known rules of thumb for DTM resolution and precision, but show that (as configured for this project) the SOCET SET image matcher does not approach the theoretical resolution limit of ~3 image pixels. More generally, we have demonstrated that high fidelity image simulation is a useful tool for evaluating the end-to-end process of stereo imaging and DTM production.
5 . F U T U R E W O R K
The primary issue driving future work is the extent to which the specific results (imaging guidelines and quality rules of thumb) derived from analysis of Europa simulations with SOCET SET will apply more generally to other targets and other stereoanalysis packages. Therefore one of our goals for the future is to investigate DTMs produced from the images described here with the Ames Stereo Pipeline (Moratto et al., 2010), a package in widespread use in the planetary community that uses an automated matching algorithm developed independently from the SOCET SET matcher. Such tests should shed light on whether the best DTM resolution achieved here, around 15 pixels, is a limitation of the data used or of the stereo software.
A second goal is to perform similar simulations for other types of planetary images. This will result in guidelines tailored to those instruments and targets, if necessary, and will also give a good indication whether satisfactory general rules for stereo imaging can be formulated or whether specific simulations should be performed for each target body or even each camera. There are a numerous instruments that have produced stereo images valuable to contemporary research, but two stand out. Each has the high resolution and large image size needed to support good simulations, and each is still acquiring stereopairs that are in high demand for DTM production. In addition, these cameras are imaging bodies with dramatically different surface morphologies, slopes, and albedo distributions from one another and from Europa, allowing us to explore the effect of such target properties on stereo performance. The first is the Mars Reconnaissance Orbiter HiRISE with 0.25 m image GSD (McEwen et al. 2010) enabling production of DTMs at 1 m GSD (Kirk et al., 2008). Several thousand HiRISE stereopairs have been acquired to date, and more than 200 DTMs have been produced and released to NASA’s Planetary Data System (Mattson et al., 2011; Sutton et al., 2015). The second is the Lunar Reconnaissance Orbiter Narrow Angle Camera (LROC NAC; Robinson et al., 2010), which has 0.5 m image GSD and yields DTMs with 1.5 m GSD (Beyer et al., 2011). As with HiRISE, thousands of stereopairs have been acquired and hundreds of DTMs have been produced and archived. Both instruments have very wide image swaths (20000 and 10000
of stereo image pairs. Lunar Planet. Sci. XLVI, 2703.
Beyer, R., et al., 2011. LROC DTM Comparison Effort. Lunar Planet. Sci. XLII, 2715.
Buratti, B., 1995. Photometry and surface structure of the icy Galilean satellites. J. Geophys. Res. 100, 19,063.
Cook, A. C., Oberst, J., Roatsch, T., Jaumann, R., and Acton, C., 1996. Clementine imagery: selenographic coverage for cartographic and scientific use. Planet. Space Sci., 44(10), 1135-1148.
Domingue, D., and Verbiscer. A., 1997. Re-analysis of the solar phase curves of the icy Galilean satellites. Icarus 128, 49.
Figueredo, P.H., et al., 2001. Europa’s “Mitten”: Morphology, topography, and surface evolution. Lunar Planet. Sci. XXXI, 1026.
Hapke, B., 1981. Bidirectional reflectance spectroscopy 3: Corrections for macroscopic roughness. J. Geophys. Res. 86, 4571.
Hapke, B., 1984. Bidirectional reflectance spectroscopy 4: The extinction coefficient and the opposition effect. Icarus 59, 41.
Heipke, C., et al., 2007. Evaluating planetary digital terrain models: The HRSC DTM Test. Planet. Space Sci. 55, 2173.
Jorda, L., et al., 2011. OASIS: a simulator to prepare and interpret remote imaging of solar system bodies. Proc. SPIE 7533, 753311.
Kirk, R. L., Barrett, J., and Howington-Kraus, E., 1999a. A Database of Viking Orbiter image coverage for cartographic and scientific use. Lunar Planet. Sci., XXX, 1857.
Kirk, R.L., et al., 1999b. Digital photogrammetric analysis of the IMP camera images: Mapping the Mars Pathfinder landing site in three dimensions. J. Geophys. Res. 104, 8868.
Kirk, R.L., et al., 2003a., High-resolution topomapping of candidate MER landing sites with Mars Orbiter Camera Narrow-Angle images. J. Geophys. Res. 108, 8088.
Kirk, R. L., et al., 2003b. Photoclinometry made simple…? ISPRS WG IV/9 Workshop, Houston, March 2003, online at http://astrogeology.usgs.gov/Projects/ISPRS/Meetings/Houston 2003/abstracts/Kirk_isprs_mar03.pdf.
Kirk, R.L., et al., 2011. Near-complete 1-m topographic models of the MSL candidate landing sites: Site safety and quality evaluation. European Planet. Sci. Conf. 6, EPSC2011-1465.
Kreslavsky, M.A., Helfenstein, P., Shkuratov, Yu. G., 2000. Europa's Opposition Spike: Preliminary Results from Galileo E14 Observations. Lunar Planet. Sci., XXXI, 1142.
Mattson, S., et al., 2011. Release of HiRISE Digital Terrain Models to the Planetary Data System. Lunar Planet. Sci., XLII, 1608.
McEwen, A.S., et al., 2010. The High Resolution Imaging Science Experiment (HiRISE) during MRO’s Primary Science Phase (PSP), Icarus, 205, 2–37.
Miller S. B., and Walker A.S., 1993. Further developments of Leica digital photogrammetric systems by Helava. ACSM/ASPRS Ann. Conv. 3, 26;
Miller S.B., and Walker A.S., Die Entwicklung der digitalen photogrammetrischen Systeme von Leica und Helava. 1995. Z. Phot. Fern. 63(1) 4.
Moratto, Z.M., et al., 2010. Ames Stereo Pipeline, NASA’s Open Source Automated Stereogrammetry Software. Lunar Planet. Sci. XLI, 2364.
Moussessian, A., et al., 2015. REASON for Europa. AGU Fall Meeting 2015, P13E-05.
Raymond, C.A., et al., 2011. The Dawn Topography Investigation. Space Sci. Rev. 163, 487.
Robinson, M.S., et al., 2010. Lunar Reconnaissance Orbiter Camera (LROC) instrument overview. Space Sci. Rev. 150, 81.
Sutton, S., et al., 2015. HiRISE Digital Terrain Models: Updates and Advances. Second Planetary Data Workshop. LPI Contribution No. 1846, 7056.
Thomas, V., and Klaasen, K., 2013. Notional Payload and Accommodation, presentation at ICEE Team Welcome Briefing, 23 October 2013.
Turtle, E.P., et al., 2015. The Europa Imaging System (EIS): High-Resolution, 3-D Insight into Europa’s Geology, Ice Shell, and Potential for Current Activity. AGU Fall Meeting 2015, P13E-03.
Zhang, B., et al., 2006. Automatic terrain extraction using multiple image pairs and back matching. ASPRS 2006 Ann. Conf., Reno, Nevada, 1–5 May, 12 pp.