BRUTE FORCE MATCHING BETWEEN CAMERA SHOTS AND SYNTHETIC IMAGES
FROM POINT CLOUDS
R. Boernera,∗, M. Kr¨ohnerta
a
Institute of Photogrammetry and Remote Sensing, Technische Universit¨at Dresden, Germany [email protected], [email protected]
Commission V, WG V/5
KEY WORDS:3D-Monoplotting, Line Matching, Line Extraction
ABSTRACT:
3D point clouds, acquired by state-of-the-art terrestrial laser scanning techniques (TLS), provide spatial information about accuracies up to several millimetres. Unfortunately, common TLS data has no spectral information about the covered scene. However, the matching of TLS data with images is important for monoplotting purposes and point cloud colouration. Well-established methods solve this issue by matching of close range images and point cloud data by fitting optical camera systems on top of laser scanners or rather using ground control points.
The approach addressed in this paper aims for the matching of 2D image and 3D point cloud data from a freely moving camera within an environment covered by a large 3D point cloud, e.g. a 3D city model. The key advantage of the free movement affects augmented reality applications or real time measurements. Therefore, a so-called real image, captured by a smartphone camera, has to be matched with a so-called synthetic image which consists of reverse projected 3D point cloud data to a synthetic projection centre whose exterior orientation parameters match the parameters of the image, assuming an ideal distortion free camera.
1. INTRODUCTION
Conventional approaches for the registration of images and pointclouds usethe combination of opticalsystemsand laser scanners or tie points. Obviously, camera-scanner-systems as well as ade-quate control data are highly cost-expensive. Withtheaid ofmodernsmartphones, itispossibletomeasure theexteriororientationfromsmartphone-takenimagesusing in-builtMicro-Electronic-Measurement-Systems(MEMS)for ori-entationandGlobalNavigationSatelliteSystems(GNSS)for po-sitioninformation.Furthermore,theseinformationcouldbeused forareverseprojection(hereafterreferredtoasre-projection)of 3Dpointclouddatawhichprovidessyntheticimagesofordered 2D pixels with respectively additional exterior informaZtion about the mapped objects. In this paper, captured images are referredtoasrealimages,becausetheyaretakenby(smartphone) camerasandthusnotderivedfrompointclouds.
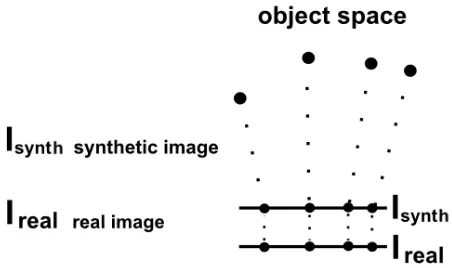
In case of user’s navigation through urban regions which werepreviouslycoveredby 3Dpointclouddata,the approach aimsfor the possibility of 3D information foreach pointthat refersto a e.g. imaged cityscape by real-to-synthetic image registra-tion. Thereby, the initial measured position and orientationcouldbeusedtore-project 3Dpointsregardingthe camera projection centre to a virtual image plane, which generates the mentioned synthetic image. A successful co-registration enhances the con-catenation of realand synthetic pixels(figure1).
Aftertheco-registrationofsmartphoneandsyntheticimagesthe smartphone-takenimageisusedforananalysisoftheobject ge-ometry(asdonewithrealimagesinBeckeretal.,2004). Further-more,thecolourinformationfromtheimagepixelscanbe trans-formedintothe3DspaceforcolourisationofTLSdata (Meier-holdetal.,2010).
Georeferencedpointcloudswithhigher-orderedaccuraciesupto ∗Corresponding author
a few centimetres could be used to improve the smartphone mea-surements regarding the exterior orientation.
Figure 1: Schematic visualisation regarding the matching process of co-registered real and synthetic image data.
Extracted elements from smartphone images, like lines, could be transformed in the object space with the aid of the co-registered synthetic image, providing 3D information that could be used fur-ther to extract the height information of lines in one captured im-age (e.g for window height determination).
However, the registration of real and synthetic images is a con-siderable challenge. There are strong distinctions between the datasets, especially in case of using intensity point clouds. A registration approach using SIFT is presented in Meierhold et al. (2010). Unfortunately, further tests have shown that to deal with real and synthetic images means to deal with strong differences in terms of colour distribution. Therefore, default matchers (like SIFT) seem to be inoperative.
data, which is extracted from the synthetic image.
Geometric primitives like points or lines enable the correlation of both image types. The first step comprises the detection of 2D and 3D lines in the smartphone-taken and the synthetic image re-spectively which will be used further to obtain correspondences between 2D and 3D lines. Hence, the synthetic image represents a hybrid between the 2D and 3D space, it is used for a robust and fast 2D detection to get corresponding 3D lines (chapter 3). Secondly, the extracted lines are still used for a following corre-lation process (chapter 4) whose resulting matches represent an approximation for a further resection (Meierhold et al., 2008). Chapter 5 presents the results from line extracting and matching. The next chapter shows the used datasets and outlines the projec-tion method for synthetic images.
2. STUDY REGION & DATA AQUISITION
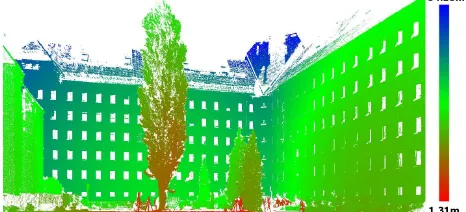
For investigation purposes, two point clouds of different build-ings belonging to Technische Universit¨at Dresden are used: the principalship (projected coloured point cloud data, figure 2) and the H¨ulssebau, the location of the Institute of Photogrammetry and Remote Sensing. Up to this, figure 3 shows the projected intensity values of the point cloud data due to their distance con-cerning the re-projection centre.
Figure 2: Synthetic image of principalship. Input data: coloured point cloud.
Figure3: Distanceimageoftheprojectedpointcloudfromthe TU-Dresden’sH¨ulssebau. Distances belongfrom3Dpointsto theprojectioncentre.
There-projectionbases onthecommoncentralperspective(see equation2and3inchapter4).Usingsuchacentralperspective withoutfurtherinvestigationsleadstotransparentforeground ob-jects(likewallsor trees). Pointcloud dataare no continuous representationofascene,therearespacesbetweenthemeasured points. Thesespacesare adoptedby there-projection and will
lead to pixels without information inside the foreground objects.Theseinformationgapswillbefilledwithinformation of background pixels. Therefore, the mentioned re-projection will show strong image noise. To detect falsely background information inside foreground objects, resulting from this noise, a pyramid approach is used. It can be simplified described as inflating the re-projected points to create continuousimage areaswhichareusedfornoisereductionand to provide homogeneousimage areas. Thetreein the patioof buildingH¨ulssebau(figure3)showstheresultoftheapproach. Thereareblankpixelsinsidethetreewhichwouldbefilledwith pixels from the wall behind the tree.But thanks to the filter method,thepixelsinsidethetreeareleftblank.
Fortheimageacquisitionofrealimages,theAndroidsmartphone Samsung GalaxyS5isused, providinga16 MPcameraand a pixelsizeof1.12µm(GSMArena,2016).However,aresolution ofabout3MPisusedwhichisacompromiseinthelevelofdetail andlowerresolutionrespectingthesyntheticimages.
3. LINEEXTRACTIONFROMSMARTPHONEAND SYNTHETICIMAGES
There are threeessential steps forthe extractionof lines from camera and syntheticimages. Firstly, the edge points in both imagetypesaredetected,whichisdescribedforthesmartphone and syntheticimages in chapter3.1and 3.2. Thesecond step comprisesthesegmentationoftheedgepointstogetlinearly ar-easofpotentialedges(chapter3.3). Finally,alinearregression bythemethodofleastsquares(Niemeier,2008)isusedforthe calculationofthelineparametersfromeachsegment.
3.1 SmartphoneImages
Thereareseveralapproachesforsolvingthetermofimageline extraction. Inthiscase,anadaptedcompassedgedetectorusing Prewittkernels(Prewitt,1970;implementedinCatalano,2016)is applied.Disturbingimagesignals,likeedgesofroofingtiles,are reducedbytheapplicationofabilateralfiltertechnique(Tomasi &Manduchi,1998;implementedinBradski,2000)priortothe edgedetection.
The edgedetection uses commonstructure elementsto get di-rected gradients. For the gradient, referring to the north, the followingkernelisused:
For all other directions, thekernelnorthhas to be rotated in the
specified way. Hence, by a rotation about 45 degrees to the east, the northeast kernel is defined by:
kernelnortheast=
In sum there are eight gradients, pointing clockwisefrom the northtothesouthandbacktothenorth.
The gradient,which provides the highest value on the current pixel,isusedtomaphisgradientdirectiontothe currentpixel. Therefore, each edge point gets additional data for his edge direction.
Akeyadvantageofthemergingandextractionofedgedirection isthattheadopteddirectionfromeachedgepixelcanbeusedfor thesegmentation.Furthermore,athreshold,appliedbythemerge ofkernelsorrathergradientsisusedtoreduceimagenoise.
3.2 Syntheticimages
Thereareseveralwaystodetectlinesinthe3Dspace. As sup-posedinMeierholdetal.(2008)distanceimagesofferthe possi-bilitytodetectedgepointsbycheckingtheirdifferencesin dis-tancerespectivelytotheprojectioncenter.Nevertheless,thismay leadtofalseedgepointsincaseofplaneswhichpoint perspec-tivallyindepthdirection. Beckeretal.(2004)presentaline de-tectionapproachthatusestheintersectionofplaneswithinthe pointcloud. Forthis,3Dpointsbelongingtooneplaneare in-vestigated.Byaleastsquareapproach,theresultingplaneis cal-culated.Unfortunately,thisrobustmethodisverycomputational intensiveandthedetectionofpointsbelongingtooneplaneisa considerablechallenge.
Inthefollowing,anadditionalextractiontechniquefor3Dlines duetosyntheticimagesisexplainedwhichuses3Dinformation of eachre-projected pointand the same four gradients as de-scribedinchapter3.1. Insteadofgreyvaluesofthere-projected neighbouringpixels(dependingonthespecifiedg radient direc-tions), their3D informationisusedto indicatepixels asedge points.
Fortheirdetermination,allpixelsalongtherespectivedirection areobservedregardingtheirdirectlyadjacentpixels.
Duetothecurrentconsideredpixelanditsbothneighboured pix-elsalongone gradient, thereare three3Dpoints thatdescribe two3Dvectorsintheobjectspace. Edgepointsaredetectedby checkingtheanglebetweenthesetwovectors.
Bothvectorswillintersecteachotheratanangleofabout0or 180degrees,incaseofbelongingtooneplane. Otherwise,the anglewilldifferupto30orrather150degrees.
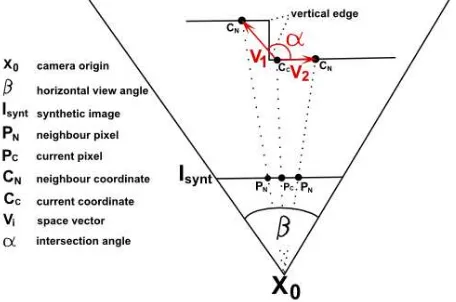
Figure4:Schematicvisualisationof the edgedetectionapproach
Figure4exemplaryoutlinesthe mentionedanglebetweentwo vectorsofonegradient.Thefigureshowsthehorizontalgradient fromwesttoeastintheimageastheprojectionofIsyntandthe
correspondingverticaledgeintheobjectspace.Eachpixel(Pi)
in Isynt hasadditional3Dinformation(Ci)whichwillbeusedto
constructvectorsinspace.Theseredmarkedvectorspointfrom thecurrentpixeltothewesternandeasternadjacentpixelatan intersectionangle≤180 degreesandthustheyrefertoanedge
for the horizontal image gradient.
Other image gradients represent space vectors which point to edges by intersection angles ≤ 180 degrees too. The pixels re-garding the north-south gradient describe two vectors with an in-tersection angle of about 180 degrees. Therefore, the vertical im-age gradient does not indicate an edge in the mentioned space. Obviously, the vertical edges in space can be mapped to their re-spective vertical image gradients on condition of "all gradients point to edges, except one". That gradient, referring to the ex-cepted one and thus fulfil this condition, is taken as the direction of the currently considered edge pixel.
Theseedgepixelsdirectionsareusedtoimprovetheoutput im-agebymorphologyorso-calleddirectionalhistograms. Forthe firstone,amorphologicclosingwithadirectedlinestructural el-ementisappliedwhichcombinespoints next toeachotherinto oneline.
Thehistogramfiltersnoisebyindicatingthemaindirection in-sideanimagearea.Tosolvethisissue,theimageisclusteredin sub-images,wheretherelatedhistogramiscalculatedby count-ingpixelsofthesamedirection. Thishistogramshowsthemain directionbythebinwiththemostentries. Noiseisindicatedby binswithcountslessthanathresholdregardingthemain direc-tion. Theresultfromthishistogramfilterisshowninfigure5, withempiricalestimatedvaluesforthesubimagedimensionof 30by30pixelsandathresholdof60%toindicatenoise.
Figure 5: Result before (top) and after histogram filtering (be-low) for the point cloud from the principalship. The different directions of edge points are drawn in different grey values.
Beside the angle threshold, a second parameter is used which de-scribes the distance between two neighbouring pixels along one gradient. A step size, defined by the distance from a re-projected pixel to its origin, allows the adjustment of fixed distances in the object space in relation to their neighbours. Considering that, an empirical estimated value of about 7 cm is used. It is necessary to adjust the pixel size for re-projection purposes regarding the pixel-to-re-projection centre distance. The in this way adjusted pixel size is used to get an approximation of the pixel count, rep-resenting the 7 cm in the image with respect to the pixel’s dis-tance.
The adjustment is done with the aid of the re-projection pixel size, the pixel-to-re-projection centre distance and the intercept theorem. The re-projection use a pixel size given in 1 m dis-tance, because of formula simplification. Considering that, the pixel size of the whole image with a pixel-to-re-projection centre distance of 1 m is given asps, the intercept theorem provides:
ps·W/2 1[m] =
psd·W/2
where psd=adjustingpixelsize
d⊥= distancefromtheimageplane
attheadjustingpixeltothecameraorigin. W =imagewidth
Furthermore, the intercept theorem describes the connection be-tweend⊥and the distance between the re-projected point (pixel) and its (synthetic) origin. Thus, the adjusted pixel size concern-ing the current pixel is calculate by:
psd=ps·
d p
1[m] + ˜c2+ ˜r2 (1)
with d= distance from pixel to origin [m] ˜
c= column of the pixel with the origin of the image system in the image centre [m] ˜
r= row as above
3.3 Segmentation
The segmentation for grouping edge pixels to line segments com-prises two steps.
First, all neighbours with the same direction are grouped in seg-ments by starting at one edge pixel going to the next neighbour in edge direction (figure 6). In case of non-existing neighbours with respect to the current direction, or deviating directions of the adjacent neighbours, the segment is complete.
Figure 6: First segmentation step. Left: coloured starting pixel to each segment. The arrows show the direction for corresponding neighbours. Right: resulting segments
The second step involves the combination of neighbouring seg-ments pointing in the same direction. For the indication of neigh-bouring segments, their bounding boxes are calculated. After-wards the bounding boxes are checked for intersection. In that case, two pixels of these segments are analysed for contingents. To reduce noise, another histogram filter approach is applied re-garding the length of the estimated segments, which are defined by the diagonal of the segment bounding box. Further on, the histogram is calculated in a fixed range, for example from zero to a threshold with respect to the longest segment. Subsequent to the calculation, all segments smaller than the length, defined by the maximum bin of the histogram, will be deleted.
Empirical estimations show that an range of 0 to 15 % of longest segment reduces noise and vegetation (figure 7). Furthermore, a range of 15 - 50 % keeps only outer building edges. Conse-quently, the filter approach offers the possibility for handling the level of detail by moving the calculation interval.
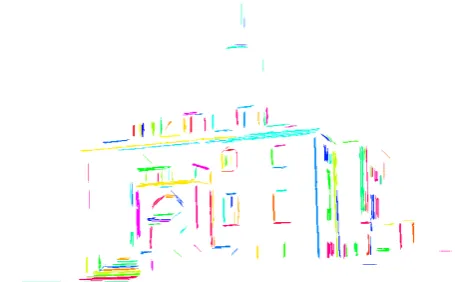
Figure7: Segmentationresultinrelationtofigure2 ,e ach seg-mentisdrawninadifferentcolour.
4. BRUTEFORCEMATCHING
Thematchinglooksforthebestapproximationoftheimage cor-relationbyre-projecting3Dinformationfromthepointcloudto eachpossiblecamerasystemand detectsthehighestcorrelation point.Theorientationishandledasafixedvalueconsideringthe condition that smartphone MEMSs have a higher degree of accuracycomparedtosmartphoneGNSSsensors.
Todelimitthecorrelationoperation,theaccuracyparametersfrom smartphonemeasurementsareusedtodetermineacorrelation in-terval. Theintervallimitstherangeofpossiblepositionsof re-projectioncentres. Furthermore,theintervalisgeneralisedbya fixednumberofpointsoneachcoordinateaxisintheglobal co-ordinatesystem,togetafinitenumberofcorrelationpoints(for example5pointsoneachaxiswillcreate125correlationpoints andfurther125possiblecamerasystems).
Prevailingsmartphonesensorsareusedtogetapproximationsof theuser’sandhencehiscamera’spositionandorientationin con-siderationtoageoreferencedpointcloud.Theseapproximations serveasinitialparametersforthecorrelation. Withhelpofthe definedinterval,thecorrelationleadstomoreappropriate approx-imationsfortheresectionthanthesensorvaluesonly.
Thetransformationof3Dinformationtothecamerasystem,and sofartoonecorrelationpoint,isdefinedby(Szeliski2010):
~ R = rotation matrix from the
global coordinate system (GLCS) to the camera coordinate system (CMCS) ~
Xg= 3D point in the GLCS
~
X0= camera position in the GLCS
~
Xgis calculated from the synthetic image by an interpolation of
line points near to the re-projected segment point. The initial values forRand X~0 are delivered by the smartphone sensors.
The interior orientation (xh, yh, c) is estimated from the image
dimension and the half of the horizontal view angle (H):
xh=columns·0.5
yh=rows·0.5
c=columns·0.5 tanH
For the line matching purpose in relation to the synthetic and the smartphone image the following linear equation is used:
~g(t) =~a+t·~b (4)
with ~a= starting point of the line ~b= line direction
~aand~bare calculated using two re-projected points from the cor-responding 3D line. Therefore, the 2D information from the pri-mary re-projected point is used for the determination of~a. The difference of the first and second re-projected point determines the vector~b.
For the lines in the smartphone image the homogeneous linear equation is used with:
0 =a·x+b·y+c (5)
The parameters a,b and c are acquired segmental by the least square regression. This equation can be transformed in the lin-ear equation 4 using two points of the same line and calculating ~aand~bas described above.
Corresponding lines have to fulfil two conditions: First, the line directions have to be equal, which is checked by their scalar prod-uct. For lines whose normalized vectors~bintersect each other at an angle near to 0 or 180 degrees, the scalar product has to be close to±1.
For the second condition, the starting point of an observed line refers to an element of its surrounding lines (solve equation 5 for the starting point).
With the coordinates from one 2D point (x,y) and the considered line parameters (a,b and c) the right side of equation 5 calculates the distance from the point to the line which helps to assess the quality of the line match.
This assessment is done by the distance of two lines, which is calculate for parallel lines (whose vectors~bare equal), whereby the lowest distance indicates the best match.
All lines are matched pairwise in each correlation step. For the correlation coefficient, the mean value of all matching distances is calculated. The minimum mean value marks the maximal corre-lation coefficient and thus the best fitting correcorre-lation point, which indicates the final matched camera position. In conclusion, the correlation gives the best approximation for projection parame-ters and line matches.
5. RESULTS
Chapters 5.1 and 5.2 show the results from line extraction and matching through each examples of TU Dresden’s H¨ulssebau and principalship, as well as the prospected future work.
5.1 Line Extraction
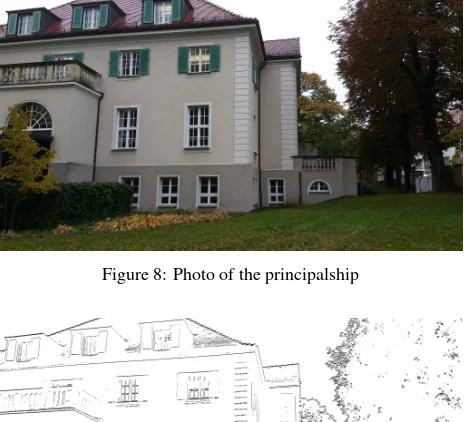
Figure 8 shows the smartphone-taken image of TU Dresden’s principalship. Additionally, figure 9 presents the edge image af-ter application of the modified Prewitt operator. The threshold for kernel merging is set to a grey value of 100, which shows the best compromise regarding noise reduction and edge retentions.
Figure 8: Photo of the principalship
Figure 9: Edge image after application of the modified Prewitt operator (chapter 3.1)
Obviously, the application of Prewitt’s operator detects a consid-erable amount of the building’s main edges and is less influenced by so-called edge noise due to vegetation.
The directions for the edge points, detected by modifications (chap-ter 3.1) coincide with the direction of detected lines in the image (e.g. horizontal lines in the image lead to edge points which adopt the horizontal direction). Unfortunately, Prewitt’s edge detection fails in case of edges with low contrasts which is a common prob-lem in several edge detection approaches. These edges are de-tected by their geometric information due to their position within the point cloud (figure 5).
In practice, the best results are produced at an angle threshold of 30 degrees, whereby space vectors that intersect each other at an angle of about 30 to 150 degrees mark an edge. Furthermore, the use of a minimal distance in relation to two neighbouring pixels referring to one gradient of about two pixels reduces noise.
two neighbouring segments should be enhanced. The clustering needs control by a distance parameter for the neighbourhood of two segments.
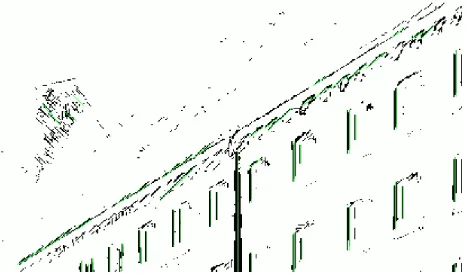
Figure 9: Edges detected from the re-projected point cloud data of building H¨ulssebau.
Figure10:DetailimageoftherightwallofbuildingH¨ulssebau. Greenlinespointtotheresultsafterapplicationoftheregression task.
5.2 Matching
Figure11showsthematchingresultfortheprincipalship. The graphic visualisesthe combined startingpoints ofthe matched lines. Theempiricalestimatedprojectionparameters pointout thatasuitablematchingresultcouldbeachievedby adistance lessthan20 pixels. Theprosandconsregardingthe matching becomevisiblealongthematchedroofedges.Oneadvantageis plainto see: the linearequation hasno limitationsin terms of the line lengths. Thus, the algorithm offers the possibility for theregistrationofseveralsegmentstooneconnectedline,which supports the handling of concealments. Shortcomings are noticeableduetodoublematchings(liketheroofedgefromthe principalshipinsidethepointcloudimagewhichisneartothe
roof edge in the acquired image and thus matched to this). Fur-ther investigations will handle this issue by an additional check of the closest matches. For concealments, the behaviour of the line parameters needs more investigations. If these parameters are within a previous defined threshold interval, a double match is probably a match of two parts of the same line.
To verify the influence of projection parameters to the correla-tion, two synthetic images are used. Their projection parameters are known and therefore the influence of false initialisation points can be examined.
Empirical tests show that if the orientation (initialisation of the rotation matrix) equals to true values, the correlation should pro-vide suitable matches. However, deviations in one single orienta-tion angle of about 3 degrees, influence the correlaorienta-tion procedure in a negative way and probably lead to false matches if these de-viations are not taken in consideration.
Furthermore, it is recommended to apply the distance calculation in object space (to prevent image scale dependencies) with a re-constructed plane from the imaged lines and the 3D lines from the point cloud. For plane reconstruction at least three points are sufficient and comprises e.g. the projection centre and two points of one imaged line.
6. CONCLUSSIONS
This paper presents a algorithm for the matching of captured and synthetic images, derived from a re-projected point cloud regard-ing a conceived re-projection centre which is almost conform to the camera’s projection centre. The approach comprises line extraction methods for both image types. Afterwards, the line matching depends on projection parameters estimated by a brute-force correlation.
The line extraction works with intensity point clouds as well as coloured point clouds. With the aid of the point’s geometric infor-mations, edges could be estimated which will be unrecognisable by common edge detection approaches in case of real images be-cause of low contrasts. Histogram filters are used to optimize the edge images or define a relative range of lengths where the used segments have to lay inside. Thus, the histogram filter defines the level of detail in the resulting edge image and the line matching uses the main edges only.
Future works will enhance the extraction process in case of edges pointing in depth direction by further investigations regarding the neighbourhood of segments.
Currently, the geometric matching gets best results including ap-proximated position and orientation values for the captured im-age. Moreover, for more robustness due to roughly approximated
input parameters, an additional window-based correlation proce-dure is used but more investigations in terms of the orientation could provide enhancements concerning this topic too (e.g. by definition of correlation intervals with more than three dimen-sions). Otherwise, a correlation which refers to the orientation and line directions parameters only, could be done before corre-lating their positions.
To eliminate the influence of the image scale, the calculation of the distance between two lines has to be done in the 3D space.
For structure influence reduction and line closeness, the main edges (like the longest lines) should be used for the matching only and could be combined with the histogram filter method for a so-called pyramid matching. The first level of the pyramid will be given by matching the longest edges. The resulting image po-sition and orientation will be refined by invoking further lines.
References
Becker, R., Benning, W. and Effkemann, C., 2004. Kombinierte auswertung von laserscannerdaten und photogrammetrischen aufnahmen. In:Zeitschrift f¨ur Geod¨asie, Geoinformation und
Landmanagement, 5/2004, pp. 347-355.
Bradski, G., 2000. The opencv library. In:Dr. Dobb’s Journal of
Software Tools, 25(11), pp. 120-126.
Catalano, D., 2016. Catalano-framework. https: //github.com/DiegoCatalano/Catalano-Framework (06 Apr. 2016).
GSMArena, 2016. Samsung galaxy S 5 datasheet.http://www.
gsmarena.com/samsung_galaxy_s5-6033.php (06 Apr.
2016).
Meierhold, N., Bienert, A. and Schmich, A., 2008. Line-based referencing between images and laser scanner data for image-based point cloud interpretation in a cad-environment. In: The International Archives of Photogrammetry, Remote
Sens-ing and Spatial Information Sciences, Beijing, China, Vol.
XXXVII, Part B5, pp.437-443.
Meierhold, N., Spehr, M., Schilling, A., Gumhold, S. and Maas, H.-G., 2010. Automatic feature matching between digital im-ages and 2D representations of a 3D laser scanner point cloud.
In: The International Archives of Photogrammetry, Remote
Sensing and Spatial Information Sciences, Newcastle upon
Tyne, UK, Vol. XXXVIII, Part 5, pp. 446-451.
Niemeier, W., 2008. Ausgleichungsrechnung - Statistische
Auswertemethoden. Walter de Gruyter GmbH & Co. KG.,
Berlin.
Prewitt, J. M. S., 1970. Object enhancement and extractionin
Picture processing and Psychopictorics. Academic Press, New
York, pp. 75-150.
Szeliski, R., 2010. Computer vision: algorithms and
applica-tions. Springer Science & Business Media, New York.
Tomasi, C. and Manduchi, R., 1998. Bilateral filtering for gray and color images. Proceedings of the 1998 IEEE International Conference on Computer Vision, Bombay,
In-dia. http://homepages.inf.ed.ac.uk/rbf/CVonline/