ASSESSMENT OF THE UTILITY OF THE ADVANCED HIMAWARI IMAGER TO
DETECT ACTIVE FIRE OVER AUSTRALIA
B. Hallya, b, c,∗, L. Wallacea, b, K. Reinkea, b, S. Jonesa, b a
School of Mathematics and Geospatial Science, RMIT University, Melbourne, Australia bBushfire and Natural Hazards Cooperative Research Centre, East Melbourne, Australia c
Faculty for Geo-Information Science and Earth Observation (ITC), University of Twente, Enschede, Netherlands
Commission VIII, WG VIII/1
KEY WORDS:Himawari, fire detection, thermal imaging, temporal analysis, Kalman filtering
ABSTRACT:
Wildfire detection and attribution is an issue of importance due to the socio-economic impact of fires in Australia. Early detection of fires allows emergency response agencies to make informed decisions in order to minimise loss of life and protect strategic resources in threatened areas. Until recently, the ability of land management authorities to accurately assess fire through satellite observations of Australia was limited to those made by polar orbiting satellites. The launch of the Japan Meteorological Agency (JMA) Himawari-8 satellite, with the 16-band Advanced Himawari Imager (AHI-8) onboard, in October 2014 presents a significant opportunity to improve the timeliness of satellite fire detection across Australia. The near real-time availability of images, at a ten minute frequency, may also provide contextual information (background temperature) leading to improvements in the assessment of fire characteristics. This paper investigates the application of the high frequency observation data supplied by this sensor for fire detection and attribution. As AHI-8 is a new sensor we have performed an analysis of the noise characteristics of the two spectral bands used for fire attribution across various land use types which occur in Australia. Using this information we have adapted existing algorithms, based upon least squares error minimisation and Kalman filtering, which utilise high frequency observations of surface temperature to detect and attribute fire. The fire detection and attribution information provided by these algorithms is then compared to existing satellite based fire products as well as insitu information provided by land management agencies. These comparisons were made Australiawide for an entire fire season -including many significant fire events (wildfires and prescribed burns). Preliminary detection results suggest that these methods for fire detection perform comparably to existing fire products and fire incident reporting from relevant fire authorities but with the advantage of being near-real time. Issues remain for detection due to cloud and smoke obscuration, along with validation of the attribution of fire characteristics using these algorithms.
1. INTRODUCTION
The use of remote sensing satellites for detecting and imaging natural disasters has steadily increased with the availability and reliability of sensors in orbit. The ability of emergency respon-ders to view objective information about the location, size and impact of an incident enables timely response and accurate as-sessment, with benefits such as advanced warning of the impend-ing event, the ability to prioritise resources to mitigate impact where feasible, and enabling planning of relief measures in the aftermath of an event. Remotely sensed information can also be tied to models to simulate the incident at hand, which allows for more accurate estimates of the change of an incident over time.
A common way to determine sudden change in an environment caused by an external influence can be through the use of thermal infra red imaging. Changes to the thermal signature of the land surface can be caused by a number of disaster types - flooding will cause a flattening of temperature response in a diurnal cy-cle, with cooler high temperatures and warmer minimums, and fire will cause temperatures to increase, with a significant impact in the medium wave infra-red due to fire temperatures and their corresponding blackbody radiation outputs. These changes can occur rapidly with the spread of the event, so they can easily be used to determine the extents of the affected area.
∗Corresponding author - [email protected]
1.1 Identifying fire
Traditional methods for the detection and monitoring of fire events have generally consisted of in-situ fire detection personnel and re-ports from members of the public. These methods tend to detect the initial fire activity very quickly as smoke from fire events can be spotted easily from a distance. Shortcomings of these meth-ods include where a fire is in a remote area or in rugged terrain, and where weather conditions such as cloud mask visual identi-fication of smoke. These information sources also provide poor information of the ongoing nature of fire events - subjective re-ports of fire extent and intensity can vary between observers, and terrain and vegetation may mask observation of the full extent of fire through over or under reporting. Monitoring of fire events can also take place from airborne platforms, and while these are very effective at collecting information about fire extent, the availabil-ity of aerial devices, and the cost and risk involved to personnel and equipment can limit or preclude their use in many situations.
activ-ity and spread can occur, leading to better decisions about the mitigation of fire along with disaster relief planning.
Current algorithms for the detection of fire in the environment are based on either empirical thresholds applied to brightness tem-peratures of middle infra red bands of satellite sensors, or more complicated contextual algorithms based on the comparison of potential fire pixels to their surrounds (Roy et al., 2013). Cur-rently the use of contextual algorithms is considered state of the art, and when tuned correctly produce significantly higher rates of detection, especially for smaller, low intensity incidents (Li et al., 2013). Contextual algorithms for fire rely on deriving the fire pixel’s radiant output in comparison to what the equivalent background temperature output should be, generally based upon the brightness temperature of surrounding pixels. A number of factors can lead these techniques to producing less than desirable results - surrounding pixels can be fire affected in themselves, spreading the area required to acquire fire-free pixels for the algo-rithm calculation; the point spread of the sensor can lead to false detection in adjacent pixels; and the adjacent pixels used to cal-culate the theoretical background temperature of the target pixel may have significant differences in landform, surface emissivity, land cover percentage and solar reflectivity, leading to large dif-ferences between the actual and calculated fire background tem-peratures from these algorithms.
1.2 Himawari AHI-8 sensor
The Japan Meteorological Agency (JMA) launched the Himawari-8 geostationary satellite, the latest in their line of MTSAT plat-forms, in October 2014. The sensor onboard this platform is the Advanced Himawari Imager (AHI-8), which delivers 16 bands of imaging information at ten minute intervals, and is used primarily for weather forecasting and monitoring. The sensor has coverage of the area bounded by western India, Hawaii, Eastern Antarc-tica and Eastern Siberia. Generally there are two housekeeping timeslots for each day, at 0240 and 1440 UTC, meaning a maxi-mum of 142 images are obtained on any one day. Station keeping for navigation and image calibration purposes occurs on a reg-ular basis, with announcements of these activities on the Japan Meteorological Agency mission website.
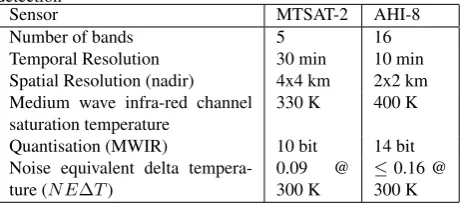
Of importance for event monitoring are the many bands of this sensor located in the medium wave and thermal infrared, along with visible and near-infrared imagery, which is supplied at a spatial resolution of 2km at nadir (0.5km for one visible chan-nel). This is a vast improvement of performance compared to the previous sensor MTSAT-2, both in the spatial and spectral resolution, and refresh rate. The sensor also has far higher satu-ration temperatures in the medium wave infrared Band 7, which enables the attribution of larger fires than its predecessor, along with greater radiometric depth and higher signal to noise ratios for the corresponding bands. Images have been available from this sensor since JMA switched from MTSAT-2 in July 2015. A comparison showing the improved abilities of AHI-8 compared to MTSAT-2 can be found in Table 1.
This ability to monitor change rapidly increases with the use of geostationary imagers, which can provide near real-time updates of incidents from a fixed viewpoint. Most remotely sensed im-ages used for this kind of disaster mapping and planning in the past have come from low earth orbiting satellites. These have the advantage of being much closer to the earth’s surface, with the benefits of a higher spatial and radiometric resolution than geostationary satellites viewing the same scenes. The major dis-advantage of the low earth orbit systems in use are their temporal availability - the systems currently in place can supply imagery
Table 1: Comparison of MTSAT-2 and AHI-8 sensors for fire detection
Sensor MTSAT-2 AHI-8
Number of bands 5 16
Temporal Resolution 30 min 10 min
Spatial Resolution (nadir) 4x4 km 2x2 km Medium wave infra-red channel
saturation temperature
330 K 400 K
Quantisation (MWIR) 10 bit 14 bit
Noise equivalent delta
tempera-at a revisit rtempera-ate of no better than four hours, leaving large gaps in the supply of images, especially for highly dynamic systems such as fire. The use of geostationary sensors with a higher revisit rate can overcome the issues caused by lower spatial and radiometric resolution by simply supplying data more often. Geostationary sensors also have the advantage of viewing incidents from the same viewpoint over time, meaning less geometric correction of images is required, leading to far easier analysis of change over time.
All of these improvements in sensor ability and availability con-tribute to improved ability to image change in the environment and monitor it in near real-time. The AHI-8 sensor is also sim-ilar in construction to the ABI system that will be deployed on the third generation GOES satellite platform, which is due for its first launch in October 2016, and initial findings from the images produced by AHI-8 will be able to be applied almost directly to ABI imagery from launch.
This paper looks to evaluate the ability of the AHI-8 sensor to detect initial fire activity in the environment, with a specific fo-cus on the application of a temporal-based algorithm, rather than the current contextual-based algorithms used by polar orbiting sensors. The paper will describe the importance of background temperature in the determination of fire characteristics, introduce a new method of defining background temperature for a specific pixel, and demonstrate some initial findings from its application.
2. LAND SURFACE TEMPERATURE DETERMINATION
A method to circumvent this issue with regard to fire attribution is to derive the background temperature of the target pixel using a temporal based method to model a diurnal temperature cycle (DTC). This method usesa-prioriknowledge of a pixel’s DTC over a time period to project a background temperature of a tar-get pixel if no affecting phenomenon was present. With the addi-tion of geostaaddi-tionary sensors in recent years, the ability to utilise algorithms with a temporal component for land surface tempera-ture (LST) determination has improved. Modelling of the DTC for LST from geostationary images has been undertaken using absolute descriptive models (G¨ottsche and Olesen, 2001, Jiang et al., 2006), Reproducing Kernel Hilbert Space models (van den Bergh et al., 2006, Udahemuka and Bergh, 2008), Fourier anal-ysis (van de Kerchove et al., 2013), Artificial Neural Networks (Voyant et al., 2014) and Kalman filtering (Masiello et al., 2013, van den Bergh et al., 2009). Utilisation of a single value decom-position (SVD) method, such as that proposed in (Black and Jep-son, 1998), has been applied by (Udahemuka and Bergh, 2008) and extended by (Roberts and Wooster, 2014) as part of a robust matching algorithm with significant improvements in the ability to handle temperature anomalies in the observation data.
2.1 Robust Matching Algorithm
This study make use of the robust matching algorithm described in (Roberts and Wooster, 2014), which adapted a form of single value decomposition described in (Black and Jepson, 1998) in-clusive of a method to reduce the influence of outliers on the de-rived DTC. This method isolates 10 contamination-free DTCs in a 30-day period for use in a SVD, which, depending on the loca-tion, prevailing weather conditions and persistent thermal anoma-lies, may not always be achievable for every pixel in a dataset. (Roberts and Wooster, 2014) utilised a database of contamination-free DTCs to populate the training dataset of a pixel which suf-fered from a deficit of its own DTCs for the SVD process. De-pending on the number of supplemental DTCs used, coupled with the potential variation of the supplemental pixel’s nominal DTC from the target pixel, using these supplemental DTCs to fill out an SVD could introduce error into the principal components of the DTC defined by the SVD, with subsequent errors in the fitting process.
2.2 Wide Area DTC Derivation
A brightness temperature return in the medium wave infra-red consists of two main components - reflection of solar radiation from the earth’s surface, and emission of blackbody radiation from the surface due to temperature. The skin surface temper-ature of the earth is influenced by a number of factors - rain low-ers surface temperatures very effectively, convective cooling and heating due to air masses can influence surface temperatures, and percentage land cover can affect the magnitude of temperature change - but the most notable influence is heating by solar radia-tion.
For an area of given latitude, the influence of solar radiation in both reflection from the surface and the heating of the surface should be similar for a time period given that these areas receive similar amounts of solar radiation (Bojanowski et al., 2014). The method outlined in this paper seeks to utilise this relationship to derive a wide area training DTC dataset for a band of latitude, which can then be applied to raw temperature data from pixels within this band of latitude to produce a fit for the DTC on a given day.
3. METHOD
3.1 Derivation of Training Data
To provide an estimate of a DTC for a specific day we will look to gather information about the pixel’s ideal DTC behaviour in the previous seven days. This method will focus primarily on Band 7 brightness temperatures produced from AHI, as positive anoma-lies in this band are generally indicative of fire. The brightness temperature values for a pixel are extracted from the day’s im-ages, and these brightness temperatures are standardised for the day (mean = 0, standard deviation = 1). The pixel’s latitude and longitude are used to provide both the latitude of the estimated DTC band and the time offset from this series that needs to be applied to align local solar noon with the estimated solar noon, as in Eq. 1:
ts=U T Cimage+longitude×240(secs) (1)
The dataset this method has been applied to consists of the conti-nent of Australia. The width of the landmass varies up to a max-imum of 39°of longitude, approximately corresponding to two hours and twenty minutes of elapsed time. For this study, a cell size of 0.25°has been chosen, meaning that each cell roughly cor-responds to one minute of solar time difference from an adjacent cell on the same latitude. If the maximum number of AHI images are available to be used in this process, around 13 estimates of the local temperature at solar timetscan be utilised in the broadest areas of the Australian continent.
For each image in the training data set, an ocean mask is applied to the original image, the brightness temperatures of pixels cor-responding to each 0.25°cell are grouped together, pixel values below 270K are discarded to eliminate opaque clouds, and a me-dian value is taken as an aggregation of the remaining non-cloud pixel values. The cell median temperatures are standardised in a similar way to the pixel for each day in the training data set. Each of the cells at each image is then assigned an apparent solar time, as in Eq. 1. With this time value assigned cells in the latitudinal set can be related to each other. At this stage all cells in the latitu-dinal band for all images in the set are merged together. As there are generally multiple returns at each timets another median is taken to provide one value for each time in the series. A Butter-worth low pass filter with a cut off frequency of six hours is then applied to the time series to eliminate standing variations in the training data.
3.2 SVD of individual pixels
In a similar fashion to the training data set, each pixel brightness temperature value in the DTC is assigned an apparent solar time given by Eq. 1. These times are rounded to the nearest minute to more easily correspond with the training dataset. The time off-set between the first brightness temperature measurement of the pixel and the training data is calculated, and the values are ex-tracted from the training dataset corresponding to the image times of the pixel dataset. This leaves the training dataset consisting of a number of daily vectors that correspond directly to the times that brightness temperatures were measured for the pixel’s DTC.
Eq. 2:
A=UΣVT
(2)
For a vector of observations from a pixele, an approximation of the DTCe∗can be created from a reconstruction of the prinicpal
components:
e∗=
K X
i=1
ciUit (3)
whereKis the number of principle components used andciis a series of scalar values derived by taking the inner product of the observations from the pixel and the principle components (eTU
).
ciessentially describes the contribution of each of the component vectors inUto the fitted estimate of the DTCe∗.
At this point, to minimise the effects of outliers on the robust determination of the DTCs, a least squares minimisation of Eq. 3 occurs utilising a robust error norm, which identifies outliers that contribute excessively to error:
σ(x, s) = x
2
σ+x2 (4)
xis the value ofe−e∗at timet, andσis a scale factor which can
be reduced iteratively to improve the solution given by the error minimisation. This can lead to the application of an outlier mask
m, such that:
mt= (
1,|et−e∗
t| ≥σ/
√
3
0, otherwise (5)
which leads to the minimisation of the error function E(c)as shown below:
E(c) = N X
t=1
mtρ((et−( K X
i=1
ciUit)), σ) (6)
This process refines the values ofciapplied to the principal com-ponentsUiin order to reconstruct an approximate value foret. At this point outliers from the ideal DTC can be identified and attributed according to their characterstics - whether they area positive or negative anomalies, and whether the change occurs suddenly or gradually over time. The idealised DTC curve can also be subsequently utilised as a state vector for a Kalman filter estimation of DTC for the pixel over subsequent days.
4. CASE STUDY: ESPERANCE REGION FIRES
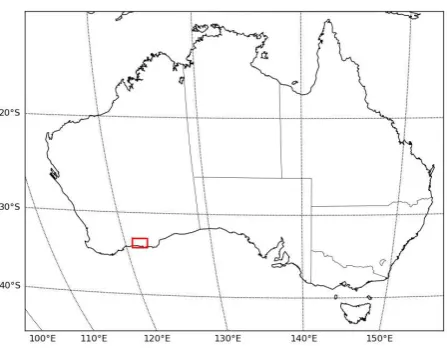
On the 15th November 2015, a fire caused by lightning strikes started in scrub forest near the locality of North Cascade in the Esperance region, around 700km ESE of Perth, Western Aus-tralia (location shown in Figure 1). Two days later on the 17th November, the fire broke containment lines during one of the worst days in recorded history for fire danger in Australia. The fire spread across low scrub forest and wheat fields driven by hot, strong north-westerly winds, stretching almost 90km in length in a matter of hours, before a weak cool change from the south west slowed the fire’s spread significantly. An unrelated fire was also burning to the immediate east of the town of Esperance in Merivale, but being constrained by the coast it did not exhibit the intensity or rapid growth of the North Cascade fire.
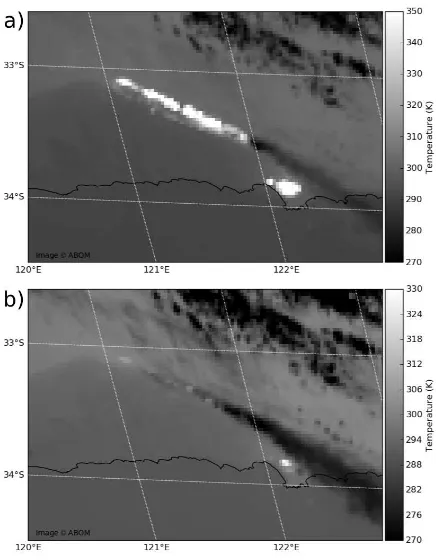
In figure 2, visual inspection of the medium wave infra red Band 7 image from AHI shows the extents and intensity of the later stages of the fire. The fire at this point covered around 1800ha, according to estimates of DFES, the state emergency services or-ganisation. At several points during the fire’s spread, the intensity
Figure 1: Location of case study area, Esperance region, Western Australia
and subpixel area of the fire was such that the Band 7 sensor was saturated, which considering the 400 K saturation temperature of the AHI sensor in this band demonstrates the coverage and inten-sity of the fire. This fire is significant not only for its inteninten-sity and spread rate, but also for the strong smoke output driven by the fire, which caused occlusion of land temperatures ahead of the North Cascade fire and of the fire output of the Merivale fire, which was partially downwind of the main complex. This smoke plume is made evident by the corresponding Band 13 thermal im-age, with the smoke plume measuring up to 30 K lower than the surrounding surface returns.
Given the extreme weather conditions, the remoteness of the ig-nition point of the fire and the subsequent inability to monitor the fire closely from the surface, the AHI images provide regular up-dates of the fire spread throughout the day. Secondary metrics such as rate of spread and fire radiative output are easily derived once an ignition temperature threshold is defined.
To investigate the robust fitting technique, we applied it to a num-ber of pixels both within the fire region and surrounding it for the day prior to the fire and the day of the fire. In figure 3, the robust fitting algorithm reflects the observations well for the anomaly free day on the 16th November, but shows distinct issues with fitting the DTC on the 17th. The normal background on this day suffers from significant occlusion from around midday local so-lar time due to smoke passing overhead, depressing brightness temperatures by up to 10 K below the estimated temperature. This sustained negative anomaly flips around 0815 UTC when the area catches alight, and sustained positive brightness temper-ature anomalies of up to 12 K persist until fire activity subsides with the full onset of a wind change around 1100 UTC. The ro-bust fitting algorithm in this case has overfitted to the diminished smoke affected temperature values, underestimating the surface temperature by up to 10 K. The dashed line here shows the first estimate of ci using only the primary component of the SVD, which shows inflation from the high temperatures detected dur-ing the fire, but nevertheless follows the understood relationship of the DTC shape. Of significance here also to the fitting of the DTC is the change in temperature response to sunlight on the morning after the fire. The accelerated rate of temperature in-crease is due to the dein-creased albedo of the surface after the fire has passed, and this relationship can be discerned from the bright-ness temperature response in the thermal band.
Figure 2: AHI-8 brightness temperature image of the North Cas-cade and Merivale fires, Esperance region of Western Australia, 2015-11-17 1000 UTC (1800 AWST). a) Band 7 - 3.9µm b) Band 13 - 10.8µm © ABOM 2015
an ignition threshold could be considered as a brightness tem-perature of an observation which is 5 K above the fitted DTC. Figure 4 shows the time where Band 7 brightness temperatures first reach this mark in pixels that recorded at least one brightness temperature greater than 335 K on the 17th November. The North Cascade fire shows the expected behaviour early in the day, with flaming pixels at the source detected early, and the initial spread mapped well. Issues with the fitting of smoke to the modelled DTC become apparent here with the false early returns south east of the fire - these are most likely due to gaps in the smoke show-ing the true background temperature at these times and causshow-ing large positive anomalies. The figure also demonstrates the wind change later in the day, with the fire growing in a north easterly direction later in the day. The Merivale fire is also shown here, and due to the local geography there is little deviation to the fire extent with the wind from the north west. This fire finally sees some growth late in the day with the south easterly change in wind. Note that fire temperatures above 335 K are being seen in pixels where the majority of the pixel is water - this suggests that the sensor may have some contamination of adjacent pixels from a point spread effect. More analysis will be required to determine the magnitude of this effect especially in coastal areas.
5. DISCUSSION
Overall, the sensor bands covered in this investigation look to ad-equately characterise fire in its early stages. Given that this case is a rather extreme example, with weather conditions increasing background temperatures well beyond their usual values for this latitude, coupled with low humidity and dry fuel providing ideal conditions for fire spread, the extent and intensity of this event are easy to detect and monitor. This fire also look place in a largely
Figure 3: Robust matching algorithm results for a typical pixel (-35.2583S, 121.4374E) in the North Cascade complex fire 2015-11-16 and 17.
Figure 4: Map of first positive anomaly return for calendar day 2015-11-17 for pixels which recorded a brightness temperature greater than 335 K at any time.
open landscape - the area generally consists of wheatfields and grassland, interspersed with low woody scrubland which is of limited height. Investigations should be made into the initial de-tection of fires which there may be significantin-situobstacles to imaging, such as vegetative canopy cover.
Another element of interest highlighted by this investigation is the effect of smoke on brightness temperatures in the areas ad-jacent to fire. Particulate matter in the smoke tends to reduce the amount of solar radiation reaching the surface(Tarasova et al., 1999), along with scattering the medium wave infrared reflecting from the surface. Fire activity also increases the turbidity of the atmosphere (Kumar et al., 2010), increasing the opacity of the atmosphere resulting in reduced brightness temperatures on the leeward side of fire events. The presence of smoke particulate in the atmosphere also tends to attract moisture to condensate and form clouds, exacerbating scattering further. The reduction of solar radiation reaching the surface can also contribute to a drop in surface temperature and subsequent blackbody radiance of the surface.
oc-clusion have tended to focus on visible and near infra-red wave-lengths. The ability of AHI-8 to provide rapid updates of bright-ness temperature changes downwind of a fire, coupled with in-situsensors of downwelling and upwelling radiance, could pro-vide greater understanding of the effects of smoke on longer wave-length radiation, and subsequently improve the ability to detect fires where aerosol characteristics are known.
The sensor shows great promise with regard to mapping the evolv-ing nature of a fire event. The target fire is quite intense in nature, and coupled with the open landscape, the initial ignition of fires is easy to discern from initial investigations of imagery. The meth-ods used in this paper to map the extents of the fire’s change over time are very crude, and associated issues with smoke and rapid temperature change have manifested in the results derived. Ap-plication of method such as that demonstrated in (Diagne et al., 2010), where differencing of the medium wave and thermal in-frared temperatures is used in conjunction with basic thresholds, should reduce the commission errors in the fitted model caused by spikes such as smoke boundaries.
The use of this adaption of the robust fitting method presented in this study for fire background determination has some advan-tages over previous implementations. Using training DTCs from a thirty day period increases errors in defining the shape of the modelled DTC due to factors such as the solar geometry changes over the time period, changing both the length of day and the to-tal solar radiation input into the system. The precession of the earth’s orbit can also lead to changes in the timing of peak solar radiation for the day. The error budget created by these factors can be minimised by reducing the number of training DTCs used to calculate the modelled DTC, at the risk of introducing errors through a lack of non-cloud influenced training data. In some places it may be impossible to obtain training DTC profiles, such as where there is prevailing cloud cover for significant portions of the training data window, or where there are periodic daily cycles of cloud formation which cause attribution issues during that window. By choosing an aggregation method to create the DTC model, the amount of days required to be sampled can be decreased to get a finer resolution for the precise modelled DTC with less noise than the individual pixel method.
Using the method presented in this paper provides an anomaly free quantification of the typical response curve of a pixel con-tained within a small area of the earth’s surface. This is of course not without its shortcomings. The method does not take into ac-count variations in surface emissivity from pixel to pixel. The land surface emissivity can have a significant effect on the radi-ance emitted from an area given a known temperature. Correction for this could occur using a current model for land surface emis-sivity from another satellite sensor, or work could be completed to adapt a land surface emissivity model for the AHI sensor, at which point a pixel by pixel correction to the modelled DTC could be applied. This correction would have to be generated on a regular basis to account for land use and seasonal change in the environment.
Using this more aggregated model for DTC also eliminates the ability of the robust fitting algorithm to adjust to standing vari-ations in a pixel from an ideal candidate. These could include such things as periodic cloud formation due to weather and to-pography, and shadowing of the pixel from solar radiation due to topography and land cover. Further investigation is required to identify areas that may be affected by such standing anomalies and steps than can be taken to mitigate their effects on overall fire detection accuracy.
Formation of the model is also dependent on the landforms present in the latitudinal band under consideration. The minimum width
of land required to obtain a solution across a full disk image is 2.5°of longitude, and widths of less than 5°of longitude reduce redundancy of measurements and can lead to standing errors in the resultant modelled DTC. Creating cells further away from the satellite nadir can overtly influence the modelled result as well -the limited number of pixel returns from -the cell at -the edge of a full disk can introduce biases especially at times where sun glint may elevate resultant brightness temperatures.
No correction has been applied for sun glint to this model in this study, which may cause heightened brightness temperature re-turns in the medium wave infra red at times where the sensor viewing angle coincides with the specular reflectance of the sun from a horizontal surface, and a correction such as that proposed by (Zhukov et al., 2006) could be applied to each pixel identified as a potential target.
There is significant scope for the expansion of methods used to quantify the land surface temperature included in this paper. The use of a single value decomposition method for the robust fit-ting method tends to amplify the effect of the secondary eigen-vectors in determining the DTC for a day. The single value de-composition process identifies the general shape of the DTC very well within the first eignevector, with subsequent orthogonal vec-tors having eigenvalues generally twenty times lower. Using the weighted norm to reconstruct the DTC tends to treat the influence of the eigenvectors as uniform, and as such tends to provide over-fitted solutions for DTCs on days with large number of cloud and smoke affected pixels. Subsequent work should investigate the use of a technique such as parallel factor analysis such at that discussed in (Abdi et al., 2013), which takes into account the strength of each fitted component in a factored solution. Notwith-standing this, the likelihood of this method providing improved results for the generation of DTCs over a more dynamic method such as Kalman filtering is low, and whilst refinements can be made, this method for determining thermal anomalies works best as a starting point for a filtering based solution.
ACKNOWLEDGEMENTS
The support of the Commonwealth of Australia through the Co-operative Research Centre program is acknowledged. The au-thors would also like to acknowledge the support of the Aus-tralian Bureau of Meteorology, Geoscience Australia, and the Japanese Meteorological Agency for use of AHI imagery associ-ated with this research, along with the Australian National Com-putational Infrastructure for their support with data access and services.
REFERENCES
Abdi, H., Williams, L. J. and Valentin, D., 2013. Multiple factor analysis: principal component analysis for multitable and multi-block data sets. Wiley Interdisciplinary Reviews: Computational Statistics 5(2), pp. 149–179.
Black, M. and Jepson, A., 1998. Eigentracking: Robust matching and tracking of articulated objects using a view-based representa-tion. International Journal of Computer Vision 26(1), pp. 63–84.
Bojanowski, J. S., Vrieling, A. and Skidmore, A. K., 2014. A comparison of data sources for creating a long-term time series of daily gridded solar radiation for Europe. Solar Energy 99, pp. 152–171.
Dozier, J., 1981. A method for satellite identification of surface temperature fields of subpixel resolution. Remote Sensing of En-vironment 11(C), pp. 221–229.
Giglio, L. and Kendall, J. D., 2001. Application of the Dozier re-trieval to wildfire characterization a sensitivity analysis. Remote Sensing of Environment 77(1), pp. 34–49.
Giglio, L. and Schroeder, W., 2014. A global feasibility assess-ment of the bi-spectral fire temperature and area retrieval using MODIS data. Remote Sensing of Environment 152, pp. 166–173.
G¨ottsche, F.-M. and Olesen, F. S., 2001. Modelling of diurnal cy-cles of brightness temperature extracted from METEOSAT data. Remote Sensing of Environment 76(3), pp. 337–348.
Jiang, G. M., Li, Z. L. and Nerry, F., 2006. Land surface emis-sivity retrieval from combined mid-infrared and thermal infrared data of MSG-SEVIRI. Remote Sensing of Environment 105(4), pp. 326–340.
Kaufman, Y. J., Justice, C. O., Flynn, L. P., Kendall, J. D., Prins, E. M., Giglio, L., Ward, D. E., Menzel, W. P. and Setzer, A. W., 1998. Potential global fire monitoring from EOS-MODIS. Jour-nal of Geophysical Research-Atmospheres 103(D24), pp. 32215– 32238.
Kumar, K. R., Narasimhulu, K., Balakrishnaiah, G., Reddy, B. S. K., Gopal, K. R., Reddy, R., Satheesh, S., Moorthy, K. K. and Babu, S. S., 2010. A study on the variations of optical and physical properties of aerosols over a tropical semi-arid station during grassland fire. Atmospheric Research 95(1), pp. 77–87.
Li, Z.-L., Tang, B.-H., Wu, H., Ren, H., Yan, G., Wan, Z., Trigo, I. F. and Sobrino, J. a., 2013. Satellite-derived land surface tem-perature: Current status and perspectives. Remote Sensing of Environment 131, pp. 14–37.
Masiello, G., Serio, C., De Feis, I., Amoroso, M., Venafra, S., Trigo, I. F. and Watts, P., 2013. Kalman filter physical re-trieval of surface emissivity and temperature from geostationary infrared radiances. Atmospheric Measurement Techniques 6(12), pp. 3613–3634.
Roberts, G. and Wooster, M. J., 2014. Development of a multi-temporal Kalman filter approach to geostationary active fire de-tection & fire radiative power (FRP) estimation. Remote Sensing of Environment 152, pp. 392–412.
Roy, D. P., Boschetti, L. and Smith, A. M., 2013. Satellite Remote Sensing of Fires. In: Fire Phenomena and the Earth System: An Interdisciplinary Guide to Fire Science, pp. 77–93.
Tarasova, T. A., Nobre, C. A., Holben, B. N., Eck, T. F. and Set-zer, A., 1999. Assessment of smoke aerosol impact on surface solar irradiance measured in the Rondˆonia region of Brazil during Smoke, Clouds, and Radiation - Brazil. Journal of Geophysical Research: Atmospheres 104(D16), pp. 19161–19170.
Udahemuka, G. and Bergh, F. V. D., 2008. Robust fitting of diur-nal brightness temperature cycle. South African Computer Jour-nal 40, pp. 1–6.
van de Kerchove, R., Lhermitte, S., Veraverbeke, S. and Goossens, R., 2013. Spatio-temporal variability in remotely sensed land surface temperature, and its relationship with physio-graphic variables in the Russian Altay Mountains. International Journal of Applied Earth Observation and Geoinformation 20(1), pp. 4–19.
van den Bergh, F., Udahemuka, G. and van Wyk, B. J., 2009. Po-tential fire detection based on Kalman-driven change detection. In: International Geoscience and Remote Sensing Symposium (IGARSS), Vol. 4, pp. 77–80.
van den Bergh, F., van Wyk, M. A. and van Wyk, B. J., 2006. Comparison of data-driven and model-driven approaches to brightness temperature diurnal cycle interpolation. 17th An-nual Symposium of the Pattern Recognition Association of South Africa.
Voyant, C., Haurant, P., Muselli, M., Paoli, C. and Nivet, M. L., 2014. Time series modeling and large scale global solar radiation forecasting from geostationary satellites data. Solar Energy 102, pp. 131–142.
Wooster, M. J., Zhukov, B. and Oertel, D., 2003. Fire radia-tive energy for quantitaradia-tive study of biomass burning: Derivation from the BIRD experimental satellite and comparison to MODIS fire products. Remote Sensing of Environment 86(1), pp. 83–107.