Estimation of leaf area index using an angular vegetation index based on in situ measurements
and CHRIS/PROBA data
Lijuan Wang1*, Guimin Zhang2, Hui Lin1, Liang Liang1, Zheng Niu3
1. School of Geodesy and Geomatus, Jiangsu Normal University, Xuzhou, Jiangsu, 221116, China
2. State Key Laboratory for Geomechanics and Deep Underground Engineering, School of Mechanics and Civil Engineering, China University of Mining & Technology, Xuzhou, Jiangsu 221008, China
3. The State Key Laboratory of Remote Sensing Science, Institute of Remote Sensing and Digital Earth, Chinese Academy of Sciences, Beijing 100101, China
Keywords: Multi-angular data, LAI, vegetation index, Remote sensing
ABSTRACT:
The Normalized Difference Vegetation Index (NDVI) is widely used for Leaf Area Index (LAI) estimation. It is well documented that the NDVI is extremely subject to the saturation problem when LAI reaches a high value. A new multi-angular vegetation index, the Hotspot-darkspot Difference Vegetation Index (HDVI) is proposed to estimate the high density LAI. The HDVI, defined as the difference between the hot and dark spot NDVI, relative to the dark spot NDVI, was proposed based on the Analytical two-layer Canopy Reflectance Model (ACRM) model outputs. This index is validated using both in situ experimental data in wheat and data from the multi-angular optical Compact High-Resolution Imaging Spectrometer (CHRIS) satellite. Both indices, the Hotspot-Darkspot Index (HDS) and the NDVI were also selected to analyze the relationship with LAI, and were compared with new index HDVI. The results show that HDVI is an appropriate proxy of LAI with higher determination coefficients (R2) for both the data from the in situ experiment (R2=0.7342, RMSE=0.0205) and the CHRIS data (R2=0.7749, RMSE=0.1013). Our results demonstrate that HDVI can make better the occurrence of saturation limits with the information of multi-angular observation, and is more appropriate for estimating LAI than either HDS or NDVI at high LAI values. Although the new index needs further evaluation, it also has the potential under the condition of dense canopies. It provides the effective improvement to the NDVI and other vegetation indices that are based on the red and NIR spectral bands.
1. INTRODUCTION
The Leaf Area Index (LAI) is defined as one half the total green leaf areas per unit ground surface area [1]. It is a parameter determined at the canopy scale, and is an important biophysical parameter in atmosphere-ecosystem interaction, ecophysiology, hydrological and ecological models, and global climate change studies [2]. Quantitative evaluation of LAI can provide information for the evaluation of crop growth, forecast for crop yield, and the possibility of irrigation scheduling information based on remote sensing data [3].
LAI is functionally linked to the canopy structure and canopy spectral reflectance. Its estimation from remote sensing data has prompted many investigations and studies in recent years. The vegetation index method is a common and widely-used approach to estimate LAI by satellite remote sensing observations [4-5]. This method is simple to use, but the empirical relationship between the indices and the LAI varies with vegetation types, space, and time [6], and most vegetation indices have limited potential for the interpretation of LAI for dense canopies. This saturation problem suggests that other elements, such as the three-dimensional distribution of the canopy, should be taken into account [7]. Thus, there is a great need to develop new and more flexible vegetation indices that can be correlated better with LAI, especially for dense canopies to improve the saturation problem.
Single angle remote sensing only gets the information of the vegetation structures in the viewing direction, which is related to the canopy gap fraction, but the other information in the shadows is unknown with this approach [8]. Multi-angular remote sensing, as a new observation approach, adds the angle information, which enriches target information by the different observations directions to the target and thus enhances the potential for the inversion of vegetation characteristic parameters [9]. The use of multi-angular measurements may also
make it possible to distinguish between canopy and understory vegetation because it would be sensitive to vegetation structures and could provide advanced structural descriptions [10]. In recent years, a number of multi-angle vegetation indices
have been proposed (Table 1). Because traditional vegetation indices cannot account for the heterogeneity of vegetation reflection, vegetation indices combined with multi-angular data have the potential to further improve vegetation structure parameters estimation [8].
The main objective of our study is to develop a reliable vegetation index to estimate LAI, especially for dense canopies with higher LAI values. To obtain this index, the Analytical two-layer Canopy Reflectance Model ACRM [16] was used to simulate a series of canopy reflectance with various LAI values and view zenith angles, a new vegetation index, the Hotspot-darkspot Difference NDVI Index (HDVI) was proposed. And then its efficacy was validated in two spatial scales, including ground based in situ measurements of wheat and satellite data based on CHRIS.
Indices Formula
ANIX [11] ANIX
( )
max( ) /
min( )
NDAX [12] NDAX(ANIXredANIXNIR) / (ANIXredANIXNIR)
HDS [13] HDS
( )
(
HS( )
DS( )) /
DS( )
NDVIHD [14]
(
) / (
)
HD NIR red NIR red
NDVI
HS
HS HS
HSNDVIHS
[14]
/ (1
)
Hs nadir red
NDVI
NDVI
HSNHVI [7] NHVINDVI HDS*
2. MATERIAL AND METHODS
2.1. Data from in situ measurements
The in situ wheat data collection was conducted over two years during the growing season, especially in the periods of higher LAI. Data were collected on 17 April, 3 May, 11 May, 20 May, 30 May, 9 June 2004 and on 27 April, 28 April, and 6 May 2011, at the National Experience Station for Precision Agriculture (40°10.69′N, 116°32.39′E), in Changping District, Beijing, China. Measurements were conducted on three species of wheat: wheat 411(erectophile), 9428 (plagiophile) and Cao175 (planophile).
The canopy reflectance was measured at a height of 1.3 m, at a time the weather was fine, between 10:00-14:00, using an ASD FieldSpec Pro spectrometer with a field of view of 25° and in the spectral range of 350-2500 nm. The Bi-directional Reflectance Distribution Function (BRDF) was measured using the spectrum instrument in the principal plane from -60° (back-scattering) to 60° (forward-scatting) at intervals of 10°. The multi-angular observation equipment was also used in previous study[15]. A total of 14 observations were made. Two measurement methods of LAI were adopted. One was the destructive measurement in the 2004 experiments [17]. The procedure was as follows: all the plants within a 0.6×0.6 m2 area were harvested immediately after the spectral measurements. The samples were placed in a cooled black plastic bag and transported to the laboratory for subsequent analysis. Leaves of all the collected plants were combined together to determine the LAI. A subsample of plant leaves (including the non-green elements) was used in the laboratory to measure the leaf area in the laboratory with an LI-COR 3100 area meter (LI-COR, Inc., Lincoln, Nebr.). Measurement with an LAI-2000 (LI-Cor Inc., Lincoln, Nebr.) was another data acquisition approach. Each LAI measurement represented an average of five randomly selected subplots, which were taken
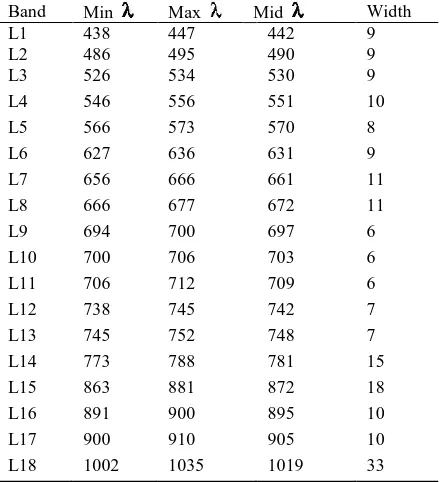
Table 2. Band settings of CHRIS land surface detection mode (MODE3) (unit: nm)
2.2 Satellite data and processing
European Space Agency ESA’s Compact High-Resolution Imaging Spectrometer (CHRIS), a hyper spectral sensor, was launched on the Project On-Board Autonomy (PROBA) platform. One of its objectives is data collection of the BRDF
for a better understanding of the spectral reflectance. CHRIS
acquires surface target radiances with five view angles (0◦, ±36◦ and±55◦) and with five image modes. CHRIS Mode 3 (Land data), collecting images with 18 channels in the visible and near-infrared regions, from 447 nm to 1035 nm, band width ranges from 10 nm to 16 nm in the visible domain, and from 6 nm to 44 nm in the near-infrared domain, has been widely used in the study of terrestrial vegetation (Table 2). This new hyper spectral sensor provides a new opportunity to effectively improve the retrieval accuracy of LAI [18-20].
2.2.1 Study site and field measurements: A CHRIS image set on June 4, 2008 was acquired for this study (Fig. 1). The study region is in Zhangye City, an oasis in the Heihe River Basin, in Gansu province, northwest China. This is one of the most extremely arid areas of the country, encompassing different ecosystems, including mountains, oasis, and deserts. The crops grown in the oasis require irrigation. The main
“Watershed Allied Telemetry Experiment Research (WATER)”
remote sensing experiment [22]. The field campaign was mainly concentrated in the peripheral range of Zhangye City, on June 15, 2008. In this field experiment, measurements were conducted on white poplar, desert date and other plantation species. The biophysical parameters measured in the artificial forests include height, density, crown diameter, LAI and Leaf Water Content (LWC).
The choice of experimental plots was mainly based on the requirement that the types of trees should be uniform and to try to avoid the mixing of a variety of tree types. The size of the study area was about three times the spatial resolution of the remote sensing satellite image. Because the ground sampling distance of CHRIS is 17m, our experiment was concentrated within a 50×50 m2 area. We obtained 15 sets of data in this experiment. The LAI-2000 was used to measure the LAI of the trees. For an LAI sampling, measurements were made at five random locations in each plot. The value of LAI, averaged over these five individual points’ measurements, was used as reference value for this plot. All plots were geographically referenced using differential Global Positioning System(GPS).
2.2.2 CHRIS images Processing
:
The preprocessing of the CHRIS images mainly included noise removal, radiometric calibration and geometric correction. There are often two severe horizontal and vertical noises in the CHRIS images. The software of ESA HDFclean, which is for processing the HDF stored images, was used to remove the noise by filling the missing pixel and strip removal. Radiometric correctionincluded atmospheric correction and reflectance calculation. In this paper, ESA’s CHRIS image BEAM was used for this purpose, which allowed accomplishing noise reduction, cloud screening, atmospheric correction, geometric correction, TOA reflectance computation and feature extraction. The geometric correction relied on a parametric approach taking into account the viewing geometry, and geometric distortion due to the sensor, platform and topography. A 2.5 m SPOT panchromatic image was used as the reference, with the UTM WGS84 projection. The images were co-located using sets of more than 40 ground control points based on features such as road intersections, pits and swales. The geo-correction error of all the images was less than 0.5 pixels. We obtained the image of geometric precision correction with quadratic polynomial corrective mode and the nearest neighbor resembling method.
2.3 Methods
2.3.1 ACRM simulations
:
The ACRM was proposed by Kuusk [16], and addressed a common structure of horizontallyhomogeneous vegetation canopies where a thin dense layer of vegetation of different geometrical and (or) optical properties was on the ground surface under the main layer of vegetation. The model is an extension of the homogeneous Multi-Spectral canopy Reflectance Model (MSRM) and the Markov Chain canopy Reflectance Model (MCRM). Like the MSRM and MCRM models, the new model (Version 07. 2009) accounts for non-Lambertian soil reflectance, the spectral reflection of direct sun radiation on leaves, the hot spot effect, and a two-parameter leaf angle distribution (LAD). The model works in the optical domain of radiation, 400-2400 nm, and its spectral resolution is 1 nm.
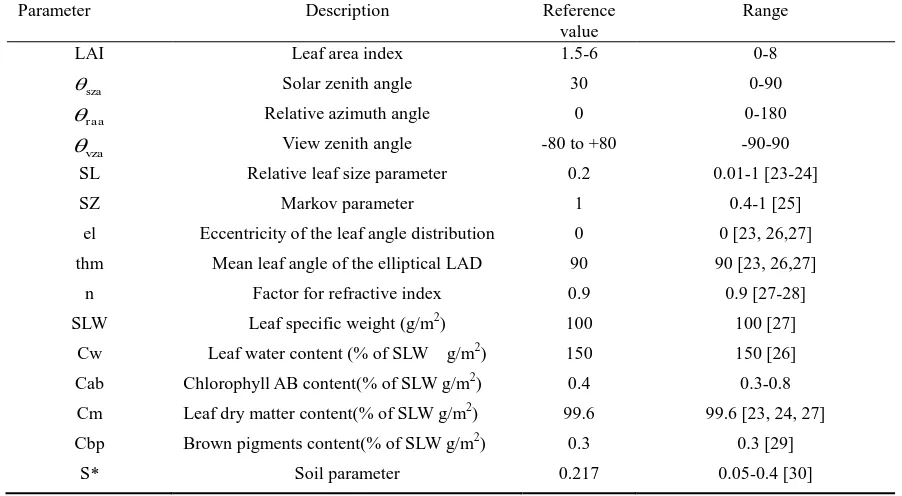
ACRM can calculate the angular distribution of crop canopy reflectance in the range -80 to +80 view zenith angles, with sun zenith, azimuth angles and wavelength fixed. To run the ACRM model, which requires the input parameters of external observation data, canopy structure, biochemical complements of leaves and soil, we set a series of parameters according to previous studies. Because of the high homogeneity of the canopy, LAI for the lower layer was assigned to zero. More detailed information is given in Table 3.
Parameter Description Reference
SL Relative leaf size parameter 0.2 0.01-1 [23-24]
SZ Markov parameter 1 0.4-1 [25]
el Eccentricity of the leaf angle distribution 0 0 [23, 26,27]
thm Mean leaf angle of the elliptical LAD 90 90 [23, 26,27]
n Factor for refractive index 0.9 0.9 [27-28]
SLW Leaf specific weight (g/m2) 100 100 [27]
Table 3. Input parameters for the ACRM model
2.3.2 Construction of the new multi-angular index HDVI: Using the ACRM model, we simulated a series of bidirectional reflectances with different LAI values in the range of -80° to +80° view zenith angles. Fig. 2 plots that change of reflectance in red 670 nm and near-infrared 800 nm bands with different view zenith angles when LAI is 3. For both 670 nm and 800 nm, the back-scattering region showed a higher reflectance than the forward-scattering. As a typical characteristic of non-uniform scattering by vegetation, the strongest vector of reflectance appeared in the back-scattering region and the weakest in the forward-scattering region. The finding is in agreement with the results of a previous study [7]. The peak reflectance is the hot spot located in the back-scattering region when the view zenith angle coincides with the sun zenith angle. Conversely, the weakest vector of reflectance appearing in the forward-scattering region is called the dark spot.
-80 -60 -40 -20 0 20 40 60 80
-80 -60 -40 -20 0 20 40 60 80 0.70
0.75 0.80 0.85 0.90 0.95
2 3 4 5 6
N
D
V
I
view zenith angle
hot spot
Figure 3. NDVI distributions in the view zenith angles with different LAI values
In this study the NDVI is used, which is the most well known and widely used vegetation index [31], where,
800 is the reflectance in the near-infrared 800 nm band, and
670 is the reflectance in the red 670 nm band.
800 670
800 670
NDVI
(2)
The NDVI distribution at the view zenith angles was calculated using the ACRM simulation data (Fig. 3). The results show that the canopy NDVI varies with angles, and it also has the bidirectional features just like the canopy reflectance. This feature was expressed as BiNDVI which has already been explained in the previous research [32]. Because of the multiple scattering of vegetation in the near-infrared bands, a strong
negative “hot spot’ showed up near the sun zenith angle in the
figure.
The shape of BiNDVI changed a little with LAI. LAI Primarily affects the size of BiNDVI, which increases as LAI increases. In the hot spot position, the differences between the BiNDVIs are very large. Conversely, the differences become smaller
away from the hot spot. The magnitude of the NDVI in the hot spot position is determined by both optical properties from the foliage, background and canopy architecture. The dark spot is also determined by the same optical properties, but more dominantly by the amount of canopy shadow. Therefore, the difference in the NDVI at hot spot and dark spot is normalized against that at the dark-spot, to reduce the influence of leaf optical properties, as well as to accentuate the importance of canopy geometry. From the theoretical analysis, a new multi-angular vegetation index was propose, called the Hotspot
–darkspot Difference Vegetation Index (HDVI),
D H
D
NDVI NDVI
HDVI
NDVI
(3)
Where NDVID and NDVIH represent the NDVI in the
dark-spot position and hot-spot position, respectively [36].
3. RESULTS AND ANALYSIS
The usefulness of the HDVI was tested in the estimation of LAI using both the data from in situ measurements of wheat and CHRIS/PROBA remote sensing image data. The NDVI and HDS were included for comparison analysis. With the correlation between NDVI and LAI, we found the extent of correlation in the hot spot position was the greatest, so here we only analyze the NDVI in the hot spot position. The most common spectral bands which were studied are located in the red region where chlorophyll absorbs (670 nm) and in the near-infrared (NIR 800nm) where vegetation reflects highly due to leaf cellular structure [31]. So the HDS was derived using two bands, 670 nm and 800 nm, as NDVI used these two same bands, referred to as HDS670 and HDS800, respectively. In this study, we define the index accuracy as the root mean square error (RMSE) between field LAI and the indices estimation, and the determination coefficients (R2) for the indices and field LAI.
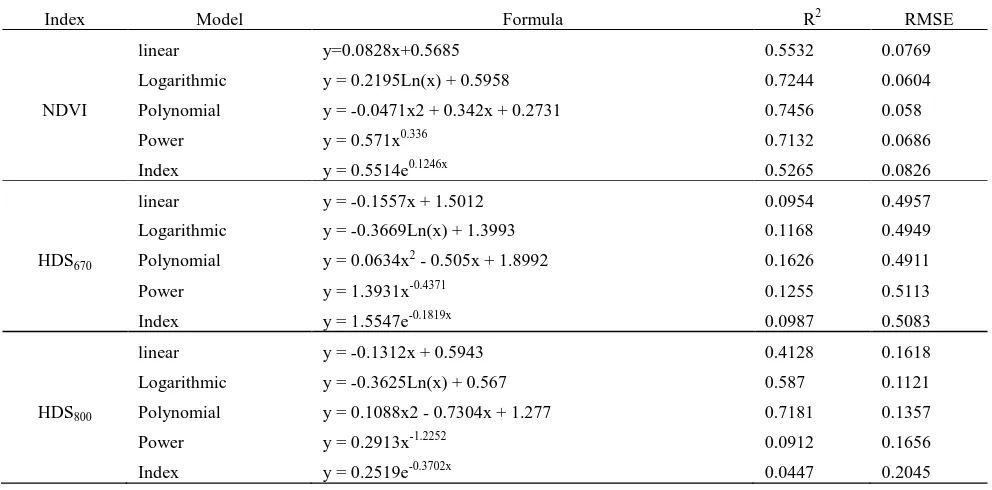
Index Model Formula R2 RMSE
linear y=0.0828x+0.5685 0.5532 0.0769
Logarithmic y = 0.2195Ln(x) + 0.5958 0.7244 0.0604
NDVI Polynomial y = -0.0471x2 + 0.342x + 0.2731 0.7456 0.058
Power y = 0.571x0.336 0.7132 0.0686
Index y = 0.5514e0.1246x 0.5265 0.0826
linear y = -0.1557x + 1.5012 0.0954 0.4957
Logarithmic y = -0.3669Ln(x) + 1.3993 0.1168 0.4949
HDS670 Polynomial y = 0.0634x2 - 0.505x + 1.8992 0.1626 0.4911
Power y = 1.3931x-0.4371 0.1255 0.5113
Index y = 1.5547e-0.1819x 0.0987 0.5083
linear y = -0.1312x + 0.5943 0.4128 0.1618
Logarithmic y = -0.3625Ln(x) + 0.567 0.587 0.1121
HDS800 Polynomial y = 0.1088x2 - 0.7304x + 1.277 0.7181 0.1357
Power y = 0.2913x-1.2252 0.0912 0.1656
Index y = 0.2519e-0.3702x 0.0447 0.2045
linear y = -0.0317x + 0.1672 0.6791 0.0225
Logarithmic y = -0.0764Ln(x) + 0.1483 0.7342 0.0205
HDVI Polynomial y = 0.0062x2 - 0.0657x + 0.2059 0.7067 0.0216
Power y = 0.1769x-1.144 0.3997 0.0252
Index y = 0.2768e-0.5257x 0.4533 0.0226
Table 4. The different modes between Indices and LAI using the data in situ measurement
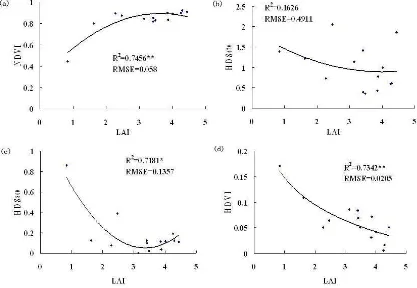
Using the data of in situ wheat measurements, the results of fitting different relationships between LAI and vegetation indices are shown in Table 4. It can be seen that the choice of the model has a significant influence on the estimation accuracy for LAI. For all of the NDVI, HDS670, and HDS800, the optimal approach is the polynomial. The best choice for the HDVI is logarithmic. The scatter diagrams between vegetation indices (HDS, NDVI, HDVI) and LAI with the optimal model are shown in Fig. 4, which illustrates that HDVI is a better proxy of LAI as a higher coefficient of determination
(R2=0.7342) is observed, as well as a much lower RMSE of 0.0205 (Fig. 4(d)). For HDS indices, we found that different bands lead to very different abilities in terms of LAI estimation which is consistent with previous research [33]. HDS670 show a limited potential for LAI estimation, with low R2 of 0.1626, and higher RMSE of 0.4911 with our dataset (Fig. 4(a)). However, HDS800 exhibits a better relationship, with R2 of 0.7181 and RMSE of 0.1357 (Fig. 4(b)). An R2 of 0.7456 is obtained for NDVI with RMSE of 0.058 with evident saturation limit, especially when LAI exceeds 2 (Fig. 4(c)).
Figure 4. Correlationship between LAI and (a)HDS670, (b)HDS800, (c)NDVI, and (d)HDVI using the data in situ measurements ( significance level of the relationship is indicated: **P<0.05, *P<0.01)
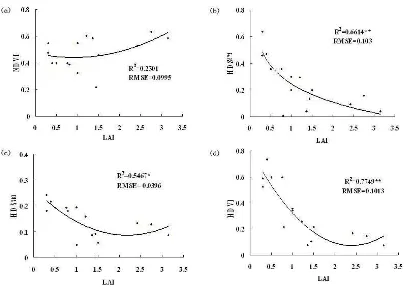
The new HDVI index was also successfully applied to CHRIS/PROBA remote sensing image data. Here among all the bands, we chose L8 (mid wavelength 672 nm) and L14 (mid wavelength 781 nm), two channels, the closest to 670 nm and 800 nm. We also compared the results of a variety of fitting curves. The results show that the polynomial is the best choice for the NDVI, HDS781, and HDVI. For the HDS672, the optimal fit is logarithmic (Table 5). The table also shows that there is a better relationship between the vegetation index HDVI and LAI. As seen on the scatter diagrams in Fig. 5 (b, c), a different predicting ability is also observed for the two HDS indices. HDS672 has a high potential for LAI estimation (R2=0.6614,
Index Model Formula R2 RMSE
linear y = 0.0554x + 0.4027 0.175 0.103
Logarithmic y = 0.0461Ln(x) + 0.4731 0.0869 0.1083
NDVI Polynomial y = 0.0376x2 - 0.0687x + 0.4717 0.2301 0.0995
Power y = 0.457x0.0794 0.0437 0.1093
Index y = 0.3983e0.1083x 0.1132 0.1035
linear y = -0.1422x + 0.4282 0.4731 0.1285
Logarithmic y = -0.1985Ln(x) + 0.2464 0.6614 0.103
HDS672 Polynomial y = 0.1053x2 - 0.4892x + 0.6211 0.6498 0.1048
Power y = 0.1592x-0.8174 0.2603 0.1145
Index y = 0.3425e-0.5995x 0.1952 0.1458
linear y = -0.0402x + 0.196 0.3421 0.0477
Logarithmic y = -0.0566Ln(x) + 0.1446 0.4871 0.0421
HDS781 Polynomial y = 0.0376x2 - 0.1643x + 0.265 0.5467 0.0396
Power y = 0.1304x-0.393 0.3423 0.0423
Index y = 0.1836e-0.2677x 0.2213 0.0479
linear y = -0.192x + 0.5746 0.593 0.1362
Logarithmic y = -0.2524Ln(x) + 0.3294 0.7347 0.11
HDVI Polynomial y = 0.1288x2 - 0.6169x + 0.8108 0.7749 0.1013
Power y = 0.2567x-0.8553 0.6909 0.1242
Index y = 0.6157e-0.6855x 0.6186 0.1237
Table 5. The different modes between Indices and LAI using the CHRIS/PROBA data
Figure
5. Correlationship between LAI and (a)HDS670, (b)HDS800, (c)NDVI, and (d)HDVI using CHRIS/PROBA data ( significance level of the relationship is indicated: **P<0.05, *P<0.01)4. DISCUSSION
This study has demonstrated the potential of the new vegetation index HDVI to estimate LAI. Strong biochemical and ecological gradients occur vertically within vegetation canopies. Extending multi-angular studies to improve estimating of LAI may increase our ability to model ecosystem processes across broad spatial extents. Compared to multi-spectral index NDVI and multi-angular index HDS, HDVI has a more relevant relationship with LAI. As we all know, combining the high-spectral data and multi-angular data to conduct a joint inversion of LAI has a higher accuracy than using only a single type of data. The method of implementing the new index HDVI to inversion of the LAI is feasible.
With both in situ experimental wheat data and CHRIS/PROBA remote sensing satellite data, for multi-angular indices (HDS and HDVI), the values of the indices decrease with the increase of the LAI. The finding is in agreement with the results of a previous study [13]. But for the NDVI, the trend is opposite, the value is consistent with the increase of LAI with evident saturation limit, especially when LAI exceeds 2. In the LAI estimation of dense wheat, due to the missing of the vegetation canopy structure, the performance of HDS is relatively poor. A similar ability to estimate LAI is shown for NDVI and HDVI in Fig. 5. But HDVI is much better with the lowest RMSE. For the sparse trees, the HDS and HDVI have a significant advantage over NDVI, as a result of advanced structural information from multi-angular observation. For HDS indices, we found that different bands lead to very different abilities in terms of LAI estimation, so the choice of band is an important issue. Information from a single band is subject to greater uncertainty from errors and other factors, while the use of two or more bands can partially eliminate such uncertainty. That is the advantage of HDVI, which not only can reflect the canopy structure as well as HDS, but also integrates more information from more bands. So the HDVI has a greater potential for LAI estimation than HDS. Although we can demonstrate and combinations thereof could enhance the sensitivity of indices to LAI variations [34, 15]. Due to lack of a large BRDF dataset, here we only choose two representative bands, 670 nm (a red band) and 800 nm (a near-infrared band). So we explore the usefulness of the new index HDVI only using these two bands. Therefore, other bands should be considered in further evaluation of HDVI.
Second, we used CHRIS data to assess the new index. The issue facing our validation study is the mismatch of spatial scales for the point to pixel comparison between remote sensing data and field measurements. The differences in scale between the remote sensing data and the field measurements can conditions in field measurements, owing to the limitation of the selected botanical varieties. While this study indicates the potential use of the new multi-angular vegetation index, more complicated canopies and different soil backgrounds also need to be considered in the future.
5. CONCLUSIONS obtained. Although this study is based on limited available data, we still demonstrate that HDVI is superior to HDS and to NDVI for estimating LAI. From the results, we can conclude that HDVI will be a useful vegetation index for estimating LAI, and provide the effective improvement to the NDVI and other vegetation indices that are based on the red and NIR spectral bands. Applying this new index still needs further evaluation, both with other more complicated canopies and different soil backgrounds and with other multi-angular optical remote sensing satellites data.
ACKNOWLEDGEMENTS
1
We would like to offer our thanks to the group of vegetation remote sensing at Tartu Observatory, Estonia, for providing us the ACRM code. This work was supported by the National Natural Science Foundation of China 41401397,51504243 , and the Natural Science Funds of Jiangsu Province techniques, and measurements. Journal of Geophysical Research-Atmospheres, 102,
pp.
29429-29443.[2] Kouiti, H.; Hiroshi, M.; Hayato T.; Tatsuo, S., 2009. Improving the estimation of leaf area index by using remotely sensed NDVI with BRDF signatures. Remote Sensing of Environment, 114,
pp.
514-519.[3] Zhao, F.; Gu, X.F.; Verhoef, W.; Wang, Q.; Yu, T.; Huang, H.; Qin, W.; Chen, L.; Zhao, H., 2010. A spectral directional reflectance model of row crops. Remote Sensing of Environment, 114,
pp.
265-285.[4] Haboudane, D.; Miller, J.R.; Pattey, E.; Zarco-Tejada, P.J.; Strachan, I., 2004. Hyperspectral and directional radiance images using coupled predicting green LAI of crop canopies : modeling and validation in the context of precision agriculture. Remote Sensing of Environment, 90(30),
pp.
337-352. [5] Wang, Q.; Adiku, S.; Tenhunen, J.; Granier, A., 2005. On the relationship of NDVI with leaf area index in a deciduous forest site. Remote Sensing of Environment, 94,pp.
244-255. [6] Gitelson, A.A.; Viña, A.; Ciganda, V.; Rundquist, D.C. 2005. Remote estimation of canopy chlorophyll content in crops. Geophysical Research Letters, 32, L08403.[7] Hasegawa, K.; Matsuyama, H.; Tsuzuki, H.; Sweda, T., 2010. Improving the estimation of leaf area index by using remotely sensed NDVI with BRDF signatures. Remote Sensing of Environment, , 114,
pp.
514-519.[8] Chen, J.M.; Liu, J.; Leblanc, S.; Lacaze, R.; Roujean, J. L., 2003. Multi-angular optical remote sensing for assessing vegetation structure and carbon absorption. Remote Sensing of Environment, 84,
pp.
516-525.[9] De Colstoun, E.C.B.; Walthall, C.L., 2006. Improving
Environment, 100,
pp.
474-485.[10] Chen, J. M.; Pavlic, G.; Brown, L.; Cihlar, J.; Leblanc, S.G.; White, H.P.; Hall, R.J.; Peddle, D.; King, D.J.; Trofymow, J.A.; Swift, E.; Vander, S.J.; Pellikka, P., 2002. Validation of Canada-wide leaf area index maps using ground measurements and high and moderate resolution satellite imagery. Remote Sensing of Environment, 80,
pp.
165-184.[11] Sandmeier, S.R.; Deering, D.W., A new approach to derive canopy structure information for boreal forests using spectral BRDF data. IEEE IGARSS 1999 Proceedings Germany: Hamburg.
[12] Sandmeier, S.R.; Miller, C.; Hosgood, B.; Andreoli, G., 1998. Physical mechanisms in hyperspectral BRDF data of grass and watercress. Remote Sensing of Environment, 66,
pp.
222-233.
[13] Lacaze, R.; Chen, J.M.; Roujean, J.L.; Leblanc, S.G., 2002. Retrieval of vegetation clumping index using hot spot signatures measured by POLDER instrument. Remote Sensing of Environment, 79,
pp.
84-95.[14] Pocewicz, A.; Vierling, L.A.; Lentile, L.B.; Smith, R., 2007. View angle effects on relationships between MISR vegetation indices and leaf area index in a recently burned ponderosa pine forest. Remote Sensing of Environment, 107,
pp.
322-333.[15] Wu, C.; Niu, Z.; Wang, J.; Gao, S.; Huang, W., 2010. Predicting leaf area index in wheat using angular vegetation indices derived from in situ canopy measurements. Canadian Journal of Remote Sensing, 36(4),
pp.
301-312.[16] Kuusk, A., 2001. A two-layer canopy reflectance model. Journal of Quantitative Spectroscopy and Radiative Transfer, 71,
pp.
1-9.[17] Liu, L.Y.; Wang, J.H.; Bao, Y.S.; Huang, W.J.; Ma, Z.; Zhao, H., 2006. Predicting winter wheat condition, grain yield and protein content usingmulti-temporal EnviSat-ASAR and Landsat TM satellite images. International Journal of Remote Sensing, 27,
pp.
737-753.[18] Verrelst, J.; Schaepman, M.E.; Koetz, B.; Kneubuehler, M., 2007. Angular sensitivity analysis of vegetation indices derived from CHRIS/PROBA data, Remote Sensing of Environment, 112(5),
pp.
2341-2353.[19] Fan, W.J.; Xu, X.R.; Liu, X.C.; Yan, B.Y.; Cui, Y.K., 2010. Accurate LAI retrieval method based on PROBA/CHRIS data. Hydrology and Earth System Sciences, 14,
pp.
1499-1507. [20] CHRIS/PROBAWebsite:http://earth.esa.int/missions/thirdpartymission/proba.html. [21] Gao, S.; Niu, Z.; Wu, C., 2010. Multi-polarization Envisat-ASAR images as a function of leaf area index (LAI) of White Poplar and Desert Date plantations. International Journal of Remote Sensing, 31(4),
pp.
1095-1102.[22] Li, X.; Li, X.W.; Li, Z.Y.; Ma, M.G.; Wang, J.; Xiao, Q.; Liu, Q.; Che, T.; Chen, E.X.; Yan, G.J.; Hu, Z.Y.; Zhang, L.X.; Chu, R.Z.; Su, P.X.; Liu, Q.H.; Liu, S.M.; Wang, J.D.; Niu, Z.; Chen, Y.; Jin, R.; Wang, W.Z.; Ran, Y.H.; Xin, X.Z.; Ren, H.Z., 2009. Watershed Allied Telemetry Experimental Research, Journal of Geophysical Research, 114(D22103).
[23] Fang, H.; Liang, S.; Kussk, A., 2003. Retrieving leaf area index using a genetic algorithm with a canopy radiative transfer model. Remote Sensing of Environment 85(3),
pp.
257-270. [24] Hosgood, B.; Jacquemoud, S.; Andreoli, G.; Verdebout, J.; Pedrini, J.; Schmuck, G., 1995. Leaf Optical Properties Experiment 93 (LOPEX 93), Report EUR-16095-EN, European Commission, Joint Research Center, Institute for Remote Sensing Applications, Ispra, Italy.[25] Houborg, R.; Soegaard, H.; Boegh, E., 2007. Combining vegetation index and model inversion methods for the
extraction of key vegetation biophysical parameters using Terra and Aqua MODIS reflectance data. Remote Sensing of Environment, 106,
pp.
39-58.[26] Houborg, R.; Boegh E., 2008. Mapping leaf chlorophyll and leaf area index using inverse and forward canopy reflectance modeling and SPOT reflectance data.Remote Sensing of Environment, 112(1),
pp.
186-202.[27] Xiao, Z.; Liang, S.; Wang, J.; Jiang, B.; Li, X., 2011. Real-time retrieval of leaf area index from MODIS time series data. Remote Sensing of Environment, 115(1),
pp.
97-106. [28] Kuusk, A., 2009. Two-layer Canopy Reflectance Model ACRM User Guide.[29] Houborg, R.; Anderson, M.; Daughtry, C., 2009. Utility of an image-based canopy reflectance modeling tool for remote estimation of LAI and leaf chlorophyll content at the field scale. Remote Sensing of Environment, 113(1),
pp.
259-274. [30] Price, J.C., On the information content of soil reflectance spectral, 1990. Remote Sensing of Environment, 33(2),pp.
113-121.
[31] Rouse, J.W.J.; Haas, R.H.; Schell, J.A.; Deering, D.W., 1974. Monitoringvegetation systems in the Great Plains with ERTS. In:Third ERTS Symposium, NASA SP-351, Washington DC,
pp.
309-317.[32] Li, X.; Gao, F.; Wang, J.; Yang, H., 2002
.
Bi-directional normalized difference vegetation index.Concept and application, Progress in Natural Science, 12 (2),pp.
115-119.[33] Wu, C.; Niu, Z.; Tang, Q.; Huang, W., Estimating chlorophyll content from hyperspectral vegetation indices: Modeling and validation. Agricultural and Forest Meteorology 2008, 148,
pp.
1230-1241.[34] Haboudane, D.; John, R.; Millera, J.R.; Tremblay, N.; Zarco-tejada, P.J.; Dextraze, L., 2002. Integrated narrow-band vegetation indices for prediction of crop chlorophyll content for application to precision agriculture. Remote Sensing of Environment, 81,
pp.
416-426.[35] Fang, H.; Wei, S.; Liang, S., 2012. Validation of MODIS and CYCLOPES LAI products using global field measurement data. Remote Sensing of Environment, 119,