MODEL-TO-IMAGE REGISTRATION AND AUTOMATIC TEXTURE MAPPING USING
A VIDEO SEQUENCE TAKEN BY A MINI UAV
D. Iwaszczuk a *, P. Helmholz b, D. Belton b, U. Stilla a
a
Photogrammetry and Remote Sensing, Technische Universität München, Arcisstr. 21, 80333 München, Germany -
(dorota.iwaszczuk, stilla)@tum.de
b
CRC for Spatial Information, Department of Spatial Sciences, Curtin University, GPO Box U 1987, Perth, WA, 6845,
Australia, (petra.helmholz, d.belton)@curtin.edu.au
KEY WORDS: Texture Mapping, Urban, Matching, 3D Building Models, UAV
ABSTRACT:
3D city models are used in many fields. Photorealistic building textures find applications such as façade reconstruction, thermal building inspections and heat leakage detection using thermal infrared (TIR) images, quantitative evaluation or study of the materials lying on the object’s surface using multispectral images. Often texturing cannot be done using the same data which was used for 3D reconstruction or textures have to be updated. In such cases co-registration between 3D building models and images has to be carried out. In this paper we present a method for model-to-image matching and texture extraction with best texture selection procedure. We present results for two data sets, first for TIR image sequences taken from a helicopter and second for VIS images taken from an Unmanned Aerial Vehicle (UAV).
* Corresponding author.
1. INTRODUCTION
1.1 Motivation
3D city models are used in many fields such as urban planning, simulations, calculation of solar energy potential, change detection, tourism, navigation, building inventory and inspection. 3D city models contain different elements of the city landscape and building structure depending in its level of detail (LoD). The LoD mentioned in this paper following the definitions in OGC (2012). Concerning the buildings in low level of detail they are represented as block model (LoD1). Increasing the level of detail also different roof structures (LoD2), façade structures, openings (windows and doors) (LoD3) and even interiors are modeled (LoD4). Independent on the level of detail the 3D building models are often enriched with photorealistic or non-photorealistic textures to improve their appearance and visual interpretation. While non-photorealistic textures can be used for computer games, navigation, tourism etc., photorealistic textures find also further applications such as façade reconstruction (Ripperda, 2008), thermal building inspections (Iwaszczuk et al., 2011) and heat leakage detection using thermal infrared (TIR) images (Hoegner & Stilla, 2009), quantitative evaluation or study of the materials lying on the object’s surface using multispectral images (Pelagotti et al., 2009).
3D building models for different applications e.g. monitoring of engineering objects (Lovas et al., 2008; Arias et al., 2010, Werner and Morris, 2010), heritage mapping (Lubowiecka et al., 2009) can be derived from land-based laser scanning systems. Land-based laser scanning systems not only include terrestrial laser scanning (TLS) systems but also mobile mapping systems (MMS). The number of available systems is large (Lemmens, 2012; Punete et al., 2012) and are still
increasing. One of the possible applications is the creation of high accurate and high detailed 3D models of buildings and other man-made-objects (Landes et al., 2012: Martinez et al., 2012). A number of scanner systems do not offer the possibility to acquire image data (e.g. Leica C5, DYNASCAN), so direct texturing of the derived 3D models is not possible.
On the other side the number of photogrammetric applications using low-cost camera systems is increasing rapidly over the past years, too. These low-cost camera systems includes not only single shot camera systems but also video devices which can be used as hand hold systems or mounted on low-cost mini Unmanned Arial Vehicles (UAV). These platforms offer the opportunity to acquire image data which also can be used to create 3D models using image matching techniques (Bartelsen et al., 2012; Kersten and Lindstaedt, 2012). The quality and level of detail of 3D models created only with imagery of low-cost platforms are generally not as good as these derived from laser scanning systems (Bartelsen et al., 2012) but these systems can offer texture from the object of interest. Also, the images and video sequences can be used to extract missing textures or update the model database with the current appearance of a priori created models such as of façades and roofs of buildings. Since the point cloud used for creation of the 3D building models and the images used for texturing are taken from a different point in time and/or different camera pose a registration between the data is necessary. Using multiple images, e.g. image sequences each face of the 3D building model can appear many times in the images. Therefore also a best texture selection procedure is needed.
1.2 Related Work
Texturing existing 3D building models using an airborne camera system touches mostly such topics as matching, visibility checking and best texture selection.
Model-to-image matching problem for airborne imagery is frequently addressed in literature. Many methods for solving the problem have been proposed. Früh et al. (2004) implemented line matching based on slope and proximity by testing different random camera positions. However, as Ding & Zakhor (2008) mentioned, this method requires high computational effort. Hsu et al. (2000) search for the best camera position by minimizing the disagreement between projected features and features detected in the image. Other authors propose methods for coarse orientation which use vanishing points (Ding & Zakhor 2008, Förstner 2010). These methods lead to faster results, but they assume so called “Manhattan scenes”, where many horizontal and vertical lines can be detected in the image. In some works (Vosselman 1992, Eugster & Nebiker 2009) relational matching is applied, which does not only consider the agreement between an image feature and a model feature, but also takes the relations between features into account. Methods can also be differentiated based on which image features they use for matching. Some authors propose points (Ding & Zakhor 2008, Avbelj et al. 2010), but most works consider lines as more natural for building structures and use them for co-registration (Debevec 1996, Früh et al. 2004, Schenk 2004, Eugster & Nebiker 2009). In some papers hybrid methods employing points and lines at the same time are presented (Zhang et al. 2005, Tian et al. 2008).
For visibility checking the depth-buffer method adopted from computer graphics is well-established. The depth-buffer is a matrix storing for every pixel the distance from projection centre to the model surface. This method was often proposed in some variations. Karras et al. (2007) tries to generalize the problem of orthorectification and texture mapping. He proposes a method for visibility checking based on depth image. Every triangulated 3D mesh is projected onto projection plane and for every triangle occupied pixels get identity number (ID) of the triangle. For pixels with more IDs the closest one is chosen. Frueh et al. (2004) used a modified depth-buffer storing additionally the product of a triangle’s normal vector with the camera viewing direction at each pixel. Using information about vector product not occluded edges can be detected. Abdelhafiz & Niemeier (2009) integrate digital images and laser scanning point clouds. They introduce a Multi Layer 3GImage algorithm which classifies the visibility on two stages: point stage and surface stage. The visible layer and back layers are applied. Occluded vertexes are sent to a back layer, while visible vertexes appear on the visible layer. An image is used for texture mapping of a mesh, if all three vertexes of it are visible in this image. Abdelhafiz & Niemeier discuss also the problem of extrinsic (un-modelled) occlusions caused by such objects as traffic signs, trees and street-lamps. They propose a Photo Occlusion Finder algorithm which checks textures from many images for one mesh. When the textures of one mesh are not similar an occlusion occurred.
Objects taken by image sequences with a high frame rate from a flying platform appear in multiple frames. In this case textures with optimal quality have to be taken for texturing. Lorenz & Doellner (2006) introduced a local effective resolution and discuss it on example of images from a High Resolution Stereo Camera (HRSC) due to its special projection of line scanners
(perspective and parallel). Frueh et al. (2004) uses a focal plane array. He determines optimal textures taking into account occlusion, image resolution, surface normal orientation and coherence with neighbouring triangles. He proposes to accept textures with few occluded pixels instead textures with very low resolution taken from extremely oblique view. This quality calculation is focused on texturing with optical images and good user perception.
1.3 Paper Overview
In this paper we present technique for texture extraction using video sequence taken from a low-cost UAV and mapping on 3D building models which were extracted a priori using a TLS system. In contrast to other authors we pursue to get the best fit between the 3D building model and images so that extracted textures can be used for façade object detection. We also attempt to reach the best quality textures. In Section 2 we present our method for model-to image matching to improve the data co-registration. Section 3 we outline texture extraction and best texture selection. In Section 4 we describe our experiments, in Section 5 present the results and finally in Section 6 discuss the results and future work.
2. COREGISTRATION
The main goal of this research is to create the best possible texture for each face of the 3D building model. In general there are two issues which should be considered by extracting the textures. On the one hand the texture should exactly picture the appearance of the face, it means the co-registration between the image used for the extraction and the 3D building model should be the best possible. This is important in case when the textures are used for object detection when the position of the object locally in the façade should be well known. On the other hand the resolution of the texture should be preferably high, so that the in the texture depicted elements can be recognised. Accordingly our method can be split in two main stages: (i) matching and (ii) texture extraction with best texture selection.
2.1 Model-to-image matching
In this research we assume a video sequence or multiple images with a very large overlap and a roughly known camera pose, however with an accuracy which is not sufficient for texture extraction. Such camera pose can be derived from GPS/INS devise mounted on the UAV or other flying platform used for acquisition. The information about the approximate camera pose is used for the initial projection of the 3D building model into the images. According to the inaccurate camera pose derived from the navigation data a mismatch between the projected 3D model and the image structures is expected. To compensate this mismatch a model-to-image matching is needed. For this purpose we use building edges and line segments extracted in the images. On the one hand linear structures are more suitable than points to represent building, on the other hand they are more difficult to represent, especially in 3D using e.g. parameterization with two angles and two coordinates (Schenk, 2004, Iwaszczuk et al., 2012) or Plücker coordinates. Such representation leads to more complicated projection matrix than projection matrix for points. In 3D building models edges are clearly defined by the end points (building corners) while the line segments extracted in the images often represent only a part of the real building edge.
Therefore we propose point representation for building edges in 3D and line representation for projected edges and detected line segments in 2D. We project 3D building corners into the image and calculate 2D line parameters l’ using
' '
' x y
l (1)
where x’,y’ are projected end points. Then we build a buffer around the projected line segment where the size of the buffer is calculated by error propagation of camera uncertainty during edge projection. We test line segments detected in the image if they are arranged within the buffer and if the angle difference between both line segments is smaller than a threshold. If this both conditions are fulfilled inspected two line segments are assigned as preliminary correspondences. These preliminary correspondences result in many outliers, even up to 80-90% (Iwaszczuk et al., 2012). Therefore we reduce these correspondences using outlier detector. We propose two methods to achieve our goal: RANSAC and accumulator approach.
2.1.1 RANSAC: To eliminate incorrect preliminary correspondences, we propose the RANdom SAmple Consensus – RANSAC (Fischler & Bolles 1981). From the set of all hypothetical correspondences we randomly select three correspondences from different parts of the model and calculate exterior orientation parameters without redundancy. We then check how many of the remaining correspondences fit the randomly estimated exterior orientation parameters. This procedure is repeated k-times, and k is calculated as
)
where ε(0,1) is the outliers rate and the probability that RANSAC makes at least one error free selection is 99%. We estimate ε as:
KKMod, (3)where K is the number of hypothetical correspondences selected by the assignment algorithm and KMod is the number of model lines which have at least one assigned image line. The RANSAC algorithm results in new exterior orientation parameters and a set of correct correspondences.
2.1.2 Accumulator: Assuming the uncertainty in range of few meters in the camera position and few degrees in the camera orientation the mismatch between the projected linear model structures and the structure in the image can be simplified to a 2D transformation. The error of the camera position and orientation results mostly in a 2D translation of the projected model. Thus rotation, scale and other transformation parameters can be neglected in this step.
To find the correct match between the projected 3D model and the image we try a set of possible translation of the projected model and fill the accumulator searching the most likely position of the model in the image. The same process is repeated with rotating the projected 3D model using small range of angles. This step results in a 3 dimensional accumulator filled with the number of correspondences assigned to every
cell of the accumulator, which means for every position and 2D rotation of the projected 3D model. Then we search for the maximal number of correspondences in the accumulator space and use the assigned line-to-line correspondence to calculate the camera pose.
2.2 Optimal camera pose estimation
After the elimination of outliers we use the remaining correspondences to calculate optimal camera pose for each frame. As observations we use line segments detected in the image assigned to pairs of 3D points representing building corners (two 3D building corners represent a building edges in 3D). Therefore, we can write the coplanarity equation for both: 3D building corners X, Y and line segment lxy in the
image, where x, y are the end points of the line segment. Accordingly every correspondence results in two conditions
PY
with 3 equations for parameters p and observations b each, where only two of 3 equations are linearly independent. Therefore, we introduce condition for observations
0 1 ˆ
1(b) l
c , (4)
so that we can introduce statistical model and singular covariance matrices (Förstner, 2004). The vector b consists of line parameters of detected line segments; l and p are the exterior orientation parameters which define the projection matrix P. Optimal parameters p are estimated using Gauß-Helmert model.
3. BEST TEXTURE SELECTION AND TEXTURE EXTRACTION
Best texture selection is needed when one face appears in multiple images. For this purpose a quality measure should be developed. This issue was already discussed in Iwaszczuk & Stilla (2010). We continue the same idea and define quality measure as function of occlusion, angles between normal of the investigated face and direction to the projection centre and its distance to the projection centre.
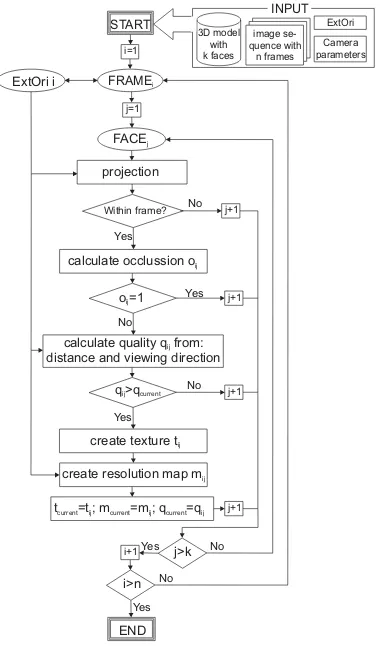
Best texture selections procedure is schematically presented in Fig. 1. Starting from the first frame we project each FACEj into FRAMEi and check if this frame was projected within FRAMEi. If this condition is fulfilled we calculate occlusion and if FACEj is visible in FRAMEi, we compute the quality qij for FACEj in FRAMEi. If qij>qcurrent,j new texture tcurrent,j we replace by tij. At the same time we create the resolution map mij and use to replace mcurrrent,j. This procedure is repeated for all n frames and k faces.
Effectively this algorithm does not have to output the ready texture but only the reference for each face to the frame or frames where this face has the best quality. Therefore this procedure can be done prior to the texture extraction or ever prior to the data acquisition if the planed flying trajectory is known.
4. EXPERIMENTS
Presented method is tested using two datasets. The first dataset was taken in the city centre of Munich, Germany using a TIR camera mounted on a helicopter. The second dataset comes from Curtin University Campus in Perth, Australia and was acquired using a low cost sport camera mounted on a mini UAV.
FRAMEi
o =1ij Yes
No
create resolution map mij calculate quality qijfrom: distance and viewing direction
j=1
Yes
No
FACEj
i=1
Within frame?
Yes
Yes No
No
START
END projection ExtOri i
calculate occlussion oij
q >qij current
tcurrent=t ; mij current=m ; qij current=qij create texture tij
j>k
i>n
No
j+1 j+1 j+1
j+1
i+1Yes
3D model with k faces
image se-quence with
n frames
INPUT
ExtOri Camera parameters
Figure 1. Texture mapping procedure with best texture selection
4.1 TIR images taken from a helicopter
The thermal images were taken in dense urban area with the high resolution IR camera AIM 640 QLW FLIR with the frame rate 25 images per second, which was mounted on a platform carried by helicopter. The flight height was approximately 400 m above ground level. The camera was forward looking with oblique view of approximately 45°. The helicopter flew 4 times over the test area, i.e. main campus of Technische Universitaet Muenchen (TUM), Munich, Germany, recording a sequence of IR images. The helicopter was equipped with the GPS/INS Applanix POS AV 510. 3D building models were created manually using commercial software and were translated to CityGML format (OGC, 2012).
4.2 VIS images taken from a UAV
The camera used for the second data set is the ION Air Pro 1080p HD Action Sports Video Camera which can capture RGB video sequences. The resolution of the camera is 1920x1080 pixels which is a 16:9 format; it can capture 30 frames per second. The lens installed in the camera is a 170 degree wide angle lens. This relative light camera (130 grams) was mounted on an inexpensive Parrot AR.Drone 2 UAV system with a weight of less than 380g (without hull to safe weight). The
UAV system with camera is shown in fig. 2. The Parrot AR.Drone 2 UAV is a rotor UAV and therefore offers the possibility also to fly around the object of interest. The UAV can be controlled with a table system using inboard a 3 axis gyroscope, a 3 axis accelerometer and a 3 axis magnetometer. However, even that this instruments are mounted into the UAV, it was not possible to use the navigation data.
Figure 2. AR.Drone 2 UAV system with ION Air Pro camera.
Instead, the algorithm of Hollick et al. (2013) was used. This algorithm was introduced with the aim to be able to process large video sequence data sets in order to create 3D point clouds and models including the determination of the parameter of the interior and exterior orientation. The algorithm works in three steps. First the number of images is reduced, second the parameters of the exterior and interior orientations are determined together with a 3D point cloud, and third a textured TIN is created. The last step, the creation of a textured model (TIN) was not applied for our tests. As mentioned, in the first step number of images is reduced. This step includes the filtering of the 6 minute video sequence to remove unusable frames, i.e. showing images without information (for instance grass during take-off and landing), and the extraction of a minimal number of frames form the video sequence while maintaining connectivity and overlap where possible. After the first steps, the 10800 initial number of images extracted from the video sequence could be reduced to 2209. The next is an adjustment using all remaining images. Outcome is a 3D point and the parameters of the exterior and interior as outcome. After the images are classified, matching images are determined. The matching images are used to extract first a sparse point cloud, and then a dense point cloud including the parameter of the interior and exterior orientation. However, the on-the-fly-calibration of the wide angle camera challenges the further processing of the data. The camera should be calibrated next time prior to the flight. Further details about the approach are available in Hollick et al. (2013).
5. RESULTS AND EVALUATION
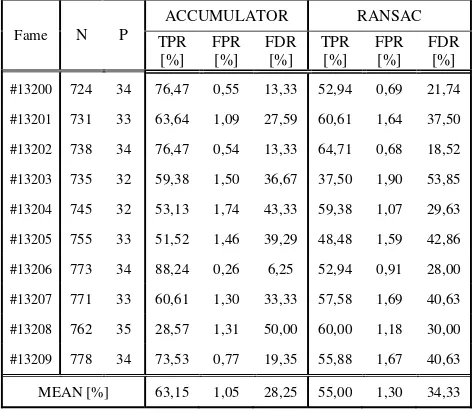
In each of 10 frames from first data set our correspondence selection algorithm was carried out. TP – true positive matches, P – all possible correct positive matches (ground truth), FP – false positive matches were verified visually. All possible correct negative matches N (ground truth) were calculated as N=number_of_all_extraced_lines-P. We calculated also true negative TN=N-FP and false negative FN=P-TP matches. These data were used for evaluation and comparison of outlier detection algorithms (Tab. 1). We calculated true positive rate TPR=TP/P, false positive rate FPR=FP/N and false discovery rate FDR=FP/(FP+TP) for each frame using accumulator or using RANSAC. Then we calculated the mean over all investigated frames for each rate. It can be observed that FPR is
very low in case of both outlier detectors but this is due to the large N. It should be mentioned that assignment was carried out in a part of the image. N depends on all lines segments detected in the frame. Therefore we also calculated FDR which is more representative in this case. In Tab. 1 can be seen that accumulator achieves better results: It is characterised by higher TPR and lower FPR and FDR.
Fame N P
ACCUMULATOR RANSAC
TPR [%]
FPR [%]
FDR [%]
TPR [%]
FPR [%]
FDR [%]
#13200 724 34 76,47 0,55 13,33 52,94 0,69 21,74
#13201 731 33 63,64 1,09 27,59 60,61 1,64 37,50
#13202 738 34 76,47 0,54 13,33 64,71 0,68 18,52
#13203 735 32 59,38 1,50 36,67 37,50 1,90 53,85
#13204 745 32 53,13 1,74 43,33 59,38 1,07 29,63
#13205 755 33 51,52 1,46 39,29 48,48 1,59 42,86
#13206 773 34 88,24 0,26 6,25 52,94 0,91 28,00
#13207 771 33 60,61 1,30 33,33 57,58 1,69 40,63
#13208 762 35 28,57 1,31 50,00 60,00 1,18 30,00
#13209 778 34 73,53 0,77 19,35 55,88 1,67 40,63
MEAN [%] 63,15 1,05 28,25 55,00 1,30 34,33
Table 1. Evaluation and comparison of outlier detectors. N- all possible correct negative matches, P – all possible positive matches, TPR- true positive rate, FPR – false positive rate, FDR
– false discovery rate.
Fig. 3 presents textured 3D building model using the data described in Section 4.1. According to missing control points the algorithm from Hollick et al. (2013) was not able to calculate the world coordinates of the scene and created only a point clouds and exterior orientation in a local and scaled coordinate system. The 3D model was brought together manually my 3D motion and scaling. Results for this scene are presented in Fig. 4. On the left 3D building model with the point cloud and all camera centres are depicted. On the right a fragment of manually textured model is presented.
Figure 3. Test area “TUM”: Textured 3D building model.
Figure 4. Test area “Curtin University”. Left: Calculated camera position (green), 3D mode (blue) and generated point
cloud (true colors). Right: manually texture 3D model.
6. DISCUSSION AND OUTLOOK
In this paper we presented a method for texture mapping which focuses on the best fit between the 3D building model and images on the one hand and on the best texture selection on the other hand. It allows introducing uncertainties of the image lines and can be extended with uncertainties of the building model by treating the building corners as observations in the adjustment step. However our method can deal only with geo-referenced data. Therefore, in the future a strategy for the data without navigation should be developed, so that also the second data set can be successfully textured. Further challenge, which can be observed in the second data set is exterior occlusion caused by vegetation or unmodeled buildings. Therefore, in the future not only self occlusion by the 3D building model should be considered but also the exterior occlusion should be detected and handled. For this purpose the point cloud created in structure from motion algorithm can be utilized. Moreover for the second data set a better calibration of the fish eye camera in necessary to achieve better accuracy of the point cloud and initial exterior orientation.
ACKNOWLEDGMENTS
The authors would like to thank Frauenhofer IOSB, Ettlingen, for providing thermal images. The work has been supported by the Cooperative Research Centre for Spatial Information, whose activities are funded by the Australian Commonwealth's Cooperative Research Centres Programme.
REFERENCES
Abdelhafiz A, Niemeier W (2009), In: Godhoff F, Staiger R. Terrestrisches Laserscanning (TLS 2009). Yes, we Scan! Beiträge zum 91. DVW-Seminar am 19. und 20. November 2009 in Fulda. Schriftreihe eds DVW. Band 60/2009
Arias P, Riveiro B, Armesto J, Solla M (2012) Terrestrial Laser Scanning and Non Parametric Methods in Masonry Arches Inspection. In International Archives of Photogrammetry, Remote Sensing and Spatial Geoinformation Sciences, Vol. 38, Part 5: 39-44.
Avbelj J, Iwaszczuk D, Stilla U (2010) Matching of 3D Wire-Frame Building Models with Image Features from Infrared Video Sequences taken by Helicopters. International Archives of Photogrammetry, Remote Sensing and Spatial Geoinformation Sciences 38(3b): 149–154.
Bartelsen, J., Mayer, H., Hirschmueller, H., Kuhn, A., Michelini, M. (2012) Orientation and Dense Reconstruction from Unordered Wide Baseline Image Sets. Photogrammetrie Fernerkundung Geoinformation 2012 (4):331-340.
Debevec P E, Taylor C J, Malik J (1996) Modelling And Rendering Architecture from Photographs: A Hybrid Geometry- And Image-Based Approach. – Proceedings of the 23rd Annual Conference on Computer Graphics and Interactive Techniques: 11–20
Ding M, Zakhor A (2008) Automatic Registration of Aerial Imagery with Untextured 3D Lidar Models. IEEE Computer Society Conference on Computer Vision and Pattern Recognition (CVPR)
Eugster H, Nebiker S (2009) Real-Time Georegistration Of Video Streams From Mini Or Micro Uas Using Digital 3d City
Models. – 6th International Symposium on Mobile Mapping Technology, Presidente Prudente, Sao Paulo, Brazil.
Fischler M A, Bolles R C (1981) Random Sample Consensus: A Paradigm for Model Fitting with Applications to Image Analysis and Automated Cartography. Communications of the ACM 24 (6): 381–395
Förstner W (2010) Optimal Vanishing Point Detection And Rotation Estimation Of Single Image From A Legoland Scene. The International Archives of Photogrammetry, Remote Sensing and Spatial Geoinformation Sciences 38 (3A): 157–162
Förstner W (2004) Uncertainty and Projective Geometry. In E. Bayro-Corrochano (Eds.) Handbook of Computational Geometry for Pattern Recognition, Computer Vision, Neurocomputing and Robotics:493-535, Springer
Früh C, Sammon R, Zakhor A (2004) Automated Texture Mapping of 3D City Models with Oblique Aerial Imagery. 2nd International Symposium on 3D Data Processing, Visualization, And Transmission (3DPVT’04)
Hoegner L, Stilla U (2009) Thermal leakage detection on building facades using infrared textures generated by mobile mapping. Joint Urban Remote Sensing Event (JURSE 2009). IEEE
Hollick J, Belton D, Moncrieff S, Woods A, Hutchison A, Helmholz P (2013) Creation of 3D models from large unstructed image and video datasets. In International Archives of Photogrammetry, Remote Sensing and Spatial Geoinformation Sciences, Hannover Workshop 2013.
Hsu S, Samarasekera S Kumar R,Sawhney H S (2000) Pose Estimation, Model Refinement, and Enhanced Visualization Using Video. Proceedings of CVPR 00 I: 488–495.
Iwaszczuk D, Hoegner L, Schmitt M, Stilla U (2012): Line based matching of uncertain 3D building models with IR image sequences for precise texture extraction. Photogrammetrie Fernerkundung Geoinformation 2012 (5): 511-521
Iwaszczuk D, Hoegner L, Stilla U (2011) Matching of 3D building models with IR images for texture extraction In U. Stilla, U.; Gamba, P.; Juergens, C. & Maktav, D. (Eds.) Proceedings of JURSE 2011 - Joint Urban Remote Sensing Event: 25-28
Iwaszczuk D, Stilla U (2012) Quality measures for textures extracted from airborne IR image sequences. In Proceedings of PCV 2010 - Photogrammetric Computer Vision and Image Analysis: 79-84
Karras G, Grammatikopoulos L, Kalisperakis I, Petsa E (2007) Generation of Orthoimages and Perspective Views with Automatic Visibility Checking and Texture Blending. Photogrammetric Engineering & Remote Sensing, Vol. 73, No. 4, April 2007: 403-411
Kersten T P, Lindstaedt M (2012) Automatic 3D Object Reconstruction from Multiple Images for Architectural, Cultural Heritage and Archaeological Applications Using Open-Source Software and Web Services., Photogrammetrie Fernerkundung Geoinformation 2012 (6): 727-740.
Landes T, Boulaassal H, Grussenmeyer P (2012) Quality Assessment of Geometric Façade Models Reconstructed from TLS data. In The Photogrammetric Record 138(27):137-154.
Lemmens M (2011) Terrestrial Laser Scanners. In Geo-information. Technologies, Applications and the Environment. Series: Geotechnologies and the Environment, Vol. 5: 101-121
Lorenz H, Doellner J (2006) Facade Texture Quality Estimation for Aerial Photography in 3D City Models. Meeting of the ICA commission on Visualization and Virtual Environments, Vancouver, Canada
Lovas T, Barsi A, Detrekoi A, Dunai L, Csak Z, Polgar A, Berenyi A, Kibedy Z, Syocs K (2008) Terrestrial Laserscanning in Deformation Measurements of Structures. In International Archives of Photogrammetry, Remote Sensing and Spatial Geoinformation Sciences, Vol. 37, Part B5: 527-532.
Lubowiecka, I., Armestro, J., Arias, P., Lorenzo, H., 2009. Historic bridge modelling using laser scanning, ground penetrating radar and finite element methods in the context of structural dynamics. In Engineering Structures, Vol. 31: 2667-2676.
Martinez J, Soria-Medina A, Arias P, Buffara-Antunes A F (2012) Automatic processing of Terrestrial Laser Scanning Data of Building Facades. In Automation in Construction, Vol. 22: 298-305.
Open Geospatital Consortium (OGC), 2012. OGC City Geography Markup Language (CityGML) Encoding Standard. Available at http://www.opengis.net/spec/citygml/2.0Pelagotti A, Del Mastio A, Uccheddu F, Remondino F (2009) Automated multispectral texture mapping of 3D models. In Proceedings of 17th European Signal Processing Conference (EUSIPCO 2009), Glasgow, Scotland, August 24-28, 2009: 1215-1219
Ripperda N (2008) Grammar Based Façade Reconstruction using RjMCMC. Photogrammetrie Fernerkundung Geoinformation 2008(2):83-92
Schenk T (2004) From point-based to feature-based aerial triangulation. ISPRS Journal of Photogrammetry and Remote Sensing 58: 315–329.
Tian Y, Gerke M, Vosselman G, Zhu Q (2008) Automatic Edge Matching Across An Image Sequence Based On Reliable Points. The International Archives of the Photogrammetry, Remote Sensing And Spatial Information Sciences 37 (B3b): 657–662.
Vosselman G (1992) Relational Matching. Lecture Notes in Computer Science, Springer.
Werner T, Morris D (2010) 3D Laser Scanning for Masonry Arch Bridges. In Proc. of the FIG Congress 2010, Sydney, Australia.
Zhang Y, Zhang Z, Zhang J, Wu J (2005) 3D Building Modelling with Digital Map, LIDAR Data and Video Image Sequences. Photogrammetric Record 20 (111): 285–302.