EVALUATION OF PLEIADES-1A TRIPLET ON TRENTO TESTFIELD
D. Poli a,*, F. Remondino b, E. Angiuli c, G. Agugiaro b
a Terra Messflug GmbH, Eichenweg 42, 6460 Imst, Austria – [email protected]
b 3D Optical Metrology Unit, Fondazione Bruno Kessler, via Sommarive, Trento, Italy – (remondino,agugiaro)@fbk.eu c
Joint Research Center, European Commission, via Fermi 2749, Ispra (VA), Italy – [email protected]
Commission I, WG I/4
KEY WORDS: Pleiades, Very High Resolution, Radiometry, Geometry, DSM, Quantitative analysis
ABSTRACT:
The Pleiades mission is part of the French-Italian ORFEO system (Optical and Radar Federated Earth Observation) and has the aim to provide very-high resolution optical imagery from space for civilian and military needs. Within the Pleiades evaluation program, the 3DOM Unit at the Bruno Kessler Foundation in Trento (Italy) received a triplet by Pleiades-1A over Trento testfield for research purposes. The images composing the triplet were acquired on August 28, 2012 with across-track angles close to nadir and along-track angles of 18°, -13° and 13° in average with respect to the flight direction (Fig. 1) and a mean GSD between 0.72m and 0.78m. The aim of this paper is to investigate the quality of the Pleiades triplet and derived Digital Surface Model (DSM). The image analysis was conducted by evaluating the radiometric properties of the images (noise characteristics, image artifacts, spilling) and the geometric accuracy. After image orientation, three DSMs were generated with advanced image matching algorithms using two image combinations and the triplet. The DSMs were compared to the reference Lidar DSM (1m grid spacing) for quality analysis in areas with different characteristics (land use and cover, topography). Thanks to the availability of other very high resolution satellite imagery in the testfield, the results were compared to those previously obtained using WorldView-2 ad GeoEye-1 stereopairs acquired on the same area.
1. INTRODUCTION
Pleiades is the most recent satellite mission providing optical images at Very High Resolution (VHR) (<1m) on any point of the Earth surface. The mission is part of the French-Italian ORFEO system (Optical and Radar Federated Earth Observation) and is managed by CNES (Centre National d'Etudes Spatiales) and ASTRIUM Geo- Information Services (ex Spot Image) (Gleyzes et al., 2012). As a complement to the French military space observation system Helios 2 and the SPOT satellites, the Pleiades mission has been designed to meet the needs of both Defence and civilian users, institutional and commercial, in terms of accuracy, coverage, acquisition capability and priority. The Pleiades system consists of a constellation of two satellites: Pleaiades-1A, launched on December 17, 2011, and Pleiades-1B, launched on December 2, 2012. Each satellite carries a CCD camera, called HiRi, able to acquire images with ground sample distance (GSD) at nadir of 0.70m in the panchromatic band and 2.80m in the multispectral bands, resulting in a swath 20km wide. The availability of two satellites allows for a 1-day revisit time worldwide. With comparison to other optical sensors in the same class (i.e. GeoEye-1 – GE1- and WorldView-2 -WV2) Pleiades offers larger field of view and acquisition capability at similar ground resolution. One interesting aspect of the Pleiades constellation is the acquisition mode. CNES offers target collection, single-pass strip mapping, stereo and tri-stereo and corridor acquisition. For the purpose of this paper, the tri-stereo acquisition mode for 3D information extraction is investigated. According to this acquisition scheme, the satellite is able to rotate around its axis and the HiRi camera scans a target area from three different viewing directions during one pass, thus resulting in a triplet. The acquisition angles (and B/H ratios) are not fixed (as in ALOS-PRISM), but depend on the size of the target area, the orbit, and customer requirements. Beside the investigations carried out by CNES team (Lebègue et al., 2012), very few publications on the evaluation of the Pleiades images
can be found in literature at the time of writing (April 2013), due to the novelty of the mission. In particular the potential of the tri-stereo acquisition mode for 3D information extraction is an interesting topic, due to the increasing need of accurate DSM on any point of the globe and with high revisit time, for applications in change and disaster monitoring (Poli and Caravaggi, 2013). Therefore the aim of this paper is to investigate the characteristics of the Pleiades triplets, using an acquisition over Trento testfield (Aguguaro et al., 2012), with focus on 3D information extraction. The paper is structured as follows. After the presentation of the main characteristics of the sensor and data (Section 2), the radiometric properties of the images are investigated (Section 3), then the images are oriented and three Digital Surface Models (DSMs) are generated (Section 4). The quality of the DSMs is investigated in Section 5, using a Lidar DSM as reference, and comparing them to the DSMs obtained from WV2 and GE1 stereopairs available in the same testfield. Conclusions and general remarks for future investigations will close the paper.
2. DATA DESCRIPTION
2.1 Pleiades sensor description
The satellites Pleiades-1A and 1B fly on the same near-polar sun-synchronous orbit at an altitude of 694km with a 180° phase and descending node at 10:30 am. Each HiRi camera carried on board is a Korsch telescope with aperture diameter of 65cm and focal length of 12.9m. The CCD optical sensors acquire images in pushbroom mode using 5x6000 pixel arrays and 20 integration lines (TDI) for the panchromatic band (480-830nm) and 5x1500 pixel arrays and for the multispectral bands (blue, green, red and near infrared). The sensor can reach a ground resolution of 0.7m in panchromatic mode and 2.8m in multi-spectral mode in vertical direction.
To ensure stereo and tri-stereo coverage, the satellite is capable of rotating up to 47° with respect to the viewing position. In International Archives of the Photogrammetry, Remote Sensing and Spatial Information Sciences,
addition the cameras scan the ground with asynchronous mode, i.e. the satellite velocity is higher than the scanning velocity. The maximum length of a stereo/tri-stereo coverage depends on the wished base-over-height ration (B/H). In case of B/H equal to 0.6, the maximum length is 315km for stereo and 135km for tri-stereo coverage (Gleyses et al., 2012).
2.2 Image description
Within the Pleiades evaluation program kindly organized by ASTRIUM GEO, the 3DOM Unit at the Bruno Kessler Foundation in Trento (Italy) received a Pleiades-1A triplet over Trento for research purposes. The images composing the triplet, hereafter called image1, image2 and image3, were acquired on August 28, 2012 in the morning in North-South direction within 90 seconds, proving the high agility of the camera. The average viewing angles of the three images are, respectively, 18°, -13° and 13° in along-track direction with respect to the nadir and close to zero in across-track direction (Fig. 1), while their mean GSD varies between 0.72m and 0.78m, depending on the viewing direction.
Table 1 summarizes the main characteristics of the images. Thanks to the fast scanning, the illumination conditions remains almost constant during the acquisitions.
The Pleiades images were provided at raw processing level called “SENSOR”, that is, with basic radiometric and geometric processing. This product is indicated for investigations and production of 3D value-added products (Gleyzes et al., 2012).
Fig. 1. Zoom in building area in the three Pleiades images over Trento, acquired with alongtrack acquisition angles 18° (left), --13° (centre) and 13° (right).
Table 1. Characteristics of Pléiades-1A panchromatic triplet. Image 1 Image 2 Image 3 Along-track (°) 12.35 -12.69 17.38 Across-track (°) 1.83 3.00 1.78 GSD (m) 0.72x0.73 0.74x0.73 0.78x0.74 Size (columns) 41427 41149 40436 Size (rows) 36199 36348 34446 Acquisition time 10:22:15 10:23:01 10:22:06 Solar Azimuth (°) 157.85 158.24 157.85 Solar Elevation (°) 51.79 51.85 51.79
The three images cover an area of about 392km2 on the Trento testfield, that already includes two stereopairs from other VHR satellite sensors (WV2 and GE1), single images from SPOT-5 HRG, airborne data (aerial images, Lidar DSM, and UAV images) and terrestrial data (ground measurements of points and vector maps) (Agugiaro et al., 2012). Fig. 2 shows the space- and airborne data extent. Located in the North –East part of Italy, the testfield lies in a valley at 200m height, surrounded by the Alps with peaks at 2100m. It includes urban areas with residential, industrial and commercial buildings at different sizes and heights, agricultural or forested areas, and rocky steep surfaces, offering therefore a heterogeneous landscape in term of geometrical complexity, land use and cover.
Fig. 2. Location of satellite imagery in Trento testfield. Violet: SPOT-5/HRG single scene, orange: Pleiades triplet, red: WV2 stereopair, yellow: GE1 stereopair, blue and green: Quickbird single scenes, white: aerial images, pink: UAV.
3. RADIOMETRIC ANALYSIS
The homogeneity and heterogeneity of an image can depend on operational problems during data acquisition. Large changes in image quality and suitability for automatic feature detection can be strongly affected by sensor view and sun acquisition angles. Even if these factors are well-known, it’s not immediate to compensate the effects induced by each component.
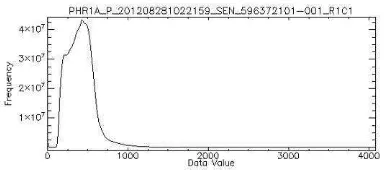
An analysis of the image histograms (Fig. 3 for image 1) shows that the main information is distribute between 0 and 10 bits, even if the data are available at 12 bit.
Fig. 3. Histogram of panchromatic band of image 1.
This histogram distribution causes problems when visualizing the image information in an 8-bit mode, leading to saturation effects that can false analysis and 3D modelling. In fact, stretching the DN values of the data in an 8-bit scale (0-255) can destroy the absolute radiometric accuracy of the image. The linear stretch compresses the data values distribution and the information for low DN and, consequently, pixels with high values saturate (Fig. 4).
Fig. 4. Histogram stretching for panchromatic channel of image1. Left: 12 bit, right: 8bit.
In order to analyse the radiometric distribution and the noise characteristics of the Pleiades images, the approach described in (Poli et al., 2011) for the analysis of WV2 stereopair was followed. The noise analysis has been conducted measuring a normalized standard deviation (Pateraki, 2005). The data have been analysed considering a 5x5 pixels windows. The use of such a small window is justified since homogeneous areas often show low DN value variations, which would lead to higher standard deviation if it were computed from the whole area. In the same way, for non-homogeneous areas, the small window is necessary for getting small homogeneous areas between edges. Each image was divided into 5 bins (0-255, 256-511, 512-1023, 1024-2047, 2048-4095) and for each bin the mean normalized standard deviation was computed and used as noise value. In Table 2 the noise estimation values of the panchromatic and multi-spectral bands of the three images are reported. In some cases, the lack of values in a bin does not allow the measure of the standard deviation (N/A values in the table).
As the panchromatic channels is concerned, the noise values are small and do not vary significantly between bins. The small differences in noise values between images 1, 2 and 3 are likely due to the acquisition angle differences.
Taking into account the R,G,B and NIR channels, again, small noise values are observed. In case of image 2 the information is concentrated in the bins 2 (255-511) and 3 (512-1023) respectively.
The radiometric analysis included the automatic detection of artifacts in the images, like spilling or hot spots generally due to saturated areas, and drop lines, followed by accurate visual inspection. None of the Pleiades images presented such effects, contrarily to what observed in the other VHR stereopairs available in the Trento testfield (Agugiaro et al., 2012). In general the radiometric analysis showed that all the Pleiades images are highly homogeneous, have low noise level and do not present saturation effects.
Table 2. Noise estimation values for each bin of panchromatic and multispectral bands of Pleiades triplet.
Channel Image 0
255 256 511
512 1023
1024 2047
2048 4095 Pan 1 2.26 2.28 2.60 2.61 2.60 Pan 2 2.06 2.06 2.60 2.61 2.63 Pan 3 2.27 2.30 2.60 2.69 2.70 Red 1 2.07 2.26 2.52 N/A N/A Red 2 1.93 2.03 2.57 N/A N/A Red 3 2.10 2.33 2.04 N/A N/A Green 1 2.14 2.40 2.60 2.62 2.62 Green 2 1.97 2.18 2.16 2.79 2.8 Green 3 2.17 2.44 2.60 N/A N/A Blue 1 2.56 2.49 2.51 2.63 2.65 Blue 2 N/A 2.50 2.40 N/A N/A Blue 3 2.57 2.50 2.57 N/A N/A NIR 1 1.60 2.08 2.39 2.43 2.50 NIR 2 1.33 2.05 2.10 2.57 2.63 NIR 3 1.58 2.07 2.39 2.63 2.75
4. IMAGE ORIENTATION AND DSM GENERATION
The geometric analysis was conducted on the VHR panchromatic bands of the three images using opticalSCAPE software (sarmap, 2013). The software, developed by sarmap AG in collaboration with 4DiXplorer AG, works in ENVI environment and supports the processing of spaceborne images in term of radiometric processing, image orientation, automatic Digital Elevation Model (DEM), DEM fusion, orthoimage
generation and pan-sharpening. opticalSCAPE includes the geometric operations already available in SAT-PP software (4DiXplorer, 2013), but improved in terms of usability and performance.
The exterior and interior orientation of each image was described by the Rational Polynomial Coefficients (RPCs) available as metadata information. For the evaluation of the orientation accuracy and, eventually, its improvement, the coordinates of 38 points visible in the scenes were used. The accuracy of the initial RPCs, assessed in each image in correspondence of the available ground points, was in the range 3-5m. For accurate processing, the given RPC were improved by estimating six parameters modelling an affine transformation to remove systematic errors. The estimation was run simultaneously for the three images in a block adjustment using six well distributed ground control points (GCPs) and, as result, a set of correction parameters was estimated for each image to achieve sub-pixel accuracy in the 3D geolocation.
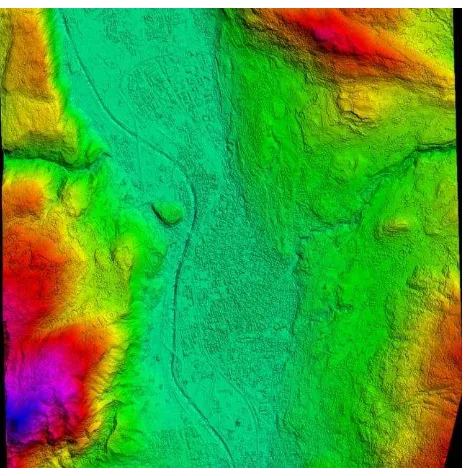
The DSMs were generated with a multi-image least-square matching, as described in (Poli et al., 2009), using a grid space of 1m. For the initialization of the matching, few seed points were manually measured in the stereo pairs in correspondence of height discontinuities to approximate the surface. The DSMs were neither manually edited nor filtered after their generation. Three surface models were generated: two DSMs were obtained using two image combinations (images 1-2 and images 2-3) and the third one using the three images simultaneously (multi-image matching). Fig. 5 shows part of the DSM generated from the triplet.
Fig. 5. DSM from the Pleiades triplet visualized in colour-shaded mode.
5. DSM ANALYSIS
By visual inspection of the three DSMs, the shape of the terrain in flat, hilly and mountain areas is correctly modelled, even in case of rapid height changes. In urban areas the road network, building blocks and large single buildings can be clearly recognised in the surface model, as well as the shape of large buildings (Fig. 6, left). The surface is well modelled even on homogeneous areas, like rural fields, that are critical for image matching (Fig. 6, right).
Fig. 6. Zoom in the images (above) and in the DSM (below) over city center (left, with a large building highlighted in blue) and rural areas (right).
5.1 Comparison between triplet and pairs
From visual inspection the two DSMs generated from the stereopairs showed a good agreement with the DSM generated from the triplet. The height differences with respect to the reference Lidar DSM were computed and no significant differences in the statistics were observed. The advantage of using one additional view is evident in specific situations, when local blunders due to occlusions occur. For example, the yellow circles in Fig. 7 highlight an example of local errors in the DSM generated from images 1 and 2, that do not occur in the DSM generated from images 2 and 3. Other similar situations were observed. The advantage of working with a triplet is that those situations are mitigated or completely solved by combining the three views. It should also be underlined that the stereo configuration of the current triplet is not optimal, as two scenes are acquired with forward viewing and one scene with backward viewing. The availability of a nadir scene would probably reduce the occlusions and increase the matching performance.
Fig. 7. Zoom in DSMs from stereopair 1-2 (left) and 2-3 (right). The yellow circles highlights differences in the two DSMs.
5.2 Comparison with Lidar DSM
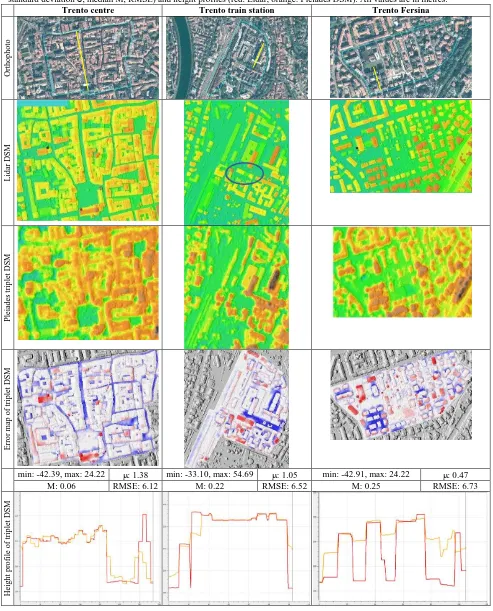
The quality of the three surface models was also evaluated using the Lidar DSM as reference, following the analysis scheme already used for the analysis of the DSMs generated from WV2 and GE1 stereopairs on the same areas (Agugiaro et al., 2012). The analysis was focused on three test areas: 1. Trento city center, characterized by small and buildings closed to each other, 2. Trento train station, with large flat buildings and open areas and 3. Fersina residential area, with separated buildings and open areas. The height differences between the DSM generated from the triplet and the Lidar DSM were computed,
together with their statistics (minimum and maximum values, mean and median value, standard deviation and root mean square error (RMSE)). Table 3 shows the test area location, the reference Lidar DSM, the DSMs and the error maps, together with the statistics. In the error maps the height differences in the range [-1 m, 1 m] were plotted in white, as they are within the intrinsic precision of the sensors, while large positive and negative errors were highlighted in red (Lidar above the DSM) and blue (DSM above Lidar), respectively. From the analysis of the error maps, there is a good agreement between the Pleiades DSM and the Lidar one. In the historic centre of Trento, characterised by small adjacent units and narrow streets, the height of the roofs is estimated quite well, but the height of narrow streets between buildings is overestimated (Pleiades DSM is above Lidar DSM), due to occlusions and shadows. In theory, using a triplet these situations should occur to a limited extent, but, as already mentioned, the current triplet does not include a nadir scene. The availability of a nadir image would likely improve the matching performance.
The red spots in Trento city center occur in correspondence of two churches and are due to matching failure caused by the special homogeneous material used for the roof cover. The manual measurements of seed points on the two buildings could solve the problem.
Some other blunders in the test areas are due to the presence of temporary objects, like construction sites, changes in the urban environment between the acquisition dates of Lidar scans and Pleaiades images and presence of trees, not included in the Lidar DSM. This is the case of the red blunder near the train station, highlighted in blue.
The statistics below each test area confirm the analysis. The minimum and maximum values are due to the above-mentioned situations and affect the value of the average and RMSE, but the median results close to zero.
The analysis of the height profiles (last row in Table 3) confirms that the Pleiades DSM (orange line) follow well the Lidar DSM (red line) on buildings and open areas, but overestimates the height of narrow streets between buildings. The matching error in correspondence of the church roof cover (city center) and the urban change (train station area) are also evident in the profiles. In Trento Fersina, the tall buildings are detected in the DSMs as height peaks, but they are not completed separated, due to occlusions.
5.3 Comparison with other VHR sensors
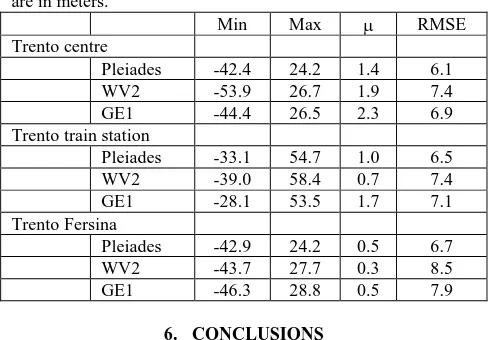
The results obtained from the analysis of the Pleiades DSM were compared to those obtained on the DSMs generated using the WV2 stereopair (mean GSD = 0.51cm) and the GE1 stereopair (mean GSD = 0.50cm) acquired on Trento testfield on August 22, 2010 and September 28, 2011, respectively. The WV2 and GE1 stereopairs were processed following the same workflow described for Pleiades images. The generated DSMs had a grid space of 1m. More information on the images and DSM analysis is reported in (Agugiaro et al., 2012); the statistics of the comparison to the Lidar DSM on the three study areas for the three sensors are summarized in Table 4 for a comparative analysis. In general there is a good agreement between the three surface models generated by Pleiades, WV2 and GE1. For the three optical sensors, errors occurred in case of occlusions (i.e. narrow streets in urban areas), shadows (i.e. close to tall buildings), presence of trees (not modelled in the Lidar DSM) and changes in land cover between Lidar and images acquisition dates. The three surface models give similar results in terms of minimum and maximum values, mean value and RMSE, being Pleiades slightly better than the other two. International Archives of the Photogrammetry, Remote Sensing and Spatial Information Sciences,
Table 3. Quality evaluation of Pleiades DSM with respect to the Lidar DSM: orthophoto with test areas contour (light blue) and profile transect (yellow), Lidar DSM, Pleiades DSM, error planimetric distribution, statistics (minimum, maximum, mean , standard deviation , median M, RMSE) and height profiles (red: Lidar, orange: Pleiades DSM). All values are in metres.
Trento centre Trento train station Trento Fersina
O
rt
h
o
p
h
o
to
Li
d
ar
D
S
M
P
le
ia
d
es t
ri
p
le
t
D
S
M
Er
ro
r
map
o
f
tr
ip
le
t
D
S
M
min: -42.39, max: 24.22 : 1.38 min: -33.10, max: 54.69 : 1.05 min: -42.91, max: 24.22 : 0.47 M: 0.06 RMSE: 6.12 M: 0.22 RMSE: 6.52 M: 0.25 RMSE: 6.73
H
ei
g
h
t
p
ro
fi
le
o
f
tr
ip
le
t
D
S
M
Table 4. Statistics of height differences of Pleiades, WV2 and GE1 DSMs with respect to Lidar for three study areas. Values are in meters.
Min Max RMSE Trento centre
Pleiades -42.4 24.2 1.4 6.1 WV2 -53.9 26.7 1.9 7.4 GE1 -44.4 26.5 2.3 6.9 Trento train station
Pleiades -33.1 54.7 1.0 6.5 WV2 -39.0 58.4 0.7 7.4 GE1 -28.1 53.5 1.7 7.1 Trento Fersina
Pleiades -42.9 24.2 0.5 6.7 WV2 -43.7 27.7 0.3 8.5 GE1 -46.3 28.8 0.5 7.9
6. CONCLUSIONS
The paper investigated a triplet of Pleiades-1A sensor, acquired on August 28, 2012 on Trento testfield, in the North-Eastern of Italy, and kindly provided by ASTRIUM GEO-Information for research purposes. The images were acquired with viewing angles of 18°, -13° and 13° in along-track direction with respect to the nadir and close to zero in across-track direction. The aim of the paper was to address the radiometric and geometric properties of the images, focusing on digital surface modelling. The radiometric analysis on the panchromatic and multispectral bands showed a low noise level in homogeneous areas in all channels and the absence of artifacts like spilling or other saturation effects in the images. For the geometric analysis, the image orientation given by the Rational Polynomial Coefficients was improved with an affine transformation and ground control points, and three DSMs were generated: two from two stereo image combinations and one from the three images simultaneously. The three DSMs were not manually edited nor filtered in post-processing. In general the three DSMs model well the terrain with different topography (flat, hilly and mountains) and 3D features on it (buildings, infrastructures, roads), but local blunders can be removed, or at least reduced, when the triplet is used, instead of two scenes. The quality of the DSMs was assessed quantitatively using a Lidar DSM as reference. The statistics on three study areas shows median values close to zero and RMSE in the range of 6-7m. It should be taken into account that the results are affected by (1) presence of trees and forests, as they are not modelled in the Lidar DSM, (2) temporal changes between Lidar and Pleiades images (building removal or construction, construction sites, etc.). Significant errors in the DSM occur in case of occlusions in narrow streets or near close buildings and in correspondence of homogenous texture (shadows, special roof covers). The surface modelling from Pleiades triplet could be improved with a more suitable acquisition geometry. In fact we expect that a configuration with one nadir and two off-nadir scenes (one forward, one backward viewing) will bring significant improvements in the automatic DSM generation, instead of the configuration of the current triplet, with three off-nadir scenes. A off-nadir scene is also preferred at the orthorectification stage. Finally the DSM obtained from the Pleiades triplet was compared to those obtained from WorldView-2 and GeoEye1 stereopairs on the same area (Agugiaro et al., 2012). In general there is a good agreement between the three surface models, as confirmed by the statistics. The three DSMs give similar results in terms of minimum and
maximum values, mean value and RMSE on the three study areas, being Pleiades slightly better than the other two. Future investigations on Trento testfield will continue the radiometric analysis of all VHR images available and improve the analysis of the surface models by taking into account other modelling strategies and extending the study areas.
ACKNOWLEDGMENTS
This work was partly supported by the 3M project (co-founded Marie-Curie Actions FP7 – PCOFOUND – GA-2008-226070, acronym “Trentino Project”). The authors would also like to thank the Autonomous Province of Trento (PAT) and the Municipality of Trento, for providing spatial data for the testfield, and Astrium GEO-Information Services which provided the Pleiades triplet for research and investigation purposes.
REFERENCES
4DiXplorer AG website, 2013. http://www.4dixplorer.com (last access April 2013).
Agugiaro, G., Poli, D., Remondino, F., 2012. Testfield Trento: geometric evaluation of very high resolution satellite imagery. Int. Archives of Photogrammetry, Remote Sensing and Spatial Information Sciences, Vol. 39(1), pp. 191-196. XXII ISPRS Congress, Melbourne, Australia.
Gleyzes M. A., Perret L., Philippe Kubik, P., 2012. Pleiades system architecture and main performances. Int. Archives of Photogrammetry, Remote Sensing and Spatial Information Sciences, Vol. 39(1), pp. 537-542, Melbourne, Australia.
Lebègue, L., Greslou, D., deLussy, F., Fourest, S., Blanchet, G., Latry, C., Lachérade, S., Delvit, J.-M., Kubik, P., Déchoz, C., Amberg, V., Porez-Nadal, F., 2012. Pleiades-HR image quality commissioning. Int. Archives of Photogrammetry, Remote Sensing and Spatial Information Sciences, Vol. 39(1), pp. 561-566. XXII ISPRS Congress, Melbourne, Australia.
Pateraki, M., 2005. Adaptive Multi-Image Matching for DSM Generation from Airborne Linear Array CCD Data. Ph. D. Dissertation, No 86, Institute of Geodesy and Photogrammetry, ETH Zurich, Switzerland.
Poli, D., Wolff, K., Gruen, A., 2009. Evaluation of Worldview-1 stereo scenes and related 3D products. Int. Archives of the Phot., Remote Sensing and Spatial Information Sciences, Vol. 38(1-4-7/W5), Hannover, Germany (on CDROM).
Poli, D., Angiuli, E., Remondino, F., 2010. Radiometric and geometric analysis of Worldview-2 stereo scenes. Int. Archives of Phot. and Remote Sensing and Spatial Information Sciences, Vol. 38(1), Calgary, Canada (on CDROM).
Poli, D., Caravaggi, I., 2013. 3D modeling of large urban areas with stereo VHR satellite imagery: lessons learned. Natural Hazards, DOI 10.1007/s11069-013-0583-4.
sarmap website, 2013. http://www.sarmap.ch/ (last access April 2013).