APPLICATION OF GEO-SPATIAL TECHNIQUES FOR PRECISE DEMARCATION OF
VILLAGE/PANCHAYAT BOUNDARIES
S. S. Rao a, V. Banu a, A. Tiwari b, S. Bahuguna b, S. Uniyal b, S. B. Chavan b, M. V. R. Murthy c, V. S. Arya d, R. Nagaraja a, J. R. Sharma a
a Regional Centres, NRSC, Hyderabad, India – (ssrao, banu, nagaraja_r, jrsharma)@nrsc.gov.in b Regional Centres, NRSC, Hyderabad, India – [email protected], (shailja.bahuguna, uniyal.swati,
sapanabchavan)@gmail.com
c APSRAC, Hyderabad, India – [email protected] d HARSAC, Haryana, India – [email protected]
KEY WORDS: Panchayati Raj Institution, Space based Information Support for Decentralized Planning, Geo-spatial, Cadastral Maps,
High Resolution Satellite Imagery (HRSI), Ground Control Points, Village/Panchayat Layers.
ABSTRACT:
In order to achieve the overall progress of the country with active and effective participation of all sections of society, the 12th Five Year Plan (FYP) would bring Panchayats centre-stage and achieve the inclusive growth agenda through inclusive governance. The concept of 'democratic decentralization' in the form of a three-tier administration was introduced in the name of "Panchayat Raj". Horizontally, it is a network of village Panchayats. Vertically, it is an organic growth of Panchayats rising up to national level. The Ministry of Panchayati Raj has three broad agenda: Empowerment, Enablement and Accountability. Space based Information Support for Decentralized Planning (SIS-DP) is one of the initiatives taken by Govt. of India with ISRO/DOS for generation and dissemination of spatial information for planning at the grass root level.
The boundary layer for villages across different states/district/block is available with line departments. Most of these data exist at a much generalized scale. These boundaries do not overlay exactly with that of ground realities and may not be suitable for accurate analysis in terms of area, shape, position, etc. To deal with this problem, a strategy is adopted, which makes use of High Resolution Satellite Imagery (HRSI) from Indian Remote sensing satellites and cadastral maps at 1:4000 scale integrated with GIS techniques to enhance the accuracy of geo-spatial depiction of Village/Panchayat boundaries.
Cadastral maps are used to depict the boundaries of land parcels and other features at the village level. These maps are registered to ortho products of HRSI using Ground Control Points. The cadastral maps are precisely overlaid on ortho-rectified HRSI and each parcel vertex is tagged with the real-world geographical coordinates. Village boundaries are extracted from the geo-referenced village cadastral maps. These boundaries are fine-tuned by considering under lap and overlap of neighboring villages and a mosaic is generated at the sub-district and sub-district level. Each village is coded with a unique number based on Ministry of Panchayati Raj and Census department codes. Villages are mapped to their respective Panchayat(s) directory and are dissolved in GIS environment based on code/nomenclature to obtain the final Gram Panchayat Layer.
The present study attempts to showcase the methodology for deriving precise Village/Panchayat Boundaries using geo-spatial techniques. The final output will immensely help the Ministry of Panchayati Raj and Rural Development for implementing the developmental programs in tune with 73rd and 74th constitutional amendments.
1. INTRODUCTION
1.1 Panchayati Raj System
Grass root level development is important to achieve overall growth of the country. Panchayati Raj Institutions, the grass-roots units of self-government, are perceived as pillars of socio-economic transformation in rural India. Panchayat Raj is a system of governance in which gram panchayats are the basic units of administration.
Effective and meaningful functioning of these bodies would depend on active involvement, contribution and participation of
its citizens. Panchayati Raj System follows a three tier hierarchy to facilitate participation of people in rural reconstruction. At the bottom lies the Gram Panchayat that consists of a village or more than one village. A step higher is the Janpad Panchayat also known as taluka or block or mandal panchayat and at the top lies the Zilla (district) Panchayat.
that represent the exact extent of the village boundary at a good scale.(Krishna Murthy et al.2000). Several Governmental bodies and ministries like Ministry of Panchayati Raj (MoPR), Ministry of Rural Development (MoRD) etc. very often require such maps to carry out planning and development exercises at grass root level to add to country's growth (Chattopadhyay et al.1999).
MoPR and Planning Commission of India in collaboration with Indian Space Research Organization/Department Of Space (ISRO/DOS) have decided to generate and disseminate spatial information for planning activities and monitoring them at the same time. Different Geographical Information System (GIS) techniques are required to be integrated with remote sensing data to meet with the aforesaid objective.
1.2 Space based Information Support system for Decentralized Planning (SIS DP)
Space based Information Support system for Decentralized Planning is a national project initiated by ISRO which is supported by Planning Commission, Ministry of Panchayati Raj (MoPR) and Ministry of Rural Development (MoRD) with a goal to strengthen PRIs and stakeholders by disseminating information derived from space and information technology. It targets development at grass-root level through inclusive participation of PRIs. The concept of Decentralization is achieved through a three tier framework of Panchayati Raj System. Panchayats at the three levels— Gram, Block and District will participate in planning activities, their execution and management.
The major components of the project include:
a.Database generation from satellite imagery and related products, for the whole country. The datasets consist of Administrative, Infrastructure, Cadastral, Natural resources, Climatic data, and Socio-economic data that would help PRIs to plan developmental activities in a suitable manner.
b.Creation of IT propelled information dissemination medium that outreach the citizens and facilitates PRIs and stakeholders with better governance and decision making capabilities
c.Capacity building of the PRIs and stakeholders to make use of space based information for socio-economic development.
1.3 High Resolution Satellite Imagery (HRSI)
Resolution of imagery defines that how closely objects can be present to each other and yet can be visibly resolved. It is this characteristic of imagery that quantifies the level of information that can be interpreted from imagery. In effect, spatial resolution refers to the number of independent pixel values per unit length. Various commercial satellites provide the imageries with resolution ranging from 2.5m to0.5m for panchromatic and 1.0m to 10m for multispectral bands. Some existing high resolution satellite imagery includes GeoEye-1 (0.5m), IKONOS (0.8m), World View (0.5m), CARTOSAT-1 (2.5m), LISS IV MX (5.8m multispectral). In this study we are using CARTOSAT-1 (2.5m Panchromatic) and LISS IV MX (5.8m multispectral) imagery.
1.4 GIS and Remote Sensing
Remote sensing was introduced to the world in the year 1960. Before this period aerial photography was in use for cartography, surveillance and studies related to environment. With the development of new methods and technologies for sensing of Earth during the 1960-1970 decade, the sensors were now shifted from airplanes to satellites. The satellites were able to capture more area on a regular basis. In the following years remotely sensed images from the satellite were enhanced with the use of computers and were used for various applications such as environmental monitoring, land use/land cover change etc. Over the past six decades the remotely sensed imagery has improved in resolutions and has its involvement in every field that affects human at large. The use of different satellite imageries for different applications coupled with GIS processing has facilitated researches by generating the various resource information layers in the shortest possible time along with regular updates. The integration of technologies such as GPS, IT with GIS and satellite remote sensing can play a major role in bringing various forms of data (spatial and non-spatial) together to develop potential alternatives for resource development and management.
2. DATA USED AND METHODOLOGY
2.1 Datasets used
There are four sets of data used in the present study viz. Ortho rectified LISS-IV imagery pan sharpened with Ortho rectified Cartosat Imagery, Cadastral maps (1:4000), Vector layer depicting villages (2011) of the AP state, Vector layer depicting villages (2001) of the AP state. The cadastral maps are obtained from the Revenue Department, Government of Andhra Pradesh. The village vector layer (2011) is provided by Andhra Pradesh State Remote Sensing Application Centre (APSRAC). The village vector layer (2001) is procured from India-WRIS project. Given below is the detail of satellite imagery used:
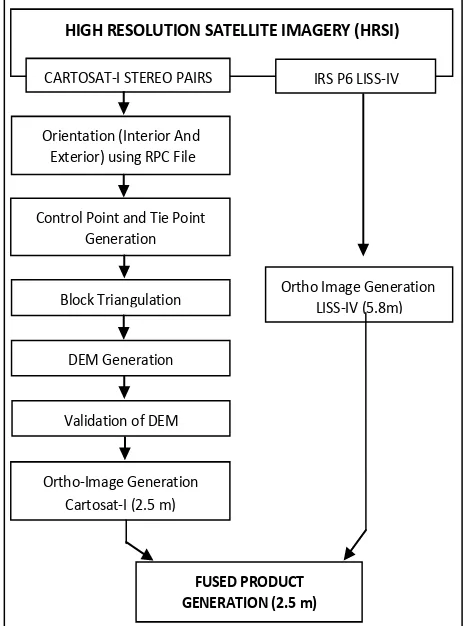
Ortho Image Generation LISS-IV (5.8m)
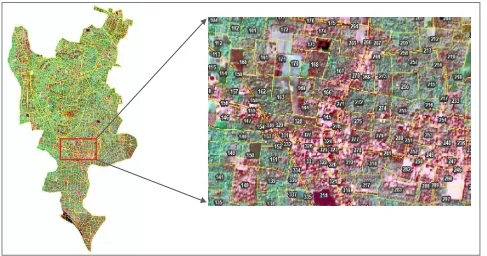
Figure 1: Location of study area
2.3 Preparation of Imagery base
2.3.1 Pre-processing of satellite data
For utilizing satellite data for overlay, it is required to be pre-processed which include ortho-rectification and image enhancement. Image is ortho-rectified using DEM of the area to eliminate topographical errors and distortions caused during image acquisition due to undulating topography of region and sensor angle with respect to the object. The ortho-rectified imagery is further processed with image enhancement algorithm for better appearance and interpretation. Such data can then be used for cadastral parcel boundary overlay.
2.3.2 DEM Generation
Digital Elevation Model (DEM) represents ground surface undulating topography digital format. DEM facilitates the raster data with elevation information of the terrain at pixel level. DEM can be generated by various process like GPS survey, contour mapping or by using stereo pair of remote sensing images. In this paper Stereo pairs of CARTOSAT-1 were used to generate DEM raster of 10m pixel size. Generated DEM raster reveals that the study area is having almost flat terrain.
2.3.3 Ortho-Rectification
The raw imagery captured by satellite has some distortions due to varying topography of terrain and sensor orientation with respect to ground surface. It results in displacement of imagery at pixel level caused by the above factors. Therefore the imagery is required to be geometrically corrected by transformation
techniques so that it can be matched with projection of map coordinate system. Generated DEM using CARTOSAT-1 is used to ortho-rectify LISS IV MX data. In the present paper, using ERDAS IMAGINE 2014, input raster datasets were geo-corrected with reference to UTM projection.
2.3.4 Fused product generation
As per manual (NRSC 2012) the ortho rectified LISS IV MX data have resolution of 5.8m which can be improved to 2.5m using image fusion. Rule based fusion technique preserves the spatial resolution of CARTOSAT-1 ortho-image (2.5m resolution) and multispectral features of LISS IV MX data were used for image fusion. Rule based fusion technique, an in-house development algorithm was used during the process to fine tune the characteristic of image of CARTOSAT-1 and LISS IV MX data. Rule based fusion technique preserves the spatial resolution of CARTOSAT-1 ortho-image (2.5m resolution) and multispectral features of LISS IV MX data.
2.3.5 Image Enhancement
In order to improve image interpretation, the look and contrast of imagery is enhanced by image enhancement algorithms. The output image has better look and contrast which helps in accessing more relevant information out of the image. Various image enhancement techniques are available such as contrast manipulation, histogram equalization, standard deviation, etc. In this paper, the input satellite data has been enhanced using histogram equalization and standard deviation.
Figure 2: Methodology for generation of fused product
HIGH RESOLUTION SATELLITE IMAGERY (HRSI)
CARTOSAT-I STEREO PAIRS IRS P6 LISS-IV
Orientation (Interior And Control Point and Tie Point
Generation
(a) (b) (c)
Figure 3: (a) CARTOSAT-I (2.5m) (b) LISS-IV (5.8m) and (c) Fused Product (2.5m)
2.4 Derivation of Vector Layers from Cadastral Maps
2.4.1 Generation of Village Layer
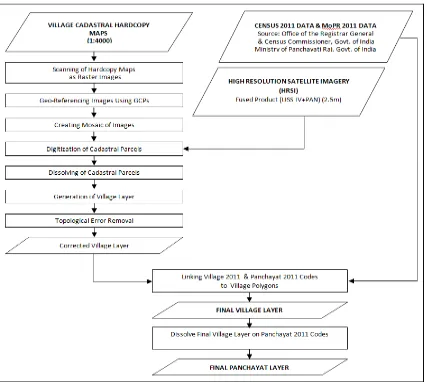
Village cadastral maps available in hardcopy are scanned. The scanned raster files are then geo-referenced with the help of Ground Control Points (GCPs). The georeferenced maps are then stitched together to form a mandal/block level mosaic. These geo-referenced maps are digitized on GIS platform to obtain vector layers depicting cadastral level details. These vector layers are provided spatial reference (Geographic coordinate system WGS84). Further the vector layers are overlaid on HRSI to rectify
the presence of any shifts with respect to background imagery. Obtained cadastral vector layers are then provided the necessary non-spatial attribute information such as village name, block name, etc. Various polygons with the same village name are dissolved to form the village boundary layer.
Figure 5: Methodology for generation of village and panchayat layer
2.4.2 Topological Error Identification and Removal
While preparing a single village layer using village boundaries generated from mandal/block mosaic, topological errors such as overlaps, slivers and gaps are encountered. These errors are removed to generate the final village layer.
(a) (b)
Figure 6: (a) Village boundary with topological errors and (b) Corrected Village Layer
2.4.3 Generation of Panchayat Layer
The village names from the village layer generated above are matched with village names in the database directory compiled by Census Department. When the match is encountered corresponding village code is provided against the village name. Finally with the help of these village codes, the respective panchayat may be linked from MoPR panchayat directory. Each village code is now linked with the panchayat. Village with same panchayat are dissolved on the basis of panchayat code to form the panchayat layer. While dissolving the village polygons, one or more cases can be encountered which are listed below:
2.4.3.1 One-to-one village panchayat mapping
2.4.3.2 One-to-many village panchayat mapping
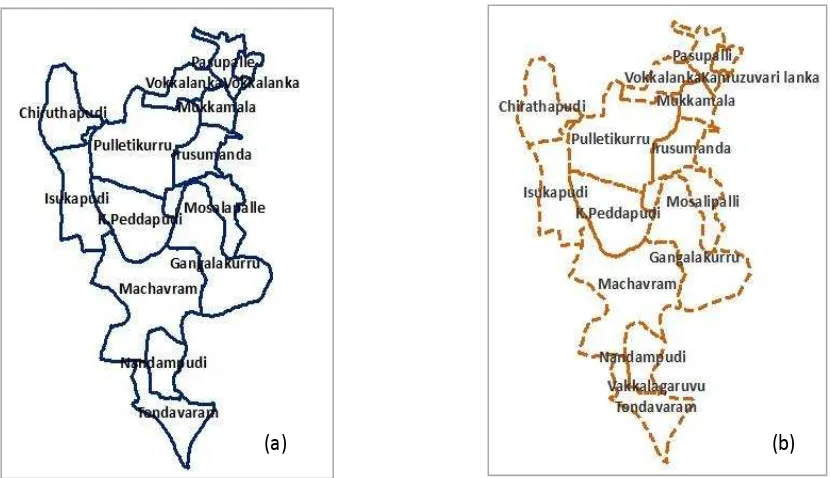
In this case a village is linked to two or more Panchayats i.e. the village is administered by more than one Panchayat. Although the Village and Panchayat boundary will spatially remain same but the attribute table of the panchayat boundary will be appended with a record corresponding to each extra panchayat. As shown in Figure 7, village 'Tondavaram' is mapped to two panchayats 'Tondavaram' and 'Vakkalagaruvu'.
2.4.3.3 Many-to-one village panchayat mapping
In this case more than one village is linked to a single panchayat i.e. single panchayat administers more than one village. Therefore the panchayat layer differs from that of the
village. If neighboring villages are linked to a single panchayat, respective polygons are fused to a create a single polygon. Otherwise if the villages exist apart, the Village and Panchayat boundary will spatially remain same but the attribute table of the panchayat boundary will have reduced number of records due to creation of multipart polygons.
Since this case is not present in the study area, a different mandal 'Kollapur' in Mahbubnagar district of Andhra Pradesh state has been taken to demonstrate this case. As shown in Figure 8, villages: Ambaragiri, Asadpur, Bollaram and Yellur are mapped to a single panchayat 'Yellur'. Thus the panchayat 'Yellur' in the panchayat boundary layer is generated by dissolving the above four village polygons.
Figure 7: (a) Village boundary of the study area and (b) Panchayat boundary of the study area
Figure 8: (a) Village boundary of Kollapur mandal and (b) Panchayat boundary of Kollapur mandal
(a)
(b)
3. RESULTS AND ANALYSIS
3.1 Boundary Comparison
There are three village boundaries that are to be compared. The village boundary layer derived from cadastral parcels, village boundary layer (2011) and village boundary layer (2001). All the three village boundaries are overlaid on High Resolution Satellite Imagery (HRSI) and compared.
3.1.1 Comparison between Village boundary (2001) and Village boundary (derived from cadastral maps)
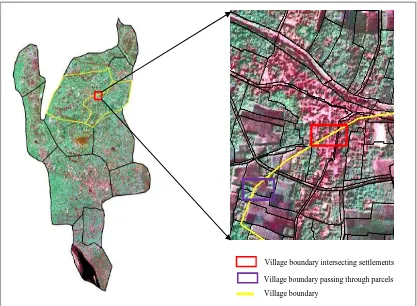
The village boundary (2001) overlaid on HRSI is shown in Figure 9. It is clearly visible that the boundary is intersecting the settlement cluster. Ideally the settlement cluster should have been assigned to a single village polygon but here only partial cluster is being covered by the given village boundary and the remaining part is wrongly assigned to the neighboring village.
Secondly, the village boundary is passing through the mid of land parcels due to which a single parcel is assigned to two villages. It is therefore evident that the village boundary 2001 provided is inaccurate.
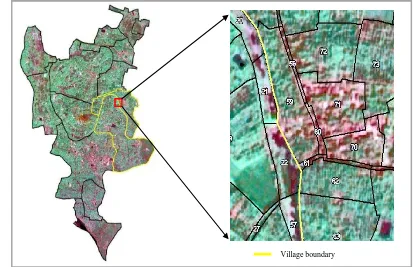
The village boundary derived from the cadastral maps shown in Figure 10, deals with both of the above mentioned problems viz. assignment of single settlement cluster to two different village polygons and assignment of a single cadastral parcel to two different village polygons. This boundary is formed in such a manner that the settlement cluster lies on a single side of it thus assigning the settlement cluster to a single village polygon. The boundary overlaid on HRSI reveals that it does not cross through the cadastral parcels and it lies along the linear features such as roads, canals etc.
Figure 9: Village boundary 2001 overlaid on HRSI
Village boundary intersecting settlements
Village boundary passing through parcels
Figure 10: Village boundary (derived from cadastral map) overlaid on HRSI
3.1.2. Comparison between Village boundary (2011) and Village boundary (derived from cadastral maps)
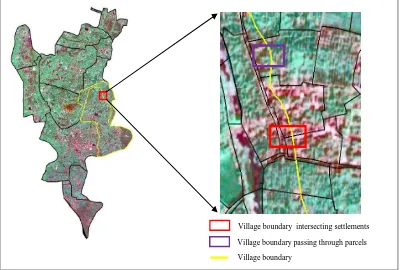
The village boundary (2011) overlaid on HRSI is shown in the Figure 11. The village boundary is intersecting the village cluster assigning the same village cluster to two different village polygons. Further the village boundary is passing
through the mid of the land parcel dividing it into two parts with each part assigned to different village polygon. Ideally a single land parcel or a village cluster should be mapped to a single village polygon.
Figure 11: Village boundary 2011 overlaid on HRSI
Village boundary
Village boundary intersecting settlements
Village boundary passing through parcels
The village boundary derived from the cadastral maps is free from problems associated with 2011 village boundary viz. assignment of single settlement cluster to two different village polygons and assignment of a single cadastral parcel to two different village polygons. This boundary is generated in such
a way that it does not intersects the settlement cluster or a
Figure 12: Village boundary (derived from cadastral map) overlaid on HRSI
3.1.3 Relative shift in boundaries
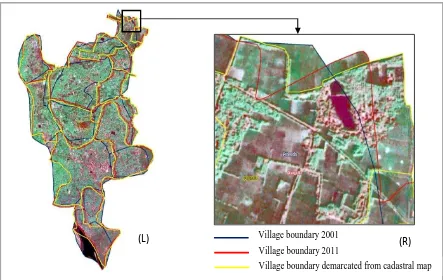
The Figure 13 shows the relative comparison of the three different village boundaries viz. village boundary 2001, village boundary 2011 and village boundary derived from cadastral parcels over HRSI. The shift among the boundaries is clearly visible. The demarcation of villages through these boundaries differs a lot in accuracy. A region of interest (ROI) is selected to showcase the shift among boundaries and accuracy of demarcation. The ROI consists of settlement cluster and land parcels. Village boundary 2001 bisects the settlement cluster as well as the land parcels which results in mapping of the same area to two different village polygons. Village boundary 2011 demarcates the settlement cluster and parcels in a better way than the village boundary 2001 but still intersects with the settlement cluster and parcels. It results in incorrect mapping of the intersected region to neighboring village. The mapping still remains inaccurate.
On the other side, the village boundary derived from cadastral parcels clearly outlines the settlement cluster and land parcels with high level of accuracy. This boundary neither intersects with the settlement cluster nor pass through the mid of calculation on area, perimeter, centroid, etc.
4. CONCLUSION
The present study has demonstrated the application of spatial technique to accurately generate a Village Boundary using large scale cadastral maps (1:4000) and HRSI. This village boundary can further be used to generate Panchayat boundary. These boundaries properly fit over HRSI and associates minimal shifting along linear features. This facilitates in achieving better results with respect to area, perimeter, centroid calculation, etc. These boundaries can be effectively used by different organizations for carrying out various planning and development exercises. Different schemes and project initiative by Govt. of India like "Space Based Information Support for Decentralized Planning (SIS-DP)" have an emphasis on the need of precise village boundary for mapping the assets. These boundaries facilitate for the precise mapping of assets to respective villages which otherwise might be mapped to wrong village.
Figure 13: (L) Village boundaries (2001, 2011, and derived from cadastral map) overlaid on HRSI and (R) Boundaries overlaid on Region of Interest (ROI)
ACKNOWLEDGEMENT
This work was performed under Space Based Information Support for Decentralized Planning (SISDP) project carried by Indian Space Research Organization (ISRO) at NRSC, Hyderabad. The project team sincerely thanks Dr. V. K. Dadhwal, Director, NRSC for his encouragement and technical guidance. Authors thank Director General of APSRAC and Chief Scientist of HRSAC for providing valuable data and guidance. Authors also thank Research Scientists of SISDP and India-WRIS for their support.
REFERENCES
Chattopadhyay, S., Krishna Kumar, P. and Rajalekshmi ,K.1999. Panchayat resource mapping to panchayat level planning in Kerala: An analytical study discussion paper no. 14
Govind Kumar, V.V., Venkata Reddy, K., and Pratap, Deva 2013. Updation of Cadastral Maps Using High Resolution Remotely Sensed Data. International Journal of Engineering and Advanced Technology (IJEAT) ISSN: 2249 – 8958, vol.2, no.4.
Kaczynski, R. 2012. Transfer of technology for cadastral mapping in tajikistan using high resolution satellite data. International Archives of the Photogrammetry, Remote Sensing and Spatial Information Sciences, vol. XXXIX-B6 ISPRS Congress-2012.Krishna Murthy, Y.V.N., Srinivasa Rao, S., Srinivasan, D. S. and Adiga, S. 2000. Land
Information System (LIS) for rural development. Technical proceedings, Geomatics-2000.
National Remote Sensing Centre (NRSC) 2012, Preparation of Geospatial layers using high resolution (carosat-1 PAN+ LISS -IV MX) Ortho-rectified satellite imagery,ver.no.2, Hyderabad.
Parida, P.K.,Sanabada, M.K., Mohanty, N.D.and Mohapatra, A.K. 2012.Cadastral Resurvey using RS,GIS,DGPS and ETS in Bijepadmanabhapursasana of diga pahandi Tahasil, Ganjam district, Odisha, India. 14th Annual India Geospatial forum Conference, (7-9 Feb2012).
Rao, D.P., Navalgund, R.R. and Krishnamurthy Y.V.N.,1996.Cadstral applications using IRS-1C data some case studies.Current science, vol. 70, no.7.
Srinivasa Rao, S., Krishna Murthy, Y.V.N., Joshi, A.K., Shantanu, B., Das, S.N. and Pandit, D.S. 2003b. Computerisation and Geo-referencing of cadastral maps in Chhattisgarh State. Technical Document, Regional Remote Sensing Service Centre/ISRO, Nagpur.
Srinivasa Rao and Krishna Murthy, Y V N. 2008. Accuracy Assessment in Vectorisation and Geo-Referencing of Cadastral Maps. INCA 2008 presentation.
Zahir, A., Tuladhar, A.,Zevenbergen, J. 2012.An integrated approach for updating cadastral maps in Pakistan using satellite remote sensing data. International Journal of Applied earth Observation and Geoinformation vol. 18, pp. 386-398.
Village boundary 2001
Village boundary 2011
Village boundary demarcated from cadastral map