MONITORING LAND USE WITH REFERENCE TO AQUACULTURE IN CHINNA CHERUKURU VILLAGE OF NELLORE DISTRICT, ANDHRA PRADESH, INDIA – A REMOTE SENSING AND GIS BASED APPROACH
Manoj Raj Saxena a *, Kuntal Ganguly a, B. Shyam Sunder a, G. Padma Rani a, Ananth Rao a G. Ravi Shankar a
a
Land Use & Cover Monitoring Division, National Remote Sensing Centre, ISRO, DOS, Hyderabad, India- (manojraj_saxena, padmarani_g, ananth_rao shyamsunder_b, ravishankar_g)@nrsc.gov.in, [email protected]
KEY WORDS: LUCC, IRS LISS IV, Cartosat, Aquaculture, Agriculture
ABSTRACT:
The present study focuses on the dynamics of conversion of agricultural land to aquaculture over a decade from 1995 to 2013 in Chinna Cherukuru Village (Thotapalligudur Mandal) in Nellore District of Andhra Pradesh State, India.
Multi temporal satellite data from 1995’s medium resolution to high resolution IRS LISS IV & Cartosat of 2013 time frame was analysed and mapped using RS & GIS techniques to monitor the dynamics of land transformation from agriculture to aquaculture (1995’s) and conversion back to agriculture in 2013.
It was observed that, in 1995 aquaculture was practiced to an extent of 62.35 hectares which accounts to 9.48% of the Total Geographic Area (TGA) of the village (658.01 hectares), whereas in 2001 there is a major conversion from agricultural land to aquaculture accounting to an extent of 237.01 hectares or 36.01% of total village area . However, thereafter there was a significant conversion back to agriculture accounting to an extent of 27.23 hectares or 4.13 % of TGA in 2013. The study tries to understand the underlying reasons for conversion back to agriculture which were due to several factors that include outbreak of diseases in aquatic fauna, natural calamities, variation in production cost / selling cost and non-availability of infrastructure facilities like cold storages etc.
The present village level study on LUCC database provides an answer key question about socio-economic issues, land use and cropping pattern which form important input for environmental management.
* Corresponding author at: LU&CMD, National Remote Sensing Centre, ISRO, DOS, Balanagar, Hyderabad 500037, India
Tel.:04023884239
E-mail:[email protected] (M. R. Saxena)
1. INTRODUCTION
Aquaculture has been a fast-growing industry because of significant increases in demand for fish and seafood throughout the world. It is growing more rapidly than any other segment of the animal culture industry (Gang et al. 2005). In India, aquaculture has transformed from a traditional to a commercial activity in the last two decades and the area under shrimp culture has increased from 65,100 ha to 1,75, 674 ha between 1990 and 2006 (MPEDA, 2007). The industry has grown enormously, leading to purchase of agricultural and fallow lands by entrepreneurs for setting up small and large-scale aqua farms in Indian coastal states.
Although intensive aquaculture practices provide foreign exchange from exports, one may strongly question whether it benefits the country and its indigenous population in terms of sustained socio-economic benefits (Meltzoff and Lipuma, 1986; Goodland and Ledec, 1987; Bailey, 1988; Primavera, 1991). The switching from food to cash deletes the social / cultural experience of sustainable resource use. The progressive exploitation of the ecosystem to expand the economy has made it necessary to redevelop the ecosystem in order to maintain the economy (Regier and Baskerville, 1986). The sustainability issues are intertwined with the environmental and social impacts of shrimp farming. The environmental impacts include conversion of mangrove area into shrimp ponds and consequent loss of the direct and indirect benefits from mangrove ecosystems, conversion of
agricultural land, Stalinization of the agricultural land, reduction in paddy production in areas where shrimp ponds are located, Stalinization of nearby aquifers, deterioration of quality of groundwater and discharge of effluents by shrimp farms to the nearby estuaries and rivers causing deterioration of quality of water both irrigation and potable in the surrounding locality (Primavera, 1991; Pillay, 1992; Rajalakshmi, 2002). The expansion of shrimp farming is subject to criticism not only because of the above mentioned offsite environmental factors but also for its on-site adversities. Inappropriate and excess use of chemicals, fertilizers and accumulation of excess feed in the pond bottom makes the soil acidic and unsuitable for any further use either for agriculture or other fish culture, at least in the short run. This leads to the problem of irreversibility (Krutilla and Fisher, 1985) of environmental damage created by a particular economic activity. Moreover, intense use of chemical, fertilizers and antibiotics translate into the disease outbreaks in shrimp ponds and hence pose financial risk to the shrimp farmers.
Conventional methods used to estimate aquaculture land use such as manual surveying and collection of secondary data from the farmers, field or revenue records are labour intensive, time consuming, non-repetitive, and inaccessible to remote areas, low in accuracy and not synoptic. Such data do not provide with information on the associated land features of aquaculture farms. Hence, there is a need for a method of obtaining real-time data on a continual basis for the assessment
of larger areas so that coastal aquaculture resources can be utilized effectively.
Remote sensing techniques have emerged asappropriate tools in providing with spatial information because of their systematic approach in data acquisition through satellites, affordability, high level of precision and the possibility of obtaining time-series data. Satellite images are increasingly being utilized as data sources in conjunctionwith geographical information system (GIS) for mappingvarious land resources and monitoring changes over time. The characteristic absorption feature of water bodies and crop lands has been utilized for their detection from multi-spectral measurements made by IRS/Resourcesat-LISS-3 and LISS-4, Landsat-TM/ETM+ and IKONOS. Global Positioning System (GPS) identifies the position on the earth by using the satellites in space and maps the arealextent of different land types in the field.
The present study was carried out in Nellore district of Andhra Pradesh to understand the nature of shrimp farming practices and its transformation from agriculture followed, causes behind such transformation from agriculture to aquaculture and again back to agriculture, its impact on the socioeconomic status of local population, the influence of extension support and the constraints if any faced by the farming community.
2. MATERIALS AND METHOD
2.1 Study Area
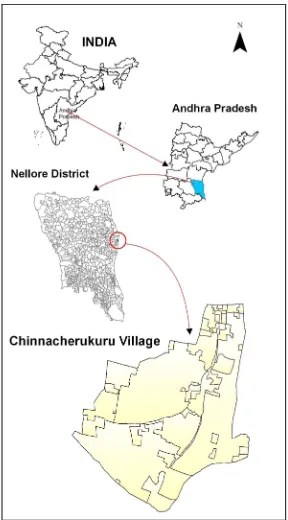
The study area, Chinna Cherukuru village of Nellore district, Andhra Pradesh is situated towards east 7 km from the district headquarter and lies in between 14°25'40.84"N to 14°25'59"N and 80° 2'27.08"E to 80° 3'15.89"E. The terrain is nearly level to gently sloping plain. Earlier, a major portion of the study area was under paddy cultivation and subsequently aquaculture ponds were developed.
Figure 1. Location map of the study area
2.2 Data Used
The digital satellite images from Landsat – TM of 1995, IRS P6 - LISS IV of 2001 and 2013 and cadastral map of the present study area were used to delineate and monitor changes in the spatial extent and distribution pattern of aquaculture farms.
2.3 Software used
In the present study a GIS and Remote Sensing based approach has been taken to monitor the land transformation to aquaculture. Thus, ArcGIS 10.2.1 and Erdas Imagine 2014 has been used as a powerful tool for spatial analysis. Apart from the spatial analysis the statistical analysis has been done using Microsoft Office Excel 2007.
2.4 GIS Analysis
In the present study a cadastral based integrated mapping technique has been adopted for land use categorization. The cadastral database has been designed in ArcGIS 10.2.1 geodatabase and has been updated using multi temporal satellite images, without affecting the owner details. The transformation of land of each land owner has been mapped at different temporal levels. Aquaculture farms with their associated features were mapped using ArcMap. The areal extent and spatial distribution for each dataset were estimated using ArcMap attributes. The detailed work flow of the study is given in Figure 2.
Concept ualizat ion of Resea rch Pla n
Methodology
Figure 2. Workflow of the study
3. RESULTS AND DISCUSSION
Land-use change occurs initially at the level of individual land parcels when land managers decide that a change towards another land-use/land-utilization type is desirable. Overall, each and every land-use decisions creats land-use/cover changes at higher spatial levels. Land owners respond, however, mostly to internal and external influences on the land-management unit, and their decisions are influenced by their personal traits and local environmental conditions as well as by the immediate and broader environmental, socio-economic, institutional, and political settings within which the land unit is embedded.
Turner et al. distinguish the macro-level societal factors further-according to the role they play in the process of change
0 0.25 0.5 1 1. 5 2 Kilometers
¯
Chinnacherukuru Village Chinnacherukuru Village
LANDSAT TM IMAGERY (1995) LAND USE / LAND COVER
Legend
IRS P6 LISS-IV MX (2001) LAND USE / LAND COVER
Legend
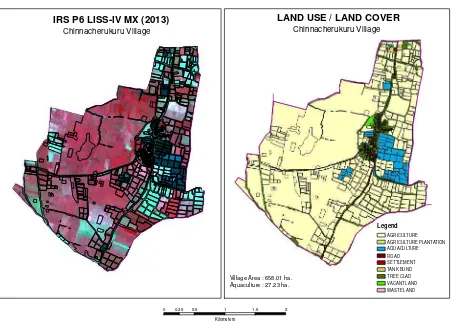
IRS P6 LISS-IV MX (2013) LAND USE / LAND COVER
Legend
proximate sources of change. Anthropogenic activities are those fundamental societal forces that are the essential, deeper causes of land-use change, bringing about changes in population, technology, and socio-cultural and economic organization that lead to land-use change.
In the present study the individual land unit is a parcel of land of any size that may belong to an individual, a group of individuals, or to the state. These parcels were under agricultural (crops, plantation, etc.) prior 1995. The particular ownership, current use, and the geographical setting in which transformation has been taken place at Chinna Cherukuru village of Nellore district of Andhra Pradesh state, India during last two decades.
Satellite images from the Landsat TM, IRS P6 LISS IV were used to estimate the aquaculture as well as agriculture farms besides their spatial distribution at the different stages of aquaculture development. Aquaculture ponds were identifiable as different shades of blue and enclosed by well laid regular shaped (square or rectangular) lines (bunds). The aquaculture maps with their associated features were prepared for four classification maps were compared to compute the change percentage of each class, especially of wetland classes (Table 1).
Table 1. Change area statistics of the study area
According to Landsat data of year 1995, aquaculture was confined to 62.35 ha (Figure 3). Over time from 1995 to 2001 aquaculture activities increased. The IRS LISS 4 data of year 2001 indicated that the area under aquaculture farms rapidly increased to 237.0 ha (Figure 4).
Farms have been developed in clusters and larger areas of lands were converted for aquaculture between 1995 and 2001. Whereas, from 2001 to 2013, the most significant change was the decrease of aquaculture ponds. During this time 237 ha. of aquaculture ponds were retransformed (27.23 ha.) to agricultural lands. The maximum increase in aquaculture area from 9.47% to 36.01% of total geographical area occurred between 1995 and 2001 (Figure 5), because of the great attention that aquaculture received as more profitable activity than agriculture. After 2001 it decreased up to 4.86% of the total study area.
Agriculture reduced by 174.65 ha. between 1995 and 2001 because of the failure of monsoon. One of the main reasons behind back transformation of aquaculture to agriculture was White Spot Syndrome Virus (WSSV) disease. Viral diseases are a challenging problem for the global shrimp culture industry and disease caused by WSSV has resulted in large scale losses and consequent production losses to the shrimp culture industry in Asia. All age groups and sizes of shrimp are affected by WSSV in all kinds (extensive, semi-intensive and intensive) of aquaculture systems (Karunasager et al., 1997).
Figure 3. Land use and land cover map of 1995
Figure 4. Land use and land cover map of 2001
Figure 5. Land use and land cover map of 2013
Sl.No Year Area under
Aquaculture (Ha) Per cent
1 1995 62.35 9.48
2 2001 237.00 36.01
3 2013 27.23 4.13
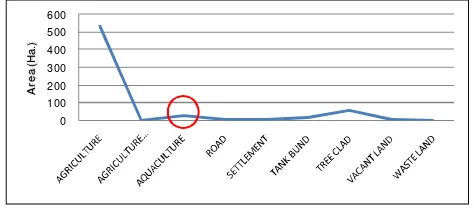
During the ground truth verification, it was noted that the small scale farmers were mostly affected due to the WSSV disease outbreak. The optimum and sustainable use of natural resources for aquaculture (and agriculture) can lead to economic gains, although if badly planned and managed, it can also lead to short and long term economic loss (Philips, 1995). In Andhra Pradesh, abandoned aquaculture farms have been converted back to agriculture and the reconversion did not have any ill effects on agriculture production (Jayanthi, 2006). The statistical analysis of land use maps shows changes of land use classes since 1995 to 2013, but marked changes were observed in two classes, agriculture and aquaculture, where as rest of the classes were having marginal changes (Figure 6, 7 and 8).
0
Figure 6. Distribution of land use classes in 1995
0
Figure 7.Distribution of land use classes in 2001
0
Figure 8. Distribution of land use classes in 2013
4. CONCLUSIONS
Changes in demand trigger changes in land use as they affect the associated profits. Profits are determined also by other factors such as cost (and availability) of labour, capital, and primary inputs (raw materials), the substitution potential among factors of production, the prices of final products and services associated with a particular land use, and state support
(price supports, subsidies, tax exemptions, various economic incentives).
Finally, the size of the parcel and the competition from neighbouring land parcels affect the expected profits and, thus, the land-use change decision comes out. In cases of keen competition, small parcels are usually the first to be bought out by strong land development interests.
The present study indicated the trend and spatial distribution of aquaculture development at Chinna Cherukuru village of Nellore district of Andhra Pradesh between 1995 and 2013 using time series satellite data and GIS. As satellite images provide information on the spatial distribution of different land classes and their associated features, it is possible to develop comprehensive scientific database with accurate, up–to-date land information and carry out periodic assessment on the resource use pattern. With the analytical capability of Geographic Information System, it is possible to quantify the utilisation of various resources with their availability for alternative developments. It is evident from the present study that, spatial tools can provide numerous functions embedded in various components that can be implemented for the sustainable development of aquaculture.
ACKNOWLEDGEMENTS
Authors places on record their deep sense of gratitude to Dr. V.K. Dadhwal, Director, NRSC and Dr. P.G. Diwakar, Deputy Director, NRSC, Hyderabad for their support and motivation to do the work. The authors are also grateful to Dr. T. Ravishankar, Head, LRUMG, NRSC, Hyderabad for his support.
REFERENCES
Bailey, C., 1988. The Social Consequences of Tropical Shrimp Mariculture Development, Ocean and Shoreline Management, 11, pp. 31–44.
Blaikie, P. and Brookfield, H., 1987. Land degradation and society. London, New York: Methuen, pp. 299.
Brookfield, H.C., Lian, F.J., Low, K.S. and Potter, L., 1990. Borneo and the Malay Peninsula. In: The Earth as
Transformedby Human Action. Turner, B.L., II, Clark, W.C.,
Kates, R.W., Richards, J.F., Mathews, J.T. and Meyer, W.B. (eds). Cambridge University Press, Cambridge, pp. 495-512.
Gang, Q., Clark, C.K., Liu, N., Harold, R. and James, E.T., 2005. Aquaculture waste water treatment and reuse by wind-driven reverse osmosis membrane technology: a pilot study on Coconut Island, Hawaii. Aquacultural Engineering, 32, pp. 365–378.
Goodland, R. and G. Ledec., 1987. Neoclassical Economics and Principles of Sustainable Development, Ecological Modelling, 38, pp. 19–46.
Jayanthi, M., 2006. Identification of potential sites for sustainable aquaculture using modern technological tools. CIBA Annual Report, pp. 18-22.
Karunasagar, I., Otta, S.K. and Karunasagar, I., 1997. Histopathological and bacteriological study of white spot
syndrome of Penaeus monodon along west coast of India. Aquaculture, 153, pp. 9 –13.
Krutilla, J. and Fisher, A., 1985. The Economics of Natural Environments, Washington DC. Resources for the Future.
Meltzoff, S. K. and Lipuma, E., 1986. The Social and Political Economy of Coastal Zone Management: Shrimp Culture in Equador, Coastal Zone Management Journal, 14, pp. 349–80.
MPEDA, 2007. Action plan for development of export oriented aquaculture in maritime states of India, MPEDA, Cochin.
Philips, M.J., 1995. Aquaculture and the Environment – striking a balance. Proceedings Infofish-Aquatech ’94 Conference, Aquaculture towards the 21st Century, Colombo, Sri Lanka, pp. 29 - 31.
Pillay T. V. R., 1992, Aquaculture and Environment. Fishing News Books, pp. 108-115.
Primavera, J.H., 1991, Intensive Prawn Farming in the Philippines: Ecological, Social and Economic Implications, Ambio, 20(1), pp. 28-33.
Rajalakshmi N., 2002. Conflicts of Water and Soil resources over Aquaculture Production in Coastal Tamilnadu and Pondicherry, EERC Working Paper Series: MES-2.
Regier, H. A. and Baskerville G.L., 1986. Sustainable Redevelopment of Regional Ecosystems Degraded by Exploitative Development. In Clark, W.C., and R.E. Munn (eds.). Sustainable Development of the Biosphere, pp. 75–101. Cambridge: Cambridge University Press.
Turner, B.L., II, Moss, R.H. and Skole, D.L. (eds). Relating Land Use and Global Land- Cover Change: A Proposalforan IGBP-HDP Core Project. IGBP Report 24/HDP Report 5, International Geosphere-Biosphere Programme, Stockholm.