FOREST ABOVE GROUND BIOMASS ESTIMATION AND FOREST/NON-FOREST
CLASSIFICATION FOR ODISHA, INDIA, USING L-BAND SYNTHETIC APERTURE
RADAR (SAR) DATA
M. Suresh a*, T. R. Kiran Chand a,, Rakesh Fararoda a, C.S.Jha a, V.K. Dadhwal b a Forestry and Ecology Group, National Remote Sensing Centre, Hyderabad- 500 037
(suresh202020m, trkchand, rakesh.rocky630, chandra.s.jha)@gmail.com, b National Remote Sensing Centre, Hyderabad- 500 037 – [email protected]
Commission VIII, WG VIII/7
KEY WORDS: Above ground biomass, SAR, backscatter coefficient, Texture, Support Vector Machine Classification,
EXTENDED ABSTRACT
Tropical forests contribute to approximately 40% of the total carbon found in terrestrial biomass. In this context, forest/non-forest classification and estimation of forest above ground biomass over tropical regions are very important and relevant in understanding the contribution of tropical forests in global biogeochemical cycles, especially in terms of carbon pools and fluxes. Information on the spatio-temporal biomass distribution acts as a key input to Reducing Emissions from Deforestation and forest Degradation Plus (REDD+) action plans. This necessitates precise and reliable methods to estimate forest biomass and to reduce uncertainties in existing biomass quantification scenarios.
The use of backscatter information from a host of all-weather capable Synthetic Aperture Radar (SAR) systems during the recent past has demonstrated the potential of SAR data in forest above ground biomass estimation and forest / non-forest classification.
In the present study, Advanced Land Observing Satellite (ALOS) / Phased Array L-band Synthetic Aperture Radar (PALSAR) data along with field inventory data have been used in forest above ground biomass estimation and forest / non-forest classification over Odisha state, India. The ALOS-PALSAR 50m spatial resolution orthorectified and radiometrically corrected HH/HV dual polarization data (digital numbers) for the year 2010 were converted to backscattering coefficient images (Schimada et al., 2009).
The tree level measurements collected during field inventory (2009-’10) on Girth at Breast Height (GBH at 1.3m above ground) and height of all individual trees at plot (plot size 0.1ha) level were converted to biomass density using species specific allometric equations and wood densities. The field inventory based biomass estimations were empirically integrated with ALOS-PALSAR backscatter coefficients to derive spatial forest above ground biomass estimates for the study area.
Further, The Support Vector Machines (SVM) based Radial Basis Function classification technique was employed to carry out binary (forest-non forest) classification using ALOS-PALSAR HH and HV backscatter coefficient images and field inventory data. The textural Haralick’s Grey Level Co -occurrence Matrix (GLCM) texture measures are determined on HV backscatter image for Odisha, for the year 2010. PALSAR HH, HV backscatter coefficient images, their difference (HH-HV) and HV backscatter coefficient based eight textural parameters (Mean, Variance, Dissimilarity, Contrast, Angular second moment, Homogeneity, Correlation and Contrast) are used as input parameters for Support Vector Machines (SVM) tool. Ground based inputs for forest / non-forest were taken from field inventory data and high resolution Google maps.
1. INTRODUCTION
Forests play an important role in balancing the Earth’s CO2 supply and exchange, acting as a key link between the atmosphere, geosphere, and hydrosphere; therefore, monitoring forest biomass at local to global scales has become a challenging issue in the context of climate change. Tropical forests contain about 40% of carbon found in terrestrial biomass (Dixon et al., 1994; Phillips et al., 1998; Watson et al., 2000). A precise quantification of above ground biomass (AGB) and producing accurate and high resolution up to date forest cover maps in tropical forests are the international efforts to avoiding deforestation and associated emissions. The issue of Reducing Emissions from deforestation and Degradation plus (REDD+) in developing countries has been initiated (Achard et al., 2007;
Gibbs et al., 2007;
http://unfccc.int/resource/docs/2005/cop11/eng/05.pdf). Forest carbon pools consist of trunks, branches, leaves, litter, dead wood, roots and soil carbon. In tropical forests worldwide, about 50% of the total carbon is stored in above ground biomass and 50% is stored in the top 1m of the soil. Because of this, precise and reliable methods are needed for estimating loss of forest cover, land cover change and monitoring forest carbon stocks at national level to assess the economic benefits.
Tropical forests are often difficult to access on the ground because of this satellite observations and measurements could become the primary source for monitoring AGB and producing forest maps. Optical remote sensing has proved to be useful for estimating deforestation and detecting secondary vegetation but it may be obstructed clouds and smokes for most of the times in tropical region and is insensitive to biomass growth. Space borne Synthetic Aperture Radar (SAR) are active systems that transmit microwave energy at wavelengths ranging from 1-100 cm (X band to P band). They are weather and daylight independent. This is very advantageous in tropical regions, which are often covered by clouds. Moreover, radar signal are sensitive to moisture content and vegetation structure properties which may help to forest types (Saatchi et al., 1997; Salas et al., 2002; Neumann et al., 2010).
Polarized SAR at L-band (e.g., ALOS/PALSAR) has been successfully used for estimating AGB (Wolter et al., 2011; Santoro et al., 2009; Cartus et al., 2012; Robinson et al., 2013) and regional land cover classification (Nicolas Longépé et al., 2011) due to the high sensitivity of the backscattered signal at L-bands to forest structure, probably because of strong interactions with tree trunks and branches. In this context, we used ALOS PALSAR 50 m dual polarization (HH/HV) mosaic data for forest above ground biomass (AGB) estimation and forest/non-forest (FNF) classification for the Odisha, India for the year 2010.
The main objective of this research is to investigate the potential of L-band dual polarization SAR (PALSAR) data for state level biomass estimation by using regression method and forest/non-forest classification by using Support Vector Machine (SVM) supervised classification method.
2. STUDY AREA AND DATA
Study area selected for both objectives (Forest AGB estimation and FNF classification) of this research is the Odisha, it is an eastern state of India and which lies between 17.49N latitude to
22.34N latitude and 81.27E longitude to 87.29E longitude (Fig.1). It has an area of 155,707 km2 and extends for 800 kilometres from north to south and 500 kilometres from east to west. Its coastline is 480 kilometre long. There are three major seasons- summer (March-June), Rainy season (July-September) and the winter (October-February) and has tropical climate. It is warm almost throughout the year in the western districts of Sundergarh, Sambalpur, Baragarh, Bolangir, Kalahandi and Mayurbhnj with maximum temperature hovering between 40 - 460 C and in winter, it is intolerably cool. In coastal districts, the climate is equable but highly humid and sticky. The summer maximum temperature ranges between 35-400 C and the low temperatures are usually between 12-140 C. The average rainfall is 150 cm, experienced as the result of south west monsoon during July-September. The state experiences small rainfall from the retreating monsoon in the months of October-November, January and February are dry. The study area, thickly covered by forests both of the tropical moist deciduous type as well as tropical dry deciduous. The hills, plateaus and isolated areas of the north eastern part of the state are covered by the tropical moist deciduous forests whereas the second types of the forests are located in the southwest region of the state. Some of the trees which grow in abundance in Odisha are bamboo, teak, rosewood, sal, piasal, sanghvan and haldi (Roy
Fig.1 False colour composite (HHHVHH-HV) image of study area
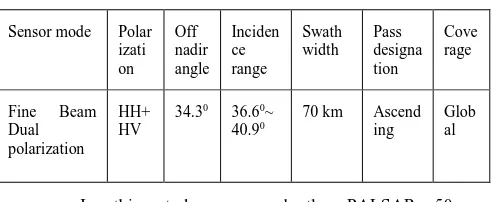
Table 1: ALOS PALSAR mosaic data details
88°0'0"E main land cover classes contained in the study area.
3. METHODOLOGY
The methodology (Fig.3) of this study comprises four parts i.e. Ground sampling data collection, SAR image processing, biomass estimation and FNF SVM classification.
3.1. Ground sampling data collection
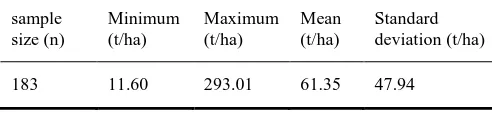
Field inventory data was collected as part of ISRO GBP National Carbon Project in 2009-10 and planned a common inventory design over the entire country with the sample plot size of 0.1 ha. Sample sites were carefully selected to ensure adequate coverage of all major forest types and forest density classes. Forest inventory parameters (Diameter at breast height (DBH), tree height, species, tree density and forest types) were collected from sample sites. Tree level measurements were converted to biomass density using regions and species specific volume equations and wood densities. Forest inventory parameters and their relationship with tree volume has been used to assess plot biomass (table2) using the allometric model developed for this study area.
Ground sampling pints for forest / non-forest classes were taken from field inventory data and high resolution Google maps. Forest sampling locations are taken from forest field inventory data (as explained above). The Non-forest locations are collected using Google maps and taken from Agriculture, Urban/settlement, water bodies and Scrub land areas and considered as one class (Non-forest) because the main aim of this effort is forest and non-forest classification. The number of training and test samples used for the study area is given in
3.2. Calculation of backscattering coefficient
The dual-polarization PALSAR 50 m mosaic data set was as 16-bit Unsigned Integer data with digital number (DN) ranging constant, set at -83.0 dB.
Fig. 3. Overall methodology flow chart
The converted backscattering coefficient images ( ), HH/HV are used for biomass modelling and texture measurement analysis.
3.3. Biomass modelling and mapping
In this research we have used linear regression models with log transformation of field biomass data for establishing relationship between ALOS PALSAR backscattering coefficient ( ) and field biomass (AGB). Before applying regression analysis between PALSAR backscatter and ground sampling data, an average of 3x3 HH/HV backscatter pixels was used for reducing GPS geo location error. The PALSAR HH and HV
Textural information has proven to be efficient for natural target monitoring even if no unique solution has been used to incorporate such information into a classification method (Saatchi et al., 2000; Simard et al., 2000; Kuplich et al., 2005). Two-point statistics such as the grey-level co-occurrence features are among the most commonly used tool for texture characterization (Nicolas Longépé et al., 2011). The Grey Level Co-occurrence Matrix (GLCM) is a statistically based method of obtaining textural information from remotely sensed imagery of all types. The GLCM is computed from a relative displacement vector (d, ϴ), which is based on the spatial distribution of grey level pairs of pixels separated by a distance (d) in a particular direction (ϴ). From this information, a number of textural measurements can be derived (Hralick, 1979) out which eight texture features are frequently used i.e. Mean, Variance, Entropy, Variance, Contrast, Dissimilarity, Homogeneity, Correlation, Second Moment and Mean, all of which have been shown to be useful in discriminating between tropical forest types (Podest et al., 2002). A detailed description of each texture measure can be found in Haralick (1979). Eight image texture measures were extracted for HV backscatter image. Selecting an appropriate window size for texture analysis is critical, as small window sizes often exaggerate differences, while large window sizes cannot effectively extract texture due to smoothing (Lu and Batistella, 2005). Rather than deciding upon a particular window size to generate texture measures in advance, all eight texture measures were generated for a window size 3x3 pixels. Texture was then derived for four commonly used directions within the window (450, 900, 1350 and 00), with the central pixel value derived from integrating all four values. To reduce computational effort the GLCM matrix was constructed using a 64 grey level quantization, since high image quantization levels can generate sparse GLCMs, which may compromise the accuracy of the probability estimates for GLCM and, thus any derived texture measures (Bijlsma, 1993).
All eight texture measures on HV and HH, HV, HH-HV backscatter images were used as input band layers for SVM forest/non-forest classification.
Textural features to be selected by the SVM based methodology for the features selection
3.5. Support Vector Machine (SVM)
SVM was initially proposed to construct an optimal separating hyper plane when data are linearly separable. The hyper plane is constructed to achieve the maximum margins between training samples from different classes based on support vectors, which is defined as the nearest vectors from each class to the hyper plane. When data cannot be linearly separated, kernel function
was introduced to project the original data to higher dimensional space, in which an optimal separating hyper plane can be derived. When misclassification of some training samples cannot be avoided, a parameter C is introduced to indicate the trade-off between penalty of misclassification against simplicity of the hyper plane. A smaller C value indicates more tolerance of misclassification. It was reported that SVM method is largely influenced by the parameters of kernel function and penalty parameter C but not type of kernel function (Vapnik, 1995). In the past, three types of kernel functions were often used: polynomial function, Radial Basis Function (RBF) and sigmoid function. In this study, we used the RBF as the kernel function given the fact that it is independent of data size and dimensionality while achieving good the value of , the further distance it can influence.
In this study, we developed a scheme to combine a grid search method and cross validation (CV) to determine the optimal values of and C when the RBF kernel is applied. The grid search method aims to alternate and C in an efficient way, in which an initial lower bound of and C is first defined. Then, and C will independently increase on an exponential pace at each step until and C reach their upper bound (Hsu, Chang, and Lin 2003). Associated with each pair of and C values, a CV is carried out in the following manner. First, all the training samples are equally split into several folds. Then, an iterative process is introduced to treat one fold as the validation set while the remaining as training ones. A classification was conducted every time when the training and test samples alternated. Then, an average accuracy (over all accuracy) of classification can be calculated from all the training and test sets in the iteration. Consequently, the optimal and C values are those that yield the highest average classification accuracy.
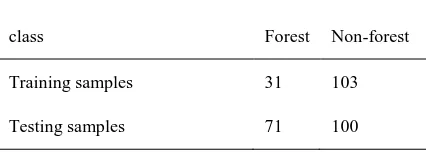
Table 3: Samples used for forest/non-forest classes
class Forest
Non-forest
Training samples 31 103
Testing samples 71 100
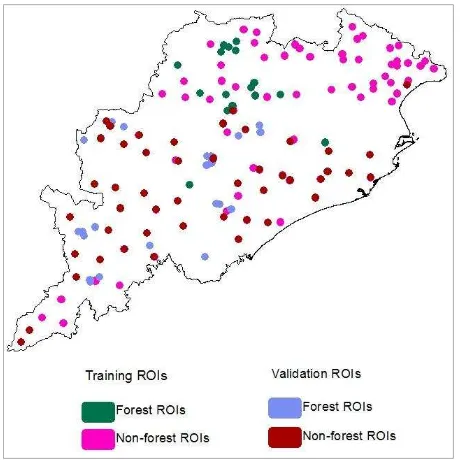
SVM. These eleven band combination improved the accuracy of forest-non forest classification. In this study 102 forest samples and 203 non-forest samples are randomly (shown in fig 4) selected for SVM training and accuracy assessment. These sample data locations are overlay on the ALOS PALSAR bands and converted as the ‘region of interest’ (ROI) for forest and non-forest class’s tools provided by ENVI version 5. The total forest, non-forest ROI’s selected for training is 31 and 103 respectively and for the validation 71 and 100 are taken from different locations. Accuracy validation of the classified maps was based on the independent validation samples as presented
above.
Fig. 4. The spatial distribution of ground sampling locations over India. The Regions of Interest (ROIs) used for the algorithm training and results validation.
4. RESULTS AND ANALYSIS
4.1. Biomass modelling and validation
The major forest types found in all sampling plots were dry deciduous and moist deciduous. The number of sample plots are 183 and the biomass range of these plots between 11.6 and 293 t/ha. The majority of the plots measured AGB were <100 t/ha, the distribution of the AGB within all the sample plots is summarized in Table2 and depicted in Fig.5.
Fig. 5. The percentage of sample plots in distributed AGB
The extracted HH and HV σ0 (dB) variables were correlated with the AGB that was obtained from the sample plots. Both of these, HV polarization backscattering coefficient showing significant response with AGB up to 150 t/ha, after that response is very less and constant. The HV backscatter gave the highest correlation with a coefficient of determination (R2) of 0.508 as compared with HH. Scatter plots showing correspondences of AGB with HH and HV variables are shown in Fig. 6 and summary of models produced is listed in Table 4. The correlation analysis indicates that the AGB has a logarithmic relationship with the variables.
Fig. 6. Relationships between PALSAR HH and HV backscattering coefficient versus plot biomass values shown in (a) and (b) respectively.
Table 4. Logarithmic correlations and coefficients of determination (R2) of AGB and image variables of L-band PALSAR polarizations.
Variable Model R2
HH y = 0.7818ln(x) - 10.167 0.219
HV y = 1.7383ln(x) - 19.782 0.508
Based on the correlation analysis, the backscatter of HV polarization was selected as the AGB prediction model as it gave the best R2 compared to HH. The HV backscatter of all corresponding plots in the study area ranged from 20.39 to -11.07 dB, with a mean of -13.09 dB. The trend line indicates that the biomass component has a logarithmic correlation to the backscatter. The relationship is asymptotic, increasing rapidly at lower AGB levels (i.e. up to 100 t/ha) but constant towards
Cropland
AGB (t/ha)
R² = 0.219 n = 155
-12 -10 -8 -6 -4 -2
0 50 100 150 200 250 300 350
A
LO
S
H
H
σ0
(
d
B
)
Plot AGB (t/ha)
(a)
R² = 0.508 n = 155
-21 -19 -17 -15 -13 -11 -9
0 50 100 150 200 250 300 350
A
LO
S
H
V
σ0
(
d
B
)
Plot AGB (t/ha)
higher AGB levels. The scatter plots clearly show that the HV backscatter gave a good response with AGB at <100 t/ha. A relatively low AGB (i.e. <100 t/ha) was correlated well with low backscatter (i.e. -19 up to -12 dB). The HV backscatter was similar as the AGB increased levelling at around -12 dB. This confirmed that the saturation level of AGB in deciduous forest was at ~100-150 t/ha.
The saturated backscatter value depends mainly on the orientation, size and dielectric constant distribution of the backscattering and forward scattering functions of the individual scatterers (Chen et al., 2009). SAR backscattering will start to saturate when the above ground biomass level reaches at 150 t/ha (Held et al., 2003; Quinones et al., 2004). This means that if the AGB increases to more than 150 t/ha, the backscatter will become almost constant. This was consistent with the findings observed in the study; the backscatter increased rapidly as the biomass increased from 11 t/ha but the sensitivity reduced slightly when biomass exceeded 90 t/ha.
Referring to Table 5, the root mean square error (RMSE) of estimation model was calculated based on the validation plots that were established in the study area. A total of 28 validation plots, which supported an AGB between 11.60 and 219.76 t/ha were used to validate the estimates. An absolute accuracy – a measure of the error between a derived/predicted biomass from satellite image and the actual biomass measured on the ground – was calculated for predicted model (Table 5). The absolute accuracy is expressed as the RMSE, such that:
(3) Where
n the number of validation plots AGBo measured biomass at plot i
AGBp derived/predicted biomass at position i µ Average of biomass difference
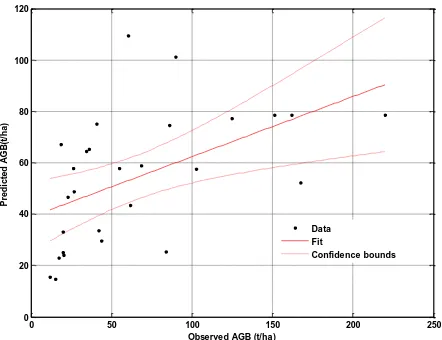
The observed RMSE for all validation plots is ±46.54 t/ha. To further investigate factors contributing to this RMSE, a scatter plot of observed AGB against the predicted AGB was produced by using the same validation plots as illustrated in Fig. 7. The propagation of errors were found to be significantly higher at an AGB >150 t/ha and became larger as the amount of biomass increased.
Table 5: Used model equation for predicted biomass map
Variabl
e Model R2 RMSE (± t/ha)
HV AGB= 2163.3*e0.2922*HV 0.508 46.54
0 50 100 150 200 250
0 20 40 60 80 100 120
Observed AGB (t/ha)
P
re
di
c
te
d
A
G
B
(t
/ha
)
Data Fit
Confidence bounds
Fig. 7. Scatter plot of error propagation obtained from the prediction AGB map. The straight line indicates model fit line between predicted and observed AGB and the dashed curves represent the confidence/error resulted from the estimation.
4.2. Predicted above ground biomass distribution
The spatial distribution of above ground biomass produced from model equation for the study area is shown in Fig.8. The spatial distribution of the AGB in the forest area shows majority of the area was at <150 t/ha, a smaller amount of pixels was related to AGB above 150 t/ha.
Biomass ( t/ha )
1 - 50 50 - 100
> 150 100 - 150
Fig. 8. Spatial distribution of AGB in the study area
4.3. Classification accuracy and SVM forest/non-forest map
Table 6: Confusion Matrix for forest/non-forest classified map
Overall Accuracy = 92.54% Kappa Coefficient = 0.84
Class Forest Non-forest User Acc. (%)
Forest 83.15 0.79 98.69
Non-forest 16.85 99.21 89.22
Prod. Acc. (%) 83.15 99.21
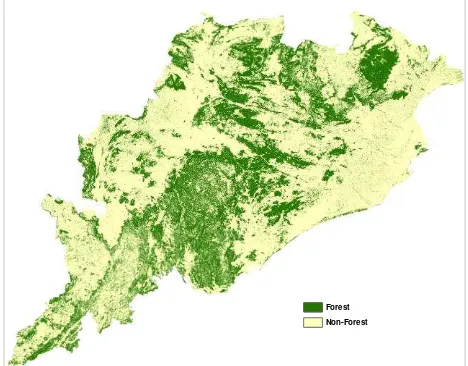
We tested the classification performance of SVM with produced final forest/non-forest classified map. The confusion matrix for produced forest/non-forest classified map over the whole study area is shown in Table 6. This table summarizes the accuracy associated with forest and non-forest classes. It is clearly shows that the SVM method based on ALOSPALSAR data and its textural features have the good capability in forest and non-forest discrimination with an overall accuracy of 92.54% and kappa coefficient of 0.84. Furthermore, this method yielded the highest producer’s accuracy (83.15%) and user’s accuracy (98.69%) in forest classification. It should be noted that the areas used for training and the validation were prepared independently. The final map of forest and non-forest for 2010 is shown in Fig.9.
Forest
Non-Forest
Fig. 9. PALSAR SVM based Forest-Non forest classified map for 2010 of Odisha. Overall classification accuracy is greater than 90%.
5. DISCUSSION AND CONCLUSION
The produced spatial above ground biomass ranges has to be confirmed from previous results for the study area and more comparison analysis has to be done in future. The relation between SAR backscatter and ground biomass has to be improved more because the coefficient of determination from present result 0.508 is not that much good. This study confirmed that with the help of empirical relation for ALOSPALSAR HV backscatter and AGB, we can estimate above ground biomass accurately up to 150 t/ha and above this limit the PALSAR signal is not good response for AGB.
The final forest / non-forest classified map estimated the total forest cover of 50214 km2 with an overall accuracy of 92.54%. The comparison with the standard forest cover map of Forest Survey of India (FSI) and corresponding published area of 50575 km2, ALOSPALSAR data underestimate the area with around 361 km2. Using ALOSPALSAR data the SVM methodology some cases considering scrub land, plantations and trees outside forest are classifying under forest class. This remarkable misclassification will be reduced in further improvement of forest/non-forest cover map. Present estimated forest/non-forest map with overall accuracy 92.54% is well agreement with previous published results that ALOSPALSAR and LANDSAT based forest/non-forest map with overall accuracy 92.4% (Wayne et al., 2010).
ACKNOWLEDGEMENTS
The authors acknowledge JAXA for providing 50m ALOS PALSAR HH and HV mosaics.
REFERENCES
Achard, F., DeFries, R., Eva, H., Hansen, M., Mayaux, P., 2007.Pan-tropical monitoring of deforestation, Environmental. Research Letters 2(4), pp. 045022-1– 045022-11.
Cartus, O., Kellndorfer, J., Rombach, M., Walker, W., 2012. Mapping canopy height and growing stock volume using Airborne Lidar, ALOS PALSAR and Landsat ETM+. Remote Sensing. 4, 3320–3345.
Dixon, R.K., Brown, S., Houghton, R.A., Solomon, A.M., Trexler, M.C., 1994. Carbon pools and flux of global forest ecosystems Science, 263, 185–190.
Gibbs, H., Brown, S., O’Niles, J., 2007. Monitoring and estimating tropical forest carbon stocks: Making REDD a reality. Environmental Research Letters 2(4), pp. 045023-1–045023-13.
Haralick, R., Shaunmugam, K., 1973. Textural features for image classification. IEEE Transactions Systems Man Cybernetics, SMC-3(6), pp. 610–621.
Hralick, R. M., 1979. Statistical and structural approaches to texture. IEEE, 67, pp. 786-805.
Kuplich T., Curran, P., 2005. Relating SAR image texture to the biomass of regenerating tropical forest. International Journal of Remote Sensing, 26(21), pp. 4829–4854. Le Wanga, b., Sai Zhanga, 2014. Incorporation of texture information in a SVM method for classifying salt cedar in western China. Remote Sensing Letters, 5(6),501–510. Lu, D., 2005. Above ground biomass estimation using Landsat TM data in the Brazilian Amazon. International Journal of Remote Sensing, 26(12).
Neumann, M., Ferro-Famil, L., Reigber, A., 2010. Estimation of forest structure, ground, and canopy layer characteristics from multibaseline polarimetric interferometric SAR data. IEEE Transactions Geoscience Remote Sensing. 48(3), pp. 1086–1104.
m Orthorectified FBD Data for Regional Land Cover Classification by Support Vector Machines. IEEE TRANSACTIONS ON GEOSCIENCE AND REMOTE SENSING, 49(6).
Phillips, O.L., Malhi Y., Higuchi, N., Laurance, W.F., Nunez, P.V., et al., 1998. Changes in the carbon balance of tropical forests: evidence from long-term plots Science, 282: 439–442
Podest, E., Saatchi, S., 2002. Application of Multiscale Texture in Classifying JERS-1 Data over Tropical Vegetation. International Journal of Remote Sensing, 23(7) pp. 1487-1506.
Reducing Emissions from Deforestation in Developing Countries: Approaches to Stimulate Action-Draft Conclusions Proposed by the President, United Nations Framework Convention on Climate Change, 2005.
[Online]. Avaialble:
ttp://unfccc.int/resource/docs/2005/cop11/ eng/l02.pdf Robinson, C., Saatchi, S., Neumann, M., Gillespie, T., 2013. Impacts of spatial variability on aboveground biomass estimation from L-band radar in a temperate forest. Remote Sensing, 5, 1001–1023.
Roy, P.S., Kushwaha, S.P.S., Murthy, M.S.R., Roy A., Kushwaha, D., Reddy, C.S., Behera, M.D., Mathur, V.B., Padalia, H., Saran, S., Singh, S., Jha, C.S. & Porwal, M.C. 2012. Biodiversity characterisation at Landscape Level: National Assessment. Indian Institute of Remote Sensing, Dehradun, India, pp. 140, ISBN 81-901418-8-0
Saatchi, S., Nelson, B., Podest, E., Holt, J., 2000. Mapping land cover types in Amazon basin using 1 km JERS-1 mosaic. International Journal of Remote Sensing, 21(6/7), pp. 1201–1234.
Saatchi, S., Soares, J., 1997. Mapping deforestation and land use in Amazon rainforest using SIR-C imagery. Remote Sensing of Environment, 59(2), pp. 191–202.
Salas, W., Ducey, M., Rignot, E., Skole D., 2002. Assessment of JERS-1 SAR for monitoring secondary vegetation in amazonia: II. Spatial, temporal, and radiometric considerations for operational monitoring. International Journal of Remote Sensing. 23(7), pp. 1381– 1399.
Santoro, M., Fransson, J.E., Eriksson, L.E., Magnusson, M., Ulander, L.M., Olsson, H., 2009. Signatures of ALOS PALSAR L-band backscatter in Swedish forest. IEEE Transactions on Geoscience and Remote Sensing. 47, 4001–4019.
Shimada, Masanobu., Isoguchi, Osamu., Tadono, Takeo., Isono, Kazuo., 2009. PALSAR Radiometric and Geometric Calibration. IEEE Transactions on Geoscience and Remote Sensing, 47(12), pp. 3915-3932.
Simard, M., Saatchi, S., De Grandi, G., 2000. The use of decision tree and multiscale texture for classification of JERS-1 SAR data over tropical forest. IEEE Transactions on Geoscience and Remote Sensing, 38(5), pp. 2310–2321. Walker, Wayne S., Claudia, M., Stickler, Josef M., Kellndorfer, Katie, M., Kirsch, Daniel., Nepstad C., 2010. Large- Area Classification and Mapping of Forest and Land Cover in the Brazilian Amazon: A Comparative Analysis of ALOS/PALSAR and Landsat. IEEE Journal of Selected topics in Applied Earth Observations and Remote Sensing, 3(4).
Watson, R.T., Noble, I.R., Bolin, B., Ravindranath, N.H., Verardo. D.J., et al. (eds) (2000). Land use, land-use change, and forestry A special report of IPCC Cambridge University Press, Cambridge