URBAN AREA EXTRACTION USING AIRBORNE X-BAND FULLY POLARIMETRIC
PI-SAR2 IMAGERY
J. Susaki∗, M. Kishimoto
Department of Civil and Earth Resources Engineering, Graduate School of Engineering, Kyoto University; Email:{susaki.junichi.3r, kishimoto.masaaki.88n}@kyoto-u.ac.jp
Commission I, III, VII WG I/2, ICWG III/VII
KEY WORDS:PiSAR-2, Urban area, VHR SAR, Fully polarimetric SAR
ABSTRACT:
In this paper, we present a method to extract urban areas from X-band fully polarimetric synthetic aperture radar (SAR) data. It is known that very high resolution (VHR) SAR can extract buildings, but it requires more processes to map urban areas that should include other objects. The proposed method is mainly composed of two classifications. One classification uses total power of scattering and volume scattering derived by using four component decomposition method with correction of the polarization orientation angle (POA) effect. The other classification uses polarimetric coherency betweenSHHandSV V. The two results are intersected and final urban areas are extracted after post-classification processing. We applied the proposed method to airborne X-band fully polarimetric SAR data of Polarimetric and Interferometric Airborne Synthetic Aperture Radar System (Pi-SAR2), developed by the National Institute of Information and Communications Technology (NICT), Japan. The validation show that the results of the proposed method were acceptable, with an overall accuracy of approximately 80 to 90% at 100-m spatial scale.
1. INTRODUCTION
Human settlement extent data play an important role in discussing urban development and natural resources preservation. When ur-ban areas are rapidly growing, that is the case especially in the developing countries, environmental issues will be caused conse-quently, e.g. traffic congestion, degradation of water quality and traffic conjestion. The data about urban areas are useful to under-stand the current situation and tackle with these issues. Synthetic aperture radar (SAR) has potential to monitor urban areas be-cause man-made structures return relatively strong backscattering to distinguish from other objects. Therefore, SAR images have been applied to detect the buildings damaged by disasters (Cossu et al., 2012). Gamba et al. (2011) reported a method to map human settlement extents using VHR SAR in Asia, Europe and Africa. The method relied on the use of local indicators of spa-tial association (L.I.S.A.) with combination of texture measure, Gray-Level Co-occurrence Matrix (GLCM) textures. The valida-tion results in several study areas show the method did not gener-ate high overall accuracies. Because SAR images may contain the backscattering of objects structure, statistical texture measures may have difficulty in detecting such objects and thus mapping human settlement extents.
In addition to traditional SAR, very high resolution (VHR) SAR has been examined to extract distribution of buildings in urban areas. For example, the mechanism of backscattering from build-ings are modeled and simulated (Brunner et al., 2010; Brunner et al., 2011). With the similar approaches, buildings are extracted (Ferro et al., 2013), building heights are retrieved (Brunner et al., 2010) and building change is detected (Marin et al., 2014). How-ever, actual backscattering mechanism is complicated in urban areas. Ferro et al. (2011) studied the relationship between the double-bounce effect of buildings and the orientation angles in VHR SAR images. Kajimoto and Susaki (2013b) also reported the experimental results in an anechoic room and the total pow-ers of backscattering and the four components (Yamaguchi et al.,
∗Corresponding author.
2005) derived from fully polarimetric scattering are deeply de-pendent on the orientation angles. This issue is quite critical in extracting urban areas and buildings in urban areas.
Airborne VHR SAR has been operated in Japan over the last decades. For example, the National Institute of Information and Communications Technology (NICT) and Japan Aerospace Ex-ploration Agency (JAXA), Japan jointly developed fully polari-metric Polaripolari-metric and Interferopolari-metric Synthetic Aperture Radar (Pi-SAR). The systems are composed of separate X-band (1.5 m slant range resolution) and L-band (3.0 m slant range resolution) radar systems, respectively. After these sensors, NICT developed X-band fully polarimetric Polarimetric and Interferometric Air-borne Synthetic Aperture Radar System (Pi-SAR2). The slant range resolution has been improved to 0.3 m. JAXA also de-veloped another L-band radar system, Pi-SAR2-L2 with 1.7 m slant range resolution. Both systems have been used to monitor the damage caused by disasters, e.g. earthquakes (Satake et al., 2012) and volcanic eruption (Kobayashi et al., 2013). However, the performance to monitor urban areas has not been well exam-ined.
In previous researches, we have already reported a method to ex-tract urban areas by using Advanced Land Observing Satellite (ALOS) / Phased Array type L-band Synthetic Aperture Rader (PALSAR) imagery (Kajimoto and Susaki, 2013a) and another method to estimate urban densities by using a single fully porlari-metric image (Kajimoto and Susaki, 2013b; Susaki et al., 2014). These supervised methods assume to use L-band fully polarimet-ric SAR (PolSAR) images, but it is not guaranteed that they per-form against X-band PolSAR images. Therefore, in this research, we examined the possibility to apply Pi-SAR2 imagery to extract-ing urban areas.
Finally, Section 5 concludes the paper.
2. DATA AND STUDY AREAS
As mentioned in “1. Introduction”, airborne Pi-SAR2 is now op-erated by NICT, Japan. It measures X-band fully polarimetric scattering. The specification of Pi-SAR2 is listed in Table 1 (Ue-moto et al., 2011).
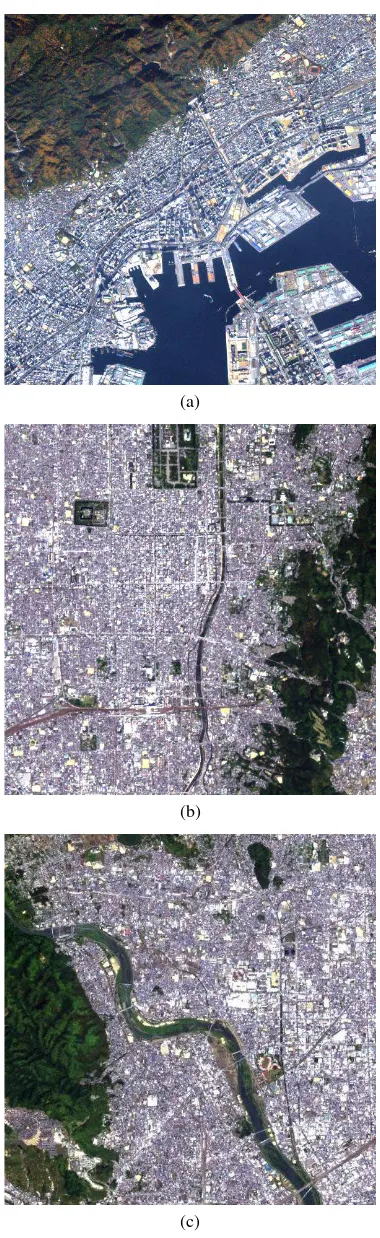
The coverage measured by Pi-SAR2 data is limited. We selected two cities as study areas, Kobe (study area 1) and Kyoto (study areas 2 and 3), Japan among the areas observed because they have several categories of land covers, e.g. urban, mountain and water-body. We selected two areas among Kyoto: central Kyoto (study area 2) and western Kyoto (study area 3). Figure 1 shows the Ad-vanced Land Observing Satellite (ALOS)/AdAd-vanced Visible and Near Infrared Radiometer type 2 (AVNIR-2) optical images of the three study areas. All three study areas have 6×6 km area. Pi-SAR2 images were projected to the WGS 1984 coordinate sys-tem with UTM (Universal Transverse Mercator) projection. The Quegan’s polarimetric calibration procedure (Quegan, 1994) was used for polarimetric calibration.
Center frequency 9.55 / 9.65 GHz Bandwidth 500 / 300 / 150 MHz Slant-range resolution 0.3 / 0.5 / 1.0 m
Azimuth resolution 0.3(1 look) / 0.6 m (2 look) Swath width (grand range) >10 km
NESZ <-23 / -27 / -30 dB
Data rate 200 MB/s×4 ch
Table 1. Specification of Pi-SAR2
3. METHOD AND RESULTS
3.1 Outline
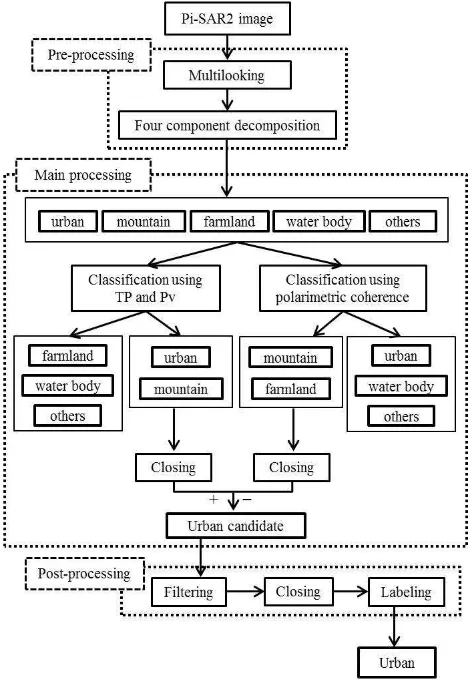
Figure 2 shows the flowchart of the proposed method. First, as preprocessing, multilook processing is implemented and four components are generated with correction of the polarization ori-entation angle (POA) effect. Next, the first classification using total power of scattering (T P) andPv is implemented. Then, the second classification using polarimetric coherency is imple-mented. After both results are intersected, finally, urban areas are extracted.
3.2 Four Component Decomposition and Multilooing
The format of PolSAR data consists of a complex scattering ma-trix expressed by Equation (1):
s= (
SHH SHV
SV H SV V )
= (
a c c b
)
(1)
Here, for simplicity,SHV andSV H are assumed to be equiva-lent. From a scattering matrix, the coherency matrix is derived by Equation (2):
T =
( T11 T12 T13
T21 T22 T23 T31 T32 T33
)
=1 2
( |a+b|2
(a+b)(a−b)∗ 2(a+b)c∗ (a−b)(a+b)∗ |
a−b|2
2(a−b)c∗
2c(a+b)∗ 2
c(a−b)∗ 4|
c|2
)
(2)
(a)
(b)
(c)
Figure 2. Flowchart of extracting urban areas using Pi-SAR2 im-ages.
From the coherency matrix, four-component decomposition de-composes the observed backscattering into four components, the surface scattering power (Ps), the double-bounce scattering power (Pd), the volume scattering power (Pv), and the helix scattering power (Pc) (Yamaguchi et al., 2005). Yamaguchi et al. (2006) proposed an algorithm that rotates the coherency matrix by the POA in order to reduce the dependence of the components on the relative azimuth. The POA is defined by Equation (3).
θ= 1 4tan
−1 2Re(T23)
T22−T33 (3)
A rotation is applied to the coherency matrix by using the POA:
T(θ) =
Here,†denotes complex conjugation and transposition, andRp(θ) is the rotation matrix given by
Rp(θ) =
The coherency matrix is decomposed into four components:
⟨T⟩=fs⟨Ts⟩+fd⟨Td⟩+fv⟨Tv⟩+fc⟨Tc⟩ (6)
Here,fs, fd, fvandfcdenote coefficients of the surface, double-bounce, volume and helix scatterings, respectively, andTs, Td, Tv andTcdenote coherency matrices of the surface, double-bounce, volume and helix scatterings, respectively. Four component de-composition method calculates the four coefficients and thus the contribution of each scattering is determined.
Prior to the four component decomposition, multilooking is con-ducted. While we used VHR SAR images, we focused on the extraction of urban areas, that does not require a high spatial res-olution product, e.g. sub-meter level. Considering the compu-tation time for calculating 6×6 km area, we determined pixel spacing as 2.5 m.
3.3 Classification UsingT PandPv
Following a part of the method proposed by Kajimoto and Susaki (2013a), we useT P andPvfor the first classification. Because of dependency on POA, the method proposed by Kajimoto and Susaki (2013a) set different thresholds based on POA space. How-ever, because the dependency of Pi-SAR2 data on POA was not significant, we applied the method without dividing POA space into sub-spaces.
First, urban areas and mountains training data are manually se-lected from study area 2 because the aspects of mountains in study area 2 are more random than other study areas. Next, prin-cipal component analysis is applied to the training data, and the threshold for discriminating urban areas from mountains is deter-mined. The threshold was determined from the means and stan-dard deviations of the first principal components of the two land cover types. The difference between the means of the two land covers was divided in proportion to the standard deviations, and the break point was obtained. Thereafter, the second component was shifted along the first component as passing the break point, and the shifted second component was used as the threshold. The threshold is then applied to study areas 1 and 3, and an attempt is made to separate the urban areas from mountains. The difference is calculated between the urban gravity points in the new area and in the initial study area, and this difference is used to adjust the threshold. The updated threshold is again applied to the new study area, and the gravity point difference is calculated. Iteration of this process is terminated when the change in the threshold is within a predefined limit. As a results, three lines for discriminat-ing urban areas from mountains, expressed by Equation (7), were obtained.
study area 1: T P =−0.902Pv−69.89 study area 2: T P =−0.902Pv−42.10 study area 3: T P =−0.902Pv−54.68
(7)
Units of TP and Pv are dB, respectively. The result generated at this stage, shown in Figure 3, includes urban areas and a part of mountains. The remaining mountains correspond to the ridges that return strong backscatters. In addition, the extracted urban areas mainly correspond to buildings that are isolated. To gener-ate an urban area map, not building distribution map, we applied closing processing (dilation and erosion) twice.
3.4 Classification Using Polarimetric Coherence
Figure 3. Classification result usingT PandPvbefore closing in study area 1
that polarimetric coherence betweenSHH andSV V, expressed by Equation (8) is a good indicator for the purpose.
γHH,V V =
|⟨SHHS∗V V⟩| √
⟨SHHSHH∗ ⟩⟨SV VSV V∗ ⟩
(8)
Polarimetric coherence is sensitive to surface condition. Because urban areas have various artifacts, they may show lower values than mountains and farmland. In the experiment, the ensemble average was calculated within a 5×5 window, and the threshold forγHH,V V was set to 0.9 from an empirical examination. Fig-ure 4 shows that the higher polarimetric coherence correspond to mountains and farmland. In the same way as classification using
T PandPv, we applied closing to the result two times.
Figure 4. Classification result usingγHH,V V before closing in study area 1
3.5 Intersection and Post-classification
Figures 3 and 4 indicate that the mountains extracted by using
γHH,V V include the mountains remaining in the result usingT P andPv. Therefore, we intersected the image obtained by using
T P andPv and the inverse image obtained by usingγHH,V V.
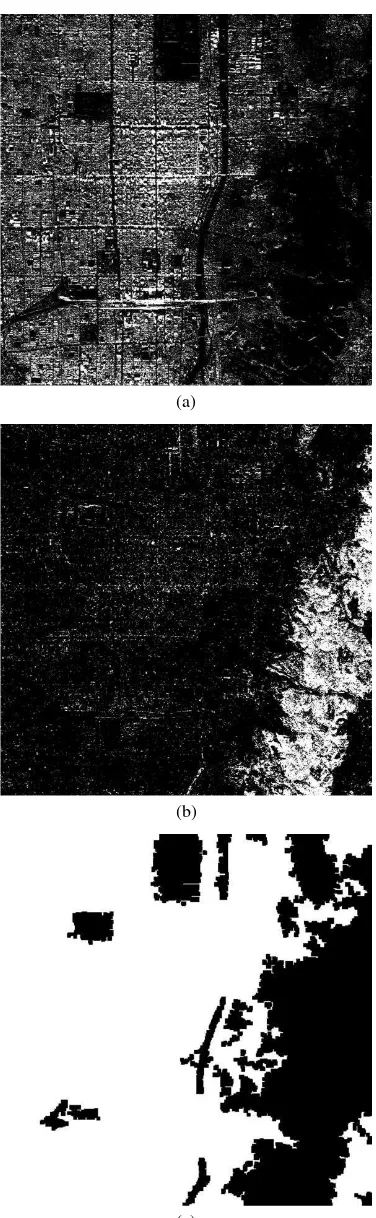
The result is shown in Figure 5(a). This intersected image, named as “urban candidates”, shows urban areas are well extracted, but roads and radar shadow are not extracted. Therefore, we applied filtering, closing (twice) and labeling to the urban candidate im-age. Filtering examined the percentage of urban candidate pix-els within a window. We set the window size to 5×5, and the minimum percentage for urban areas to 20%. Labeling is imple-mented to remove small areas. The minimum urban area was set to 500 pixels, equivalent to 3,125 m2
. Figures 5(b) and 5(c) show the result generated by filtering and closing and the final urban areas, respectively.
Figure 6 shows the classification results usingT PandPv, those usingγHH,V V, and final urban areas in study area 2. Figure 7 show the results in study area 3.
3.6 Accuracy Assessment
Urban area data were obtained from Zmap-TOWN II (ZENRIN) data, which are residential maps of Japan (Zenrin, 2014). First, building polygon data were intersected by a mesh. Buildings ly-ing across the mesh border are divided into pieces by the border line. The mesh size was set to 100 m×100 m. Then, the mesh was classified into urban category or non-urban category. The minimum percentage of buildings within a mesh for classifying into urban category was set to 20%. As a result, a reference map of urban area was generated. Finally, the urban areas extracted from Pi-SAR2 images were compared with the reference map.
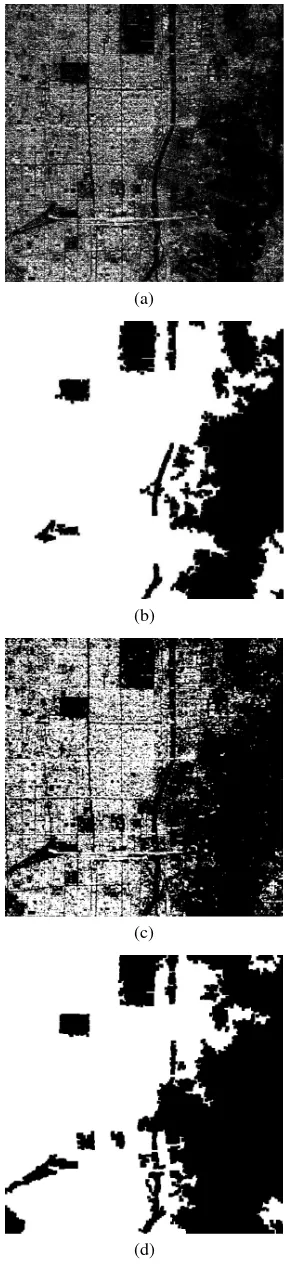
As a reference method, we focused on Esch et al. (2013). They extracted urban areas by using backscatter amplitude and speckle divergence obtained from single-polarization TerraSAR-X and TanDEM-X data. Figures 8 and 9 show the extracted urban ar-eas of study arar-eas 1 and 2, respectively. Figures 8(a) and 9(a), and 8(c) and 9(c) show the extracted urban areas using the pro-posed method and the method of Esch et al.(2013) without post-processing, respectively. Similary, Figures 8(b) and 9(b), and 8(d) and 9(d) show the extracted urban areas using the proposed method and the method of Esch et al.(2013) with post-processing, respectively. Tables 2 and 3 show the accuracy assessment results of study area 1 by using the method of Esch(2013) and the pro-posed method, respectively. Similarly, Tables 4 and 5 show the accuracy assessment results of study area 1 by using the method of Esch(2013) and the proposed method, respectively.
4. DISCUSSION
4.1 Comparison with Existing Method
Tables 2 to 5 show the accuracies of the proposed method are higher than those of the method of Esch et al.(2013). As shown in Figures 8(b) and 8(d), in study area 1, the method proposed by Esch et al. (2013) cannot remove mountains in layovered areas compared to the proposed method. Because of off nadir angle dif-ference, airborne SAR often faces layover compared with space-borne SAR. In study area 2, it was found that the hilly urban areas were missed by the method of Esch et al.(2013) whereas the pro-posed method extracted them. Therefore, the propro-posed method is more effective to extract urban areas by using airborne SAR data than the method of Esch et al.(2013).
4.2 Post-classification
(a)
(b)
(c)
Figure 5. Urban areas in study area 1. (a) Urban candidate areas generated by intersection of Figures 3(b) and 4(b), (b) result gen-erated by filtering and closing (a), and (c) final result gengen-erated by labeling (b).
(a)
(b)
(c)
Figure 6. Urban areas in study area 2. (a) Classification result usingT P andPvwithout closing, (b) classification result using
(a)
(b)
(c)
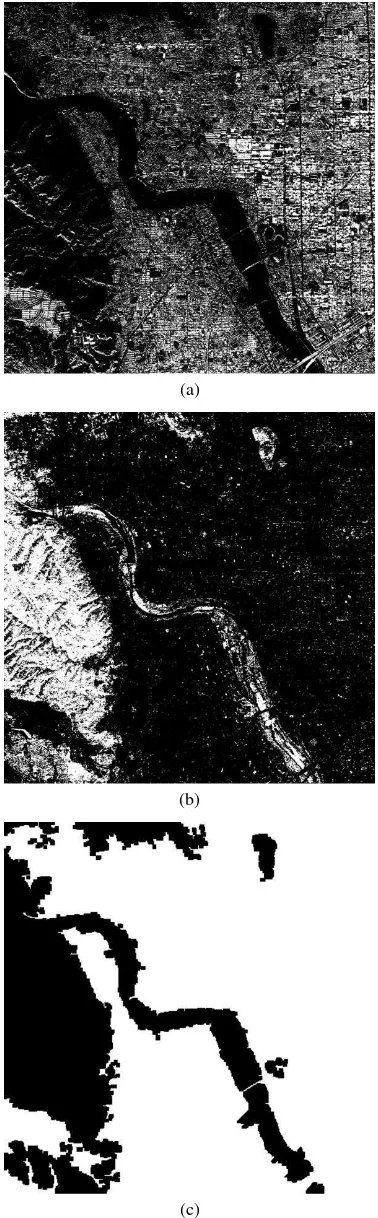
Figure 7. Urban areas in study area 3. (a) Classification result usingT P andPvwithout closing, (b) classification result using
γHH,V V without closing, and (c) final result.
Kobe Reference Producer’s
Esch(2013) Urban Others Total accuracy
Urban 1519 842 2361 64.3 %
Est. Others 10 1229 1239 99.2 %
Total 1529 2071 3600
User’s accuracy 99.3 % 59.3 %
Overall accuracy 76.3 %
Table 2. Accuracy of extracted urban areas in study area 1 by using the method of Esch et al.(2013)
Kobe Reference Producer’s
Proposed method Urban Others Total accuracy
Urban 1522 762 2284 66.6 %
Est. Others 7 1309 1316 99.5 %
Total 1529 2071 3600
User’s accuracy 99.5 % 63.2 %
Overall accuracy 78.5 %
Table 3. Accuracy of extracted urban areas in study area 1
Kyoto Reference Producer’s
Esch(2013) Urban Others Total accuracy
Urban 2160 142 2302 93.8 %
Est. Others 510 788 1298 60.7 %
Total 2670 930 3600
User’s accuracy 80.9 % 54.8 %
Overall accuracy 81.9 %
Table 4. Accuracy of extracted urban areas in study area 2 by using the method of Esch et al.(2013)
Kyoto Reference Producer’s
Proposed method Urban Others Total accuracy
Urban 2431 214 2645 91.9 %
Est. Others 239 716 955 75.0 %
Total 2670 930 3600
User’s accuracy 91.0 % 77.0 %
Overall accuracy 87.4 %
mapping of urban areas should include other objects in urban ar-eas. To deal with this issue, we took an approach that the results of classification should be extended by applying closing filtering. Such approaches can compensate the areas where radar shadow occurs. We suggest that extraction of urban areas using VHR X-band SAR images should be accompanied by such algorithms to extract widely homogeneous areas.
5. CONCLUSIONS
In this paper, we presented a method to extract urban areas from X-band PolSAR data. The proposed method is based on two clas-sifications: classification with combination ofT P andPv, and classification using polarimetric coherency betweenSHHandSV V. The two results are intersected and final urban areas are extracted after post-classification processing. We applied the proposed method to airborne X-band Pi-SAR2 images of Kobe and Kyoto, Japan. The validation show that the results of the proposed method were acceptable, with an overall accuracy of approximately 80 to 90% at 100-m spatial scale. It was also shown that extraction of moun-tains using X-band PolSAR images is more stable than that us-ing L-band PolSAR images. Whereas the sensitivity analysis re-vealed that the most sensitive threshold for extracting urban areas was that forγHH,V V, it was confirmed that the extracted results were stable in most cases. We conclude that the proposed method can be applied to X-band PolSAR images for robustly extracting urban areas.
ACKNOWLEDGEMENTS
This research was supported in part by a program of the PiSAR-2 research announcement of NICT, Japan.
REFERENCES
Brunner, D., Lemoine, G., Bruzzone, L. and Greidanus, H., 2010. Building height retrieval from VHR SAR imagery based on an iterative simulation and matching technique,IEEE Trans. Geosci. Remote Sens., 48, pp. 1487 - 1504.
Brunner, D., Lemoine, G., Greidanus, H. and Bruzzone, L., 2011. Radar imaging simulation for urban structures,IEEE Geosci. Re-mote Sens. Letters, 8, pp. 68 - 72.
Cossu, R., Dell’Acqua, F., Polli, D.A. and Rogolino, G., 2012. SAR-based seismic damage assessment in urban areas: Scaling down resolution, scaling up computational performance,IEEE J. Selected Topics App. Earth Observ. Remote Sens., 5, pp. 1110 -1117.
Esch, T., Marconcini, M., Felbier, A., Roth, A., Heldens, W., Hu-ber, M., Schwinger, M., Taubenbock, H., Muller, A. and Dech, S., 2013. Urban footprint processor–fully automated process-ing chain generatprocess-ing settlement masks from global fata of the TanDEM-X mission,IEEE Trans. Geosci. Remote Sens. Letters, 10, pp. 1617 - 1621.
Ferro, A., Brunner, D., Bruzzone, L. and Lemoine, G., 2011. On the relationship between double bounce and the orientation of buildings in VHR SAR images,IEEE Geosci. Remote Sens. Letters, 8, pp. 612 - 616.
Ferro, A., Brunner, D. and Bruzzone, L., 2013. Automatic detec-tion and reconstrucdetec-tion of building radar footprints from single VHR SAR images,IEEE Trans. Geosci. Remote Sens., 51, pp. 935 - 952.
Gamba, P., Aldrighi, M. and Stasolla, M., 2011, Robust extrac-tion of urban area extents in HR and VHR SAR images,IEEE J. Selected Topics App. Earth Observ. Remote Sens., 4, pp. 27 - 34.
Kajimoto, M. and Susaki, J., 2013a. Urban-Area Extraction From Polarimetric SAR Images Using Polarization Orientation Angle, IEEE Geosci. Remote Sens. Letters, 10, pp. 337 - 341.
Kajimoto, M. and Susaki, J., 2013b. Urban density estimation from polarimetric SAR images based on a POA correction method, IEEE J. Selected Topics App. Earth Observ. Remote Sens., 6, pp. 1418 - 1429.
Kimura, H., 2008. Radar polarization orientation shifts in built-up areas.IEEE Geosci. Remote Sens. Letters, 5, 217-221.
Kobayashi, T., Umehara, T., Uemoto, J., Satake, M., Kojima, S., Matsuoka, T., Nadai, A. and Uratsuka, S., 2013. Volcanic monitoring by polarimetric and interferometric airborne SAR (Pi-SAR2),Proceedings of APSAR 2013, pp. 487 - 490.
Marin, C., Bovolo, F. and Bruzzone, L., 2014. Building change detection in multitemporal very high resolution SAR images,IEEE Trans. Geosci. Remote Sens., 53, pp. 2664 - 2682.
Quegan, S., 1994. A unified algorithm for phase and cross-talk calibration of polarimetric data-theory and observations, IEEE Trans. Geosci. Remote Sens., 32, pp. 89 - 99.
Satake, M., Kobayashi, T., Uemoto, J., Umehara, T., Kojima, S., Matsuoka, T., Nadai, A. and Uratsuka, S., 2012. Damage esti-mation of the Great East Japan earthquake with airborne SAR (PI-SAR2) data,Proceedings of IGARSS 2012, pp. 1190 - 1191.
Susaki, J., Kajimoto, M. and Kishimoto, M. 2014. Urban density mapping of global megacities from polarimetric SAR images, Re-mote Sens. Environ., 155, pp. 334 - 348.
Uemoto, J., Uratsuka, S., Umehara, T., Yamamoto, S.-I., Taira, S., Satake, M., Kojima, S., Kobayashi, T., Satoh, M., Kawasaki, K., Matsuoka, T., Nadai, A. and Suzuki, R., 2011. Development of the onboard processor for Pi-SAR2,Proceedings of IGARSS 2011, pp. 906 - 909.
Yamaguchi, Y., Moriyama, T., Ishido, M. and Yamada, H., 2005. Four-component scattering model for polarimetric SAR image decomposition, Geoscience and Remote Sensing, IEEE Trans. Geosci. Remote Sens., 43, pp. 1699 - 1706.
Yamaguchi, Y., Yajima, Y. and Yamada, H., 2006. A four-component decomposition of POLSAR images based on the coherency ma-trix,IEEE Geosci. Remote Sens. Letters, 3, pp. 292 - 296.
(a)
(b)
(c)
(d)
Figure 8. Comparison of classification results in study area 1. (a)(b) Results by using the proposed method before and after post-processing, respectively, and (c)(d) the result by using the method of Esch et al.(2013) before and after post-processing, re-spectively.
(a)
(b)
(c)
(d)