SPATIO-TEMPORAL ASSESSMENT OF ECOLOGICAL DISTURBANCE AND ITS
INTENSITY IN THE MANGROVE FOREST USING MODIS DERIVED DISTURBANCE
INDEX
Dibyendu Duttaa, *, Prabir Kumar Das a, Soubhik Paul a, Jaswant Raj Sharma b, Vinay Kumar Dhadwal b
a
Regional Remote Sensing Centre (NRSC), New Town, Kolkata, West Bengal
b National Remote Sensing Centre, Balanagar, Hyderabad
Commission VIII, WG VIII/1
KEY WORDS: Mangrove ecosystem, Sundarbans, Cyclones, Ecological disturbance, MODIS, MGDI
ABSTRACT:
The mangrove ecosystem of Sundarbans region plays an important ecological and socio-economical role in both India and Bangladesh. The ecological disturbance in the coastal mangrove forests are mainly attributed to the periodic cyclones caused by deep depression formed over the Bay of Bengal. In the present study, three of the major cyclones in the Sundarbans region were analyzed to establish the cause-and-effect relationship between cyclones and the resultant ecological disturbance. The Moderate Resolution Imaging Spectroradiometer (MODIS) time-series data was used to generate MODIS global disturbance index (MGDI) and its potential was explored to assess the instantaneous ecological disturbance caused by cyclones with varying landfall intensities and at different stages of mangrove phenology. The time-series MGDI was converted into the percentage change in MGDI using its multi-year mean for each pixel, and its response towards several cyclonic events was studied. The affected areas were identified by analyzing the Landsat-8 satellite data before and after the cyclone and the MGDI values of the affected areas were utilized to develop the threshold for delineation of the disturbed pixels. The selected threshold was applied on the time-series MGDI images to delineate the disturbed areas for each year individually to identify the frequently disturbed areas. The classified intensity map could able to detect the chronically affected areas, which can serve as a valuable input towards modelling the bio-migration of the invasive species and efficient forest management.
* Corresponding author. This is useful to know for communication with the appropriate person in cases with more than one author.
1. INTRODUCTION
The Sundarbans is one of the largest (10,200 sq km) tidal halophytic mangrove forests in the world lies on the vast delta of Bay of Bengal. The Sundarbans mangrove ecosystem play an important role by acting as bio-shield against storm surges by reducing the vulnerability to extreme climatic events like cyclones (Kathiresan and Bingham 2001, Alongi et al. 1992). Extensive and deep root system of mangrove helps protecting coastline from erosion and act as nutrient filter as well as nursery grounds for coastal fishes (Rahman and Asaduzzaman, 2010). The forest also provides livelihood to large number of population living in the fringe areas of the Sundarbans biosphere reserve. This inter-tidal mangrove forest have significant role in carbon sequestration due to anaerobic environment and acts as carbon sink. The forest is characterized with rich bio-diversity with 334 plant species, including 62 true mangrove species (Rashid et al., 2009).
The coastal mangrove forests are highly vulnerable to periodic cyclones during May-June and October-November caused by deep depression formed over the Bay of Bengal. About one tenth of the global tropical cyclone occurs in the Bay of Bengal (GOB, UNDP, World Bank, 1993) of which one sixth had landfall on the Sundarbans coast. Under climate change scenario the intensity and frequency of tropical cyclones have
considerably increased (Houghton et al., 2001; Solomon et al., 2007). Tropical cyclones at landfall cause extensive damage to mangrove species, wildlife habitat and human settlement adjoining the forest areas due to low and flat topography. During storm surge brackish water intrudes deep inside the forest through creeks making the land highly saline and unsuitable for agriculture as well as forest species. Salinity and tidal surges are considered to be the major determinants of the Sundarbans mangrove vegetation (Ellison et al., 2000). The frequent catastrophic disturbances may lead to limited recovery of mangrove vegetation due to non-availability of mangrove propagules (Rashid et al., 2009). Hence, the prolonged canopy gap in the open areas are occupied by invasive species which alters the existing physical environment and community of organisms at a particular site (Ameen, 1999, Biswas, 2003) causing cryptic ecological degradation. As the area is protected and inaccessible it is difficult to assess the loss of biodiversity and disturbance caused to the ecosystem by conventional means. Periodic and reliable estimation of disturbance to this fragile ecosystem is a must for better forest management and informed decision making. Satellite remote sensing helps in tracking changes in mangrove ecosystem and can assesses performance through changes in land use, primary productivity or phenology (Kerr and Ostrovsky, 2003). Earth Observation satellites like Terra / Aqua onboard MODIS is capable of synoptic viewing of inaccessible and protected areas for
monitoring earth surface processes with high temporal resolution. Mildrexler et al. (2009) proposed a new index called MODIS Global Disturbance Index (MGDI) for assessment of large scale ecological disturbance. The concept of MGDI is based upon the fact that surface temperature decreases with an increase in vegetation density through latent heat transfer (Nemani & Running, 1989). Besides, the two input variables viz. land surface temperature (LST) and enhanced vegetation index (EVI) respond to different biophysical processes, thereby enriching the information content of indices (Lambin and Ehrlich, 1996).
In the present study, the MGDI based approach was utilized to assess the instantaneous ecological disturbance caused by three major cyclones occurred in the last decade and a disturbance intensity map was generated for better management of mangrove ecosystem.
2. METHODOLOGY
2.1 Study Area
The present study was carried out over mangrove ecosystem of Sundarbans region (Figure 1) spread over two neighboring countries, viz. Bangladesh and India. The Sundarbans is a vast complex of intertidal delta and estuarine areas formed by the confluence of the Ganges, Brahmaputra, and Meghna rivers.
Figure 1. Study area with (a) country level boundaries of (i) India and (ii) Bangladesh; along with (b) Sundarbans region
(in grey colour).
This vast mangrove ecosystem along the marine, freshwater, and terrestrial interfaces provides critical ecosystem functions. The eco-region harbors several mammals, but the most important of which is Royal Bengal Tiger. The larger part (62%) or the eco-region is situated in the southwest corner of Bangladesh and the smaller western part (38%) lies in the state of West Bengal, India (Das and Siddiqi, 1985). Sundarbans formations with innumerable serpentine tidal creeks dissect the islands. Mean annual rainfall is 1700 mm (Ali, 1998) and varies from 1600 mm in the west to 2000 mm in the east (Chowdhury and Ahmed, 1994) and about 80% rainfall occurs during the monsoon i.e. June to October. Mean annual relative
humidity varies from 70 to 80% (Karim,1995). The average annual maximum and minimum temperatures vary between 30º and 21ºC. Cyclonic storm are very frequent in the monsoon and the wind velocity can reach up to 120 km/h (Iftekhar, 1999) causing immense disturbance to mangrove flora and fauna (Ali, 1998). Due to ingress of saline water caused by high tides turns the cultivable land saline and unfit for agriculture.
2.2 Satellite Data Used
2.2.1 Terra MODIS
The MODIS 250 m vegetation indices product (16 day composite) and 1 km Land Surface Temperature product (8 day composite) during 2001 to 2011 was downloaded from MODIS website and re-projected to Geographic (Lat/Long) projection. The Savitzky-Golay smoothing technique was adopted to eliminate the noise and data gap error from the time-series EVI data. The 8-day composite LST data was converted to 16-days time composite to make compatible with the corresponding 16-days MODIS EVI data.
2.2.2 Landsat
The Landsat-8 satellite images were downloaded from the GLOVIS website for the pre and post cyclone period. The imagery was used for identification of the affected areas caused by major cyclones as was evident on the satellite data.
2.3 Cyclone Data
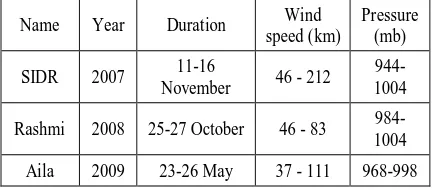
The data of the major super-cyclones was downloaded from IBTrACS (International Best Track Archive for Climate Stewardship). The details of the three major super-cyclones addressed in the present study are provided in Table 1. The trajectories of the cyclones over Bay of Bengal and main landmass are shown in Figure 2.
3. METHODOLOGY
3.1 Generation of MGDI Images
MODIS Global Disturbance Index (MGDI) is an approach towards detection of ecological disturbance using coupled vegetation index and land surface temperature (Mildrexler et al., 2009). In the present study, the impact of super-cyclones on the mangrove ecosystem was described using the instantaneous disturbance, as the disturbance is manifested immediately after the event, caused by the changes in LST and vegetation cover (Mildrexler et al., 2009).
Table 1. Major cyclones in Bay of Bengal during 2007-2009 with Description
Figure 2. Trajectories of three major cyclones
The time-series LST data (2001-11) was used to generate the year-wise maximum LST (LSTmax) for each pixel, and the corresponding date (fortnight) was recorded for computation of EVImax-post. The EVImax-post is the maximum EVI value that occurs after the annual maximum LST (LSTmax) during the same year for every pixel. The ratio of LSTmax to EVImax-post was computed for each pixel for computation of MGDIinst which is given by the following equation
.
MGDI inst= [(LSTmax/EVImax-post) current year (y)] /
[(LSTmax/EVImax-post) multi year mean (y-1)] (1)
Where, MGDIinst is the instantaneous MGDI value, LSTmax is the maximum 16-day composite LST (°C) in a year, EVImax-post is the maximum 16-day composite EVI following the LSTmax, current year (y) is the year being evaluated for disturbance and multi-year mean (y−1) is the mean of the ratios excluding the current year.
3.2 Determination of Threshold for Disturbance Detection
The time-series MGDI values were converted to the % change in MGDI (%MGDIchange) values, to normalize the data at spatio-temporal scale. The Percentage change in MGDI for the instantaneous disturbance was calculated using the following equation,
% change in MGDI current year (y) =
(MGDI current year / MGDI multi year mean) × 100 (2)
The landsat-8 images before and after the cyclones were compared to identify affected areas on the ground. Around fifty spatially distributed homogeneous clusters of affected pixels were selected across the affected region and the mean value of %MGDIchange for each cluster was computed. The inter-cluster mean value plus one standard deviation of the %MGDIchange was considered to be the threshold, and the value was used for discrimination of the disturbed pixels. The justification for
considering one standard deviation was to address the inter- and intra-cluster variability in %MGDIchange values. The %MGDIchange above 11% of the temporal mean was considered as the disturbance threshold for discrimination of the disturbed areas caused by cyclones from the non-disturbed areas. The thresholds were applied on the ‘% change instantaneous MGDI’ images to delineate the disturbed areas pertaining to each cyclone.
4. RESULTS AND DISCUSSION
4.1 Ecological Disturbance caused by Cyclones
The % change in MGDI (%MGDIchange) for each pixel was analyzed from temporal mean MGDI value. It was observed that the %MGDIchange were around 0 to 10% of the mean MGDI value in major part of the Sundarbans region after cyclone ‘SIDR’, with some pockets with higher values (>15%) indicating highly disturbed areas (Figure 3a).
Figure 3. The percentage change of MGDI values caused by cyclones (a) SIDR, (b) Rashmi and (c) Aila over Sundarbans
region.
The concept of MGDI is based on the fact that the extreme events or ecological disturbance will lead to an increased surface temperature and reduced vegetation vigour. In Sundarbans region, the maximum temperature is generally
achieved during the month of May, hence the EVImax-post would be the maximum EVI value after May. The mangrove showed high EVI values (generally > 0.7) prior to the cyclone ‘SIDR’ as the peak vegetative growth is achieved during December-January. The MGDI could not capture the post-cyclone ecological disturbance during as the EVImax-post value was prior to cyclone.
In major parts of the study area, the %MGDIchange was negligible after the cyclone ‘Rashmi’, but in eastern part of the Bangladesh Sundarbans very high %MGDIchange (>15%) were observed (Figure 3b). The increase in MGDI may be attributed to the increase in maximum LST and decrease in EVImax-post in 2008 following the ‘SIDR’ super-cyclone in the previous year temperature. Hence, it is expected that the %MGDIchange values of 2008 represented the combined impact of the ‘SIDR’ (November, 2007) and ‘Rashmi’ (October, 2008).
The impact of the super-cyclone ‘Aila’ on the mangrove ecosystem was clearly evident by the increased values of MGDI, distributed across the whole Sundarbans region. The %MGDIchange values varied between 0 and 20%, based upon the severity of the damage caused to the ecosystem (Figure 3c). Unlike ‘SIDR’ and ‘Rashmi’, the ‘Aila’ occurred during the mid of the year coinciding with the highest surface temperature whereas peak vegetation vigour was achieved in the post-cyclonic period only, hence the MGDI during 2009 could successfully capture the disturbance regime of the Sundarbans ecology caused by the super-cyclone ‘Aila’.
4.2 Generation of Disturbance Intensity Map
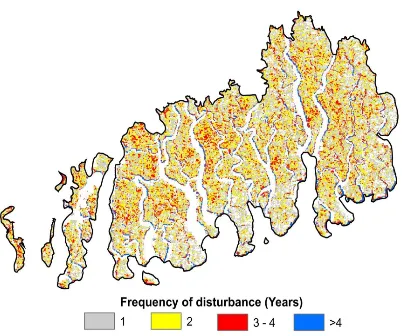
The threshold value for labelling a pixel disturbed was decided interactively based on the footprint of the cyclone on Landsat-8 imagery of post cyclone period as was mentioned earlier. The threshold was applied on the %MGDIchange images and the disturbed areas were extracted. The disturbed area images of each year were integrated and a accumulative disturbance intensity maps was generated (Figure 7) for the region.
Figure 4. Disturbance intensity map derived from MGDI
It was interesting to notice that almost all the pixels in Sundarban mangrove ecosystem encountered at least one disturbance frequency during the entire study period (2001-2011). Whereas in major part of the ecosystem the disturbance intensity was more than two or three. The pixels with more than four disturbance intensity are generally located along the coast.
The disturbance intensity map can be utilized by the forest planners for better management of the mangrove ecosystem and modelling the invasion risk.
CONCLUSIONS
The present research was aimed to study the impact of cyclone of varying intensity and occurring at different time of phonological cycle of mangrove forest in Sundarbans region. Coupled LST and EVI based MODIS Global Disturbance Index was adopted for assessment of the ecological disturbance in the mangrove ecosystem caused by three major cyclones developed over Bay of Bengal during last decade. The instantaneous MGDI calculated based upon the annual maximum LST and the EVImax-post,was unable to detect the disturbance caused by
‘SIDR’, as the vegetation achieved a high vigour before the cyclonic event itself. But the combined impact of ‘SIDR’ and
‘Rashmi’ on mangrove ecosystem was successfully captured by the subsequent year’s (2008) MGDI images. The disturbance caused by super-cyclone ‘Aila’ was efficiently captured by MGDI approach. Temporal integration of disturbed images of individual years generated after every catastrophic event could able to identifying the areas chronically affected leading to possible biological invasion. This will help forest management to plant mangroves in canopy gap areas in absence of natural regeneration through propagules during off seeding months.
ACKNOWLEDGEMENTS Management of Ganges Flood Plains and Sundarbans Ecosystem. Khulna University, Khulna, Bangladesh, 16–18 July, 1994, p. 38–49.
Alongi, D.M., Boto, K.G., Robertson, A.I., 1992. In Tropical Mangrove Ecosystem (eds Alongi DM. and Robertson AI.), American Geophysical Union, Washington DC, p. 251- 292.
Ameen, M., 1999. Development of guiding principles for the prevention of impacts of alien species. Paper presented at a consultative workshop in advance of the 4th meeting of SBSTTA to the CBD organized by IUCN Bangladesh at Dhaka on May 25, 1999.
Anonymous., 2008. Field Investigation on the Impact of Cyclone SIDR in the Coastal Region of Bangladesh, Bangladesh University of Engineering and Technology (BUET), Dhaka, Bangladesh.
Biswas, S.R., 2003. Invasive plants of Sundarbans. In: Interim report under SBCP project, IUCN Bangladesh, 34 p.
Chowdhury, R.A., Ahmed, I., 1994. History of forest management. In: Hussaun, Z., Acharya, G. (Eds.), Mangroves of the Sundarbans, vol. 2. Bangladesh IUCN, Bangkok, Thailand.
GOB, UNDP, World Bank., 1993. Multipurpose cyclone Shelter Programme. Executive Summary of Final Report.
Houghton, J., Ding, Y., Griggs, D., Noguer, M., van der Linden, P., Dai, X., Maskell, K., Johnson, C., (Eds.) 2001. Climate Change 2001: The Scientific Basis (Published for the Intergovernmental Panel on Climate Change). Cambridge University Press, Cambridge, United Kingdom, and New York, NY, USA.
Iftekhar, M.S., 1999. Vegetation dynamics in the Sundarbans and the contribution of salinity between 1985–1995. B.Sc. Thesis. Forestry and Wood Technology Discipline, Khulna University, Khulna, Bangladesh. 54 pp.
Karim, A., 1995. Report on mangrove silviculture, vol. 1, Integrated resources development of the Sundarbans. FAO/UNDP project, BGD/84/056.
Kathiresan, K., Bingham, B.L., 2001. Biology of mangroves and mangrove ecosystem. Advances in Marine Biology, 40, pp. 81-251.
Kerr, J.T., Ostrovsky, M., 2003. From space to species: ecological applications of remote sensing. Trends in Ecology
and Evolution, 18(6), pp. 299-305.
Lambin, E.F., Ehrlich, D., 1996. The surface temperature– vegetation index space for land cover and land-cover change analysis. International Journal of Remote Sensing, 17, pp. 463−487.
Mildrexler, D.J., Zhao, M., Running, S.W., 2009. Testing a MODIS Global Disturbance Index across North America.
Remote Sensing of Environment, 113, pp. 2103-2117.
Nemani, R.R., Running, S.W., 1989. Estimation of regional surface resistance to evapotranspiration from NDVI and Thermal-IR AVHRR data. Journal of Applied Meteorology, 28, pp. 276−284.
Rahman MR, Asaduzzaman M., 2010. Ecology of Sundarban, Bangladesh, J. Sci. Foundation 8(1&2): 35-47, June-December 2010.
Sheikh HR, Shekhar RB, Reinhard B, Michael K., 2009. Mangrove community recovery potential after catastrophic disturbances in Bangladesh. Forest Ecology and Management, 257, pp. 923–930.
Solomon S, Qin D, Manning M, Alley RB, Berntsen T, Bindoff NL, Chen Z, Chidthaisong A, Gregory JM, Hegerl GC, Heimann M, Hewitson B, Hoskins BJ, Joos F, Jouzel J, Kattsov V, Lohmann U, Matsuno T, Molina M, Nicholls N, Overpeck J, Raga G, Ramaswamy V, Ren J, Rusticucci M, Somerville R, Stocker TF, Whetton P, Wood RA, Wratt D.
2007. Technical summary. In: Solomon S, Qin D, Manning M, Chen Z, Marquis M, Averyt B, Tignor M, Miller HL., (Eds.) Climate Change 2007, The Physical Science Basis. Contribution of Working Group I to the Fourth Assessment Report of the Intergovernmental Panel on Climate Change. Cambridge University Press, Cambridge, United Kingdom and New York, NY, USA.