N
STUDY AREA Plateau State
STUDY OF LANDCOVER CHANGE IN YELWA-HEIPANG AREA OF PLATEAU
STATE, NORTH-CENTRAL NIGERIA: A GEOINFORMATICS APPROACH
*Ogunmola J.K, Gajere E.N, Jeb D.N, and Agene I.J
National Centre for Remote Sensing, Jos, Nigeria, email: [email protected]
KEYWORDS: Nigeriasat-X, Land Use, Land Cover, Landsat, Processing
ABSTRACT:
This study is a research programme carried out to detect the change in land use/land cover of Yelwa-Heipang area of Plateau State, North Central Nigeria. It lies within the South-Eastern part of the Jos-Plateau. It is about 40km South of Jos city. It is located between latitude 9˚35'16.65"N, longitude 8˚52'29.91"E and Latitude 9˚38'38.92"N, longitude 8˚57'03.87"E (Naraguta topomap, sheet 168S.E). Two sets of Landsat images of 1975, 1986 and NigeriaSat-X image of 2012 were subjected to various image processing techniques and a supervised classification was carried out on the various images using ILWIS (Integrated land and water information system) software. The classification scheme used are bare-surface, built-up, farmland and vegetation. A follow up field work was carried out to confirm the results of the classification. The results were subjected to various statistical analyses and it shows natural vegetated area coverage increased from 5.80sqkm in 1975 to 18.47sqkm in 1986 and later reduced to 16.85sqkm in 2012. Non-vegetated area which comprised built-up area, farmlands and bare surface, decreased from 42.2sqkm in 1975 to 33.82sqkm in 1986, then to 35.86sqkm in 2012.The rate of change of natural vegetation between 1975 and 1986 was 1.152sqkm per annum, while that of 1986 and 2012 was 0.108sqkm per annum. Loss of naturally vegetated area in Yelwa-Heipang Barkin-Ladi is mainly as a result of urban growth and expansion, farming and gully erosion. Another important issue in the study area is the problem of soil erosion. In the past mining activity had led to accelerated gully erosion which has stripped substantial areas of lands of their vegetations. This has led to the formation of bare surface. Land cover of the study area during the period between 1975 and 2012 changed from a forested area to other land uses as a result of increase in population, demand for land for agricultural purposes and increase in the demand for firewood.
1.0 INTRODUCTION
The study area lies within the South-Eastern part of the Jos- Plateau. It is about 40km South of Jos city. It is located between latitude 9˚35'16.65"N, longitude 8˚52'29.91"E and Latitude 9˚38'38.92"N, longitude 8˚57'03.87"E (Naraguta topomap, sheet 168S.E). The terrain of the study area is dominated by presence of Younger Granites and Basement Complex rocks which are known to be of igneous origin (Ajetunmobi, 1996). Also found in patches are the Quaternary deposits of volcanic rocks (mostly basalts). Biotite-granite constitutes one of the major soil parent rocks on the Jos-
Plateau. Soils derived from these materials are not intensively cultivated as those developed on some other parent rocks like basalts, alluvium unconsolidated quaternary deposits and granite-gneiss on the Jos-Plateau. Generally, the soils are acidic (PH values mostly< 5.5) and lateritic. The predominant land uses in Heipang-Yelwa are agricultural and residential. Their houses are mostly made up of traditional mud houses and modern building with most of the modern house being in Heipang town. Their agricultural products are mostly potatoes, vegetables and cereals. The area falls within the northern Guinea Savannah vegetation zone which is an open woodland with tall grasses but the native vegetation has been considerably altered by human activities. The vegetation of Yelwa-Heipang-Barkin-Ladi area consists mostly of trees and scattered grasses except where thick hedges of cactus have been planted around household farms or compound. The use to which we put land could be grazing, agriculture, urban development, logging and mining among many others. Hence, in order to use land optimally, it is not only necessary to have the information on existing land use and land cover, but also the capability to monitor the dynamics of land use resulting from changing demands of increasing population and forces of nature acting to shape the landscape. Change detection is the process of identifying differences in the state of an object or phenomenon by observing it at different times. Land cover change detection using satellite imageries with different statistical techniques have been applied to both rural and urban areas and have been found to be an efficient method of discovering the development trends of a region.
1.2 BACKGROUND
Remote sensing plays an important role for spatial data
acquisition from economical perspective (Alesheikh, et al., 2003). Changes in natural vegetation particularly around urban areas are always due to human influences. The intensity of such changes increases with population size and in most recent time,
human manipulation of the earth’s surface has become very
strong. Humans make use of the land they inhabit to a degree unmatched by other species (Encarta, 2004). The human imprint is most marked in the temperate and tropical zones, but even the remote deserts, high mountains and Polar Regions bear evidence of the works of man, in large urban and industrial centers and major transport networks, the alteration of the landscape is most evident. Rapid environmental growth has resulted in many environmental problems which has escalated deforestation and loss of vegetation in urban fringes (Harrison, 1993). As population increases, more land is cleared for farming, building of houses and road construction, less is left to forest or fallow. Rapid population growth has forced people to build and farm on marginal lands which have increased erosion processes. This has also resulted in the loss of forestlands and land resources (Gutti et al, 2012). Developing countries in particular are often faced with a dilemma. Their need for money and resources to satisfy the growing populace leads to loss of their forest and modifies their savannah to obtain timber, rubber and other cash crops for export. (Encarta, 2004). Advances in transport and food preservation have allowed cities to expand further. Cities in recent times have gone on growing faster than the population as a whole. Cities and suburbs sprawl in all directions. In Nigeria, urban areas represent less than 10% of the total land area of the country, yet accommodate 28% of the total population. The urban growth rate is 3-5 times greater than the rural growth rate (Taylor, 1988). According to Harrison (1993), population growth has out paced adequate housing, livelihood, roads, transport, water, sanitation, waste disposal and health services. These have forced people to settle on urban fringes thereby clearing forests for building and construction works.
Rapid population growth, has remained the principal factor that has triggered and continued to stimulate downward spiral in environmental resources degradation. The heavy dependency on wood for fuel and building materials has combined with rapid population growth to contribute to accelerating loss in urban fringes. This is particularly severe around major urban centers. The urban fringe is an area under constant pressure for change. At the urban fringe, complex areas of land cover change are often found including transformations from rural land uses to residential, commercial, industrial and residential uses among others (Quamby , 1987). These changes can be monitored using remotely sensed data either by photo interpretation of pairs or by digital analysis of imagery using change detection technique. On the whole, the major causes of changes in natural vegetation in urban fringes are rapid population growth, urbanization and agriculture, among others. Remote sensing could be defined as
the sensing of the earth’s surface from space by making use of
the properties of electromagnetic wave emitted by the sensed objects, for the purpose of collecting data that can be utilized in improving natural resource management, land use and protection of the environment. Remote sensing has proved to be a powerful
“tool” for assessing the identity, characteristics, and growth
potential of most kinds of vegetative matter at several levels (from biome to individual plants). Vegetation behavior depends on the nature of the vegetation itself, its interaction with solar radiation and other climatic factors, and the availability of chemical nutrients and water within the host medium (usually soil, or water in marine environments). Many remote sensing devices operates in the green, red and near infrared regions of the electron magnetic spectrum. They can discriminate radiation absorption and reflectance properties of vegetation. Every parcel
of land on the earth’s surface is unique in the cover it possesses.
Change detection is an important process in monitoring and managing natural resources and urban development because it provides quantitative analysis of the spatial distribution of the population of interest.
The basis of using remote sensing data for change detection is that changes in land cover result in changes in radiance values which can be remotely sensed. Techniques to perform change detection with satellite imagery have become numerous as a result of increasing versatility in manipulating digital data and increasing computer power. In some instances, land use and land cover change may result in environmental, social and economic impacts of greater damage than benefit to the area (Oguntoyibo, et al 1953). Therefore, data on land use change are of great importance to planners in monitoring the consequences of land use change in an area. Such data are of value to resources management and agencies that plan and assess land use pattern and in modeling and predicting future changes. This normally involves the use of sequential satellite imageries over a specific region and the land cover map for each data developed and compared. Direct observations in the field have traditionally provided most land use/land cover information. However, the introduction of satellite remote sensing techniques, gives opportunities of processing and comparing very large quantities of data. Earth observation satellites provides the capability to monitor the dynamics of the Earth surface and to quantify the changes that take place thus providing the basis for understanding the temporal trends and their significance. Examples of earth observation satellites are the NOAA, launched by USA, METOR launched by Russia, ERS launched by European, SPOT launched by France, IRS launched by India, Landsat launched by USA and Nigerisat-1 of Nigeria, among others. These earth observation satellites are grouped according to the functions they perform. The weather satellites are NOAA and METOR. The land observation satellites are, landsat, Spot, NigeriaSat-1,NigerSat-X and ERS. The marine observation satellites are MOS i.e. (Marine observation Satellite) and SEAWIFS (sea-viewing wide-field of view sensor).
method of obtaining the required data on a cost and time-effect basis. In an effort to monitor major fluctuations in vegetation and understand how they affect the environment, about 20 years ago earth scientist began using satellite remote sensors to measure and map the density of green vegetation over the earth. Using
NOAA’s, advanced very High Resolution Radiometer
(AVHRR), scientists have been collecting images of our planet’s surface. By carefully measuring the wavelengths and intensity of visible and near-infrared light reflected by the land surface backup into space, scientists use an algorithm called a
“vegetation Index” to quantify the concentrations of green leaf
vegetation around the globe. Then by combining the daily vegetation indices into 8-,16-or 30-day composites, scientists
create detailed maps of the earth’s green vegetation density that
identify where plants are thriving and where they are under stress (i.e due to lack of water).
2.0 METHODOLOGY
Data were gotten from two (2) different sources-primary and secondary sources. Since this study involves change detection, hence it is a form of temporal study that requires the use of imageries taken at different times. The primary sources include three sets of satellite imagery for Barkin-Ladi-Heipang for 1975, 1986 and 2012. The imageries of 1975 and 1986 are the American Landsat series MSS and TM, while the 2012 image is NigeriaSat-X image. All the satellite imageries were gotten from the National Centre for Remote Sensing, Jos-plateau state. Secondary sources used in this project include Topomap of Naraguta S.E sheet 168 (1st edition). The map was published by the Federal surveys, Nigeria in 1958, it has a scale of 1;50,000. This was obtained from the department of Geography and planning, university of Jos map bank.
The objective of image classification and mapping, is to use a decision-rule to generalize or group objects (pixels) according to a list of classes by examining their attributes and their spectral response patterns. In the development of land cover classes, the available materials and particular characteristics of the study area were taken into consideration. Changes in forest cover were associated with the conversion of forestland into other uses such as urban land uses.
A classification scheme was adopted to provide a basis for proper
assessment; They are 1. Bare surface
2. Built-up
3. Farmland 4. Vegetation
The raw images were subjected to various image processing techniques .Firstly, a colour composite image of the study area was produced by combining three raster images of different bands .This permanent colour composite is more convenient to resolve with the eye. Vegetation appears as red and rocks appear dark grey. Water surfaces appear blue. Topographic map of the area was also overlain on the colour composite image to enhance topographic features. The image was also passed through the edges enhancement filter which made the image sharper. A
supervised classification was then performed which was based on the researchers acquired knowledge of the
study area and the surface cover types present on the image.
3.0 DATA PRESENTATION AND ANALYSIS
3.1 Analysis of land use/land cover of study area in 1975
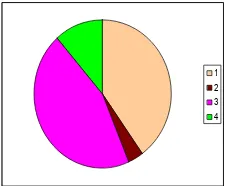
Sample Set Area (km2)
Bare surface 20.06
built-up 1.93
farmland 23.21
vegetation 5.80
Total 51.0
Figure. 2a-Landsat MSS imagery of study area for 1975
Figure 2b-Land use/Land cover map of study area derived from Landsat MSS imagery for 1975
Table 1-Area covered by the various classes in 1975
1 2 3 4
Figure 3. Pie charts of the various classes in 1975:
3.2 Analysis of land use/land cover of study area in 1986
3.3 Analysis of land use/land cover of study area in 2012
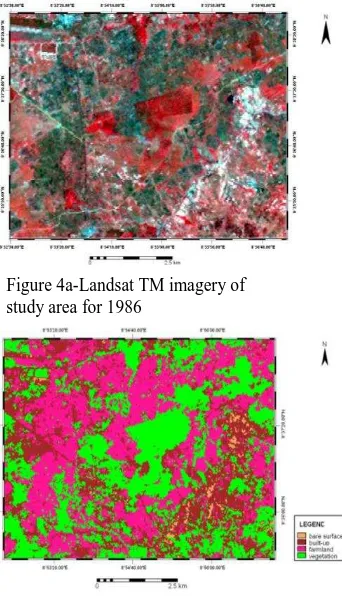
Sample Set Area (km2)
Bare surface 1.7
Built-up 15.7
Farmland 17.16
Vegetation 16.85
Total 51.0
Sample Set Area (km2)
Bare surface 1.7
Built-up 15.7
Farmland 17.16
Vegetation 16.85
Total 51.0
Figure 4a-Landsat TM imagery of study area for 1986
Figure 3b- Land use/Land cover map of study area for 1986
Table 2-Area covered by the various classes in 1986
Figure 6a-Nigeriasat-X imagery of study area for2012
Figure 6b- Land use/Land cover map of study area for 2012
Table 3-Area covered by the various classes in 2012
1 2 3 4
Figure 5. Pie charts of the various classes in
1986: 1-bare surface, 2-built-up, 3-farmland,
4-vegetation
1 2 3 4
Figure 7. Pie charts of the various classes in
2012:1-bare surface, 2-built-up, 3-farmland,
4-vegetation
4.0 DISCUSSION
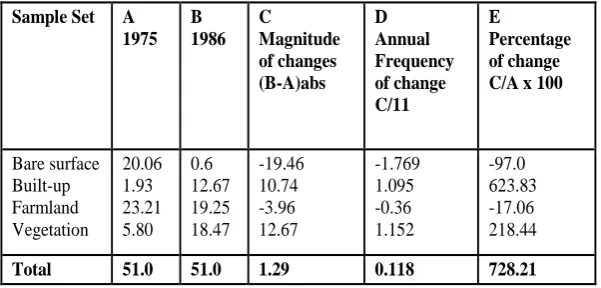
From table 1 it can be seen that for the year 1975, most parts of the study are were bare surfaces. Table 4 shows that while naturally vegetated area accounted for 11.3% of the total land area (a 51.0sqkm land area), non-vegetated accounted for the remaining 88.6% with built-up area took 3.8% farmland area (45.5%, and bare surfaces took up to 3.22% of the total land area which is 52.71%. The magnitude of change (table 5) for 1975-multiplying the result by 100. The same is done for the periods 1986 to 2012 where 1986 is the reference year . Annual frequency of change is gotten by dividing the magnitude of change of each Land cover category by the number of years between the period i.e 11 years for 1975-1986 and 26 years for 1986-2012.The results of the analysis unveil a tremendous change in the Land cover of the study area during the 37 years period from 1975-2012. It can be noticed that the percentage change in the proportions of some Land cover sample sets increased while others decreased. For the convenience of interpretation, the total Land cover samples sets are divided into naturally vegetated and non-vegetated areas and bare surfaces.
Table 4. shows that the naturally vegetated area covered a land area of 5.80sqkm of the total land area under study which is 51.0 in 1975. In 1986, it increased to 18.47sqkm, a 12.67% increase of forestland due to afforestation. It decreased to 16.85sqkm in 2012 which represents a 1.625sqkm loss of forestland. This decrease is attributed to increase in population, demand of land for farming, firewood demand and commercial purposes. Many houses were built and the process of road construction also led to the clearing of forestlands. The demand for food to feed the teeming population also necessitated the clearing of forestlands being converted to agricultural lands for the purpose of food production. The magnitude of change of naturally vegetated area between 1975 and 1986 was 12.67sqkm, representing a change of 218.44%, hence, annual frequency of change stood at 1.152sqkm per year. This annual frequency of change means that 1.152sqkm of land was forested annually for 11 years (1975-1986). Therefore, this period showed a total increase in naturally vegetated area of 12.67sqkm for the period. Furthermore, the period 1986-2012 showed a slight decrease in naturally vegetated area
from 18.47 to 16.85, a 1.62sqkm loss of forestland (see tables 4 and 5). Percentage of change during the period was 8.77% and annual frequency of change was -0.108sqkm. This means that 0.108sqkm of forestland was cleared annually for 26 years. Urban expansion into the area resulted in a 1.62sqkm loss of forestland during the period from 1986-2012.
Another important issue in the study area is the problem of soil erosion. In the past mining activity had led to accelerated gulleing which has stripped substantial areas of lands of their vegetations and led to the formation of bare surfaces. The total non-vegetated area in 1975 was 45.2sqkm of the 51.0sqkm study area. In 1986 it decreased to 33.82sqkm, a 11.38sqkm decrease. In 2012, the non-vegetation area again increased to 35.86sqkm, a 2.04sqkm increase from 1986 (see tables 4 and 6). For the period under study, non-vegetated area showed an increase in coverage. The magnitude of change between 1975 and 1986 was -11.38, percentage of change was 509.77% and annual frequency of change was -1.034sqkm per year. This means that -1.034 of forestland was converted annually to other uses. This period (1975-1986) registered an increase in the non-vegetated area. The period 1986-2012 showed that the non vegetated
area’s magnitude of change was 2.04sqkm, percentage of
change stood at about 194% and annual frequency of change was 0.136sqkm per year (table 6). This signifies that 0.136sqkm of natural vegetation was converted to non vegetation area annually for 26 years (1985-2012).
5.0 CONCLUSION
This study was carried out with the aid of Landsat false colour composite satelite imageries taken in 1975 and 1986 and NigeriaSat-X of 2012. There was also ground truthing during which field observations and measurements were done. The following observations were made:
i. Natural vegetated area coverage increased from 5.80sqkm in 1975 to 18.47sqkm in 1986 and later reduced to 16.85sqkm in 2012.
ii. Non-vegetated area which comprised built-up area, farmlands and bare surface, decreased from 42.2sqkm in 1975 to 33.82sqkm in 1986, then to 35.86sqkm in 2012.
iii. The rate of change of natural vegetation between 1975 and 1986 was 1.152sqkm per annum, while that of 1986 and 2012 was 0.108sqkm per annum.
From the above observations, the following conclusions were arrived at:
i. Loss of naturally vegetated area in Yelwa-Heipang Barkin-Ladi is mainly as a result of urban growth and expansion, farming and gully erosion;
areas of lands of their vegetations. This has led to the formation of bare surfaces; iii. Land cover of the study area during the
period between 1975 and 2012 changed from a forested area to other land uses as a result of increase in population, demand for land for agricultural purposes and increase in the demand for firewood.
ACKNOWLEDGMENTS
This study has benefited from the facilities provided by the National Centre for Remote Sensing, Jos, Nigeria.
REFERENCES
Ajetumubi, M.M., 1996. The relationship between Lithology and Drainage dissection in the Jos-Bukuru Area of the Jos-Plateau. Unpublished Dissertation. Geography and Planning, University of Jos.
Alesheikh, A.A., Sadeghi Naeeni F., and Talebzade A., 2003.Improving classification accuracy using external knowledge, GIM International, 17 (8), 12-15.
Gutti, B., Aji, M.M and Magaji,G., 2012. Environmental Impact of Natural Resources Exploitation in Nigeria and the Way Forward. Journal of Applied Technology in Environmental Sanitation, 2 (2): 95-102.
Harrisons, P., 1993. The Third World Revolution: Population Environment and a sustainable world. Penguin group, London:
Oguntoyibo, J.S., Areola, O.O., and Filani, M.O., 1953. A geography of Nigerian Development Heinemann Educational Books (Ltd) pp. 119-125.
Quamby, N.A., 1987. Monitoring urban Land cover at the urban fringes from SPOT HRV imagery in the South East. England. International Journal of Remote Sensing Vol. 10 No.6 pp. 953-963.
Taylor. R.W., 1998. Urban Development Policies in Nigeria Planning, Hosing and Land Policy