TARGETED SATELLITE IMAGE CLASSIFICATION FOR URBAN MAP UPDATING
USING GEOSPATIAL INFORMATION SYSTEM PLATFORM
M. Davoodianidaliki a, *, A. Abedini a
a*
Dept. of Geomatics Engineering, Faculty of engineering, University of Tehran
N. Kargar St. Jalale al e Ahmad St., Tehran: 14395515, Iran - (mdavoodian, aabedini)@ut.ac.ir
Commission VI, WG VI/4
KEY WORDS: Change Detection, Updating, Urban Maps, High Resolution, Satellite Image, Image Processing, SVM, Targeted
Classification
ABSTRACT:
Traditional map production and updating methods which usually involve field surveying and/or photogrammetry, while established and used for a long time, are time consuming and costly. Whereas satellite imagery have provided great amounts of data with high resolutions suitable for different geospatial applications. This paper focuses on taking advantage of geospatial information systems for enabling automated supervised classification of satellite images in urban areas. Such ability is provided through some attributes that determine whether features in current map have changed or not. The overall process consists of three stages: i: Geo database upgrade for addition of some attributes; ii: Classification by Support Vector Machine (SVM) and iii: Change analysis. The proposed method is applied on a sample data of Worldview 3 image of Hormozgan, Iran. The obtained results show that using such method not only can automate supervised classification but also can decrease misclassification errors through local training. Also its independent of classification method provides the ability to deploy other classification methods.
* Corresponding author.
1. INTRODUCTION
Map is a visual representation of space and symbolic depiction highlighting relationship between its elements (“Map,” 2014). With a long tradition, geographic maps have their own importance in a variety of fields and contemporary urban maps are usually integrated into Geospatial Information Systems (GIS). There are different elements such as scale, accuracy, precision, orientation, projection and etc. as integral part of geographic maps, but among them time is an essential factor in management fields. Many applications of maps in urban areas involve management purposes and a prerequisite of management is being up to date data.
In recent decades, satellite imagery has provided high resolution data of vast areas with fewer prices and the process of map production and updating using high resolution satellite imagery is getting more popular during recent years.
Change is part of nature that happens with time and human behaviour accelerates these changes over time, with its manifestation more obvious in urban areas. A requirement to manage and deal with these changes is up to date data and information. And among different types of data required for this purpose, spatial data which leads to spatial analysis plays an essential role in making the process more efficient. Spatial data is usually represented (and visualized) as geographic maps. And map updating is the process of analyzing different types of data and integrating them into available maps.
Given the fact that Geospatial Information Systems are already deployed noticeably, this paper proposes a method to update urban maps in a GIS platform using high resolution satellite
imagery. And especially focuses on how adding some features into GIS platform can make image processing more purposeful. This method follows the doctrine that some areas in a city usually do not change and sometimes should not change in short term such as historical sites whereas other areas are in the process of reforming such as old-town areas. Regarding to this point, ESRI news website states that: “the key to efficient map updating is changing only those elements that need to be changed” (Traurig, 2011). Actually integration of satellite images in GIS has nearly three decades history (Ehlers et al., 1989; Mesev, 2008; Star et al., 1997).
To update a map, changes should be determined. But an urban area is a set of various objects that make up the city such as buildings, roads and etc. Simply put it, these objects should be extracted and compared with current available objects on map to determine whether there has been any significant changes on it or not.
Urban feature extraction methods can be categorized by the type of data used such as: satellite images, aerial images, Active data, Digital Terrain Models (DTM), or hybrid data. On the other hand, different core algorithms can be used based on application such as morphology operators (Acar and Bayram, 2009; Lefevre et al., 2007), classifications (supervised or unsupervised) (Blaschke and Strobl, 2001), edge extraction (Wei et al., 2004), swarm intelligence, machine learning (Ziaei et al., 2013), fuzzy or a hybrid method (SAN, 2009).
The proposed method includes three phases of: GIS platform upgrade, Targeted image classification (which is an automated supervised classification) and change analysis. The following
section provides the flowchart of proposed method and gives some explanation for each step. In the third section, algorithm is applied to a piece of data and results are provided. Then advantages and shortcomings of algorithm are discussed based on results. Finally a conclusion is provided.
2. METHODOLOGY
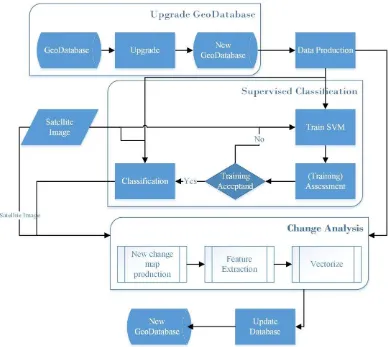
Proposed method requires three main steps: geo-database upgrade, supervised classification and change analysis. Each stage consists a few steps which are summarized as a flowchart in Figure 1 and explained in following paragraphs.
Figure 1. Flowchart of proposed method with three main stages of: Upgrading geo-database, Classification and change analysis.
2.1 Data Base Upgrade
The first step is upgrading GIS platform to provide it with the ability to produce training data for next phase of image classification. This upgrade is only to make sure that each feature has some required attributes; and if required, add new ones. These are attributes that should play two main roles. The first is to help to determine the possibility of a change for each feature based on them. For example, Historical data can especially help to determine which areas are suitable for training purpose and later which areas are likely to have changed in change analysis. The other roles is attributes that determine each feature belongs to which class.
Usually buildings which are made recently won’t be reconstructed for a while which can be determined by age attribute. Also buildings which are being build or reconstructed at the time of image acquisition can’t be determined. So building start and finish date can be useful as well. Table 2 presents some of the main attributes which are required in
database. These are beside the required or common fields such as Id, geometry, coordinates and etc.
Age (time) Build Date Finish Date
Type Class code Material code Parent Id Preserved (Bool) Change Type Id
Table 2. Some of required fields for database.
But all these attributes are required to enable database to provide a training data for next step. Also a piece of image should be exported as well. Figure 3 presents a pseudo-code for this process.
2.2 Classification
In this step, provided data from GIS platform together with satellite images undergo a supervised image classification. Even though most learning algorithms can be applied, this paper uses Support Vector Machine (SVM) algorithm as the core of this
step. Even though SVM is originally a binary linear classifier, in the last two decades, it has been modified to a non-linear classifier (Mather and Tso, 2003).
Different descriptors of color, texture and statistics beside the original image bands (red, green, Blue and infrared) used in this classification which are listed in Table 4. Change probability
CLASSNUMBER = 10 # Number of classes
# trainingClasses = {1: ‘Green’, …, 10: ‘single_features’} # name and code of each class. # ClassTrainingConstant = [1, …, 1] array of all class constants.
staticBlocks = allBlocks.changeChanceValue < changeThreshold overAllArea = allBlocks.area();
for class_code in trainingClasses:
thisClassBlocks = staticBlocks.classCode == class_code # Compute training ratio
thisClassArea = thisClassBlocks.area(); # Compute overall area of this class. [xLimit, yLimit] = thisClassBlocks.boundary()
trainingRate = (thisClassArea/overAllArea) * thisClassTrainingConstant trainingCoords = randCoords([xLimit, yLimit], trainingRate)
trainingFeatures = thisClassBlocks.contain(trainingCoords) # Now choose some pieces of this feature.
selectedCoordinates = [] for feature in trainingFeatures:
selectedCoordinates.append(feature.selectForTraining()) # Differ per class
selectedCoordinates.export2ROI(cityName + zone + str(class_code)) # export ROI file (Region of Interest). Figure 3. Pseudo code for exporting training data from data-base.
1. Average (panchromatic image). 2. Canny magnitude (Canny, 1986).
3. Laplacian operator (two dimensional) (Torre and Poggio, 1986).
4. Sharped image (by unsharp masking)
5. Shadow (Saturation to intensity ratio in HSV color system).
6. Average of co-occurrence matrix (“Co-occurrence matrix,” n.d.).
7. Entropy (O’Brien, n.d.).
8. Morphological Erosion: sometimes morphological operations can simplify image for specific applications (Acar and Bayram, 2009).
9. Neighbourhood (9 features).
Table 4. A list of main features used in classification.
2.3 Change Analysis
The last phase is change analysis in which based on change probability map, initial data and classification results; an updated map should be acquired. This phase consists of a few steps. The first step is to create a new change probability map. Then this change map together with classification results are used to extract the suitable features from image. Finally extracted features are vectorized. But it’s noteworthy that main focus of this paper is so far as to extract the new or updated feature whereas vectorization despite being manual is just to achieve a final result.
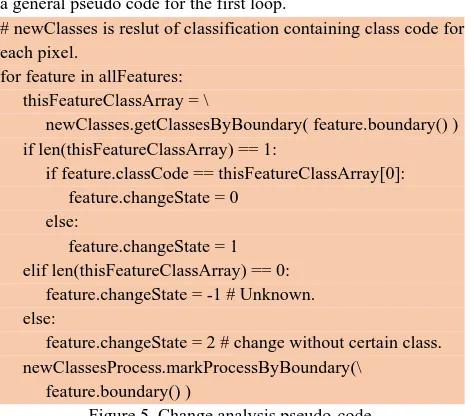
There are two main loops in change analysis. The first one loops through all current features in area and gets its corresponding class in classified results to check whether it has changed or not. The other one loops thorough all features in classified results which have not been processed in previous loop and adds them as possible new features. Figure 5 displays a general pseudo code for the first loop.
# newClasses is reslut of classification containing class code for each pixel.
for feature in allFeatures: thisFeatureClassArray = \
newClasses.getClassesByBoundary( feature.boundary() ) if len(thisFeatureClassArray) == 1: newClassesProcess.markProcessByBoundary(\
feature.boundary() )
Figure 5. Change analysis pseudo-code.
3. EXPERIMENTS
After explaining theoretical base of proposed methodology, in this section, a sample data is selected and above method is
applied. This sample data is a 4-band World-View 3 satellite image acquired at 2015-March-14 of Hormozgan, Iran. The map is an older shape file provided by field surveying. Figure 6 displays a part of image and corresponding available features in database.
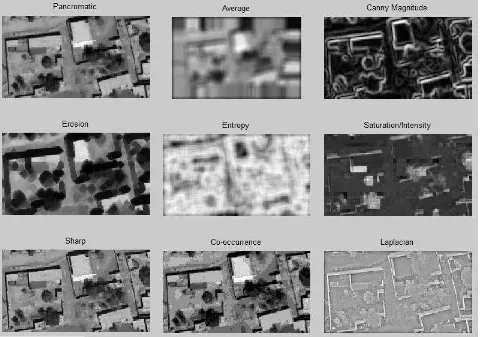
A tif. file containing all features is made to apply classification. Figure 8 displays how these features look visually. The neighbourhood is not displayed since it’s only a shift in x and y direction in average image. The result of classification is displayed in Figure 7.
Figure 6. Sample map and satellite image: buildings with less age are displayed by lighter colors.
Figure 7. Classification results for two main classes of buildings and vegetation.
Figure 8. Some of features used in classification.
4. DISCUSSIONS
There are a few points that should be noted in implementation stage. This type of supervised classification is suitable for natural development not hazards such as war (man-made) or earthquake (natural). Because all parameters involved in determination of change possibility are under the assumption of
natural development. Spatial data in data base should be topologically consistent, especially its hierarchical structure. For example a building constructed in a block, should be within its boundaries or blocks with owners can’t overlap with public areas such as roads.
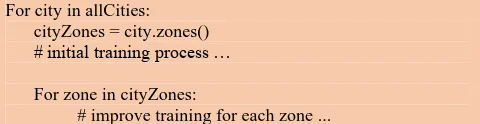
The overall process consists of a few loops, each devoted to levels of all areas, cities and zones. But training process is
applied within each city once and then localized for each zone
# improve training for each zone ...
Figure 9. The overall process consists of a few loops, devoted to levels of cities and zones.
Database should have a unique and integrated geographic system whereas image and maps should be geo-referenced with acceptable precision or else training process will encounter serious problems.
Image quality has direct effect on classification and overall efficiency. Use of infrared band can help to recognize vegetation which reduces misclassification errors. Also even though it has been mentioned that training happens for each city once and then it’s localized, that’s under assumption that a single image covers the whole city. In case that there are more than one image for the same city, training for each image is separately applied.
5. CONCLUSION
This paper proposed a method to provide geospatial information systems (GIS) with the ability of updating themselves using satellite images. In doing so, some attributes such as age, material, hierarchical structure and etc. (table 2) are added to geo-database to compute a change possibility parameter for each available feature. Then features with low change possibility are used to produce training data for supervised classification. Obtained results convey that changes can be recognized efficiently in areas with construction of new sites and buildings. Whereas recognition of new roads with non-asphalt cover encounters problems due to similarity with yards. Given the automation process in classification, feature selection for classification can also be automated which can certainly increase reliability of classification results and make its analysis easier.
REFERENCES
Acar, U., Bayram, B., 2009. Building extraction with morphology, in: 4th International Confernce on Recent Advances in Space Technologies (RAST). Ustanbul, Turkey, pp. 33–38.
Blaschke, T., Strobl, J., 2001. What’s wrong with pixels? Some recent developments interfacing remote sensing and GIS. GeoBIT/GIS.
Canny, J., 1986. A computational approach to edge detection. IEEE Trans. Pattern Anal. Mach. Intell. 8, 679–98.
Co-occurrence matrix [WWW Document], n.d. . Wikipedia. URL http://en.wikipedia.org/wiki/Co-occurrence_matrix (accessed 7.1.14).
Ehlers, M., Edwards, G., Y. Bedard:, 1989. Integration of remote sensing with geographic information systems: A necessary evolution. Photogramm. Eng. Remote Sensing 55, 1619–1627.
Lefevre, S., Weber, J., Sheeren, D., 2007. Automatic Building Extraction in VHR Images Using Advanced
Morphological Operators, in: Urban Remote Sensing Joint Event, 2007. Paris.
Map [WWW Document], 2014. . Wikipedia. URL en.wikipedia.org/wiki/Map (accessed 1.1.14).
Mather, P., Tso, B., 2003. Classification methods for remotely sensed data. CRC Press.
Mesev, V., 2008. Integration of GIS and remote sensing. John Wiley & Sons.
O’Brien, D., n.d. Image Entropy [WWW Document]. URL http://www.astro.cornell.edu/research/projects/compressi on/entropy.html (accessed 7.1.14).
SAN, D.K., 2009. Approaches For Automatic Urban Building Extraction And Updating From High Resolution Satellite Imagery. Middle East Technical University.
Star, J., Estes, J.E., McGwire, K.C., 1997. Integration of geographic information systems and remote sensing. Cambridge University Press.
Torre, V., Poggio, T. a, 1986. On edge detection. IEEE Trans. Pattern Anal. Mach. Intell. 8, 147–63.
Traurig, M., 2011. Map Production Increased by 50% With the same staff, using new system [WWW Document]. ESRI. URL http://www.esri.com/news/arcuser/0911/map-production-increased-by-50-percent.html
Wei, Y., Zhao, Z., Song, J., 2004. Urban building extraction from high-resolution satellite panchromatic image using clustering and edge detection, in: IGARSS. pp. 2008– 2010.
Ziaei, Z., Pradhan, B., Mansor, S. Bin, 2013. A rule-based parameter aided with object-based classification approach for extraction of building and roads from WorldView-2 images. Geocarto Int. 29, 554–569.