STOCHASTIC COLOURED PETRINET BASED HEALTHCARE INFRASTRUCTURE
INTERDEPENDENCY MODEL
Nivedita Nukavarapu a*, Surya Durbhaa
a
Centre of studies in resources engineering, IIT Bombay, Powai, Mumbai 400076, India - [email protected], [email protected]
Commission VIII, WG VIII/2
KEY WORDS: Stochastic Coloured Petri net, Critical Infrastructure Interdependency, Disaster Preparedness, Modelling and Simulation, Healthcare Critical Infrastructure
ABSTRACT:
The Healthcare Critical Infrastructure (HCI) protects all sectors of the society from hazards such as terrorism, infectious disease outbreaks, and natural disasters. HCI plays a significant role in response and recovery across all other sectors in the event of a natural or manmade disaster. However, for its continuity of operations and service delivery HCI is dependent on other interdependent Critical Infrastructures (CI) such as Communications, Electric Supply, Emergency Services, Transportation Systems, and Water Supply System. During a mass casualty due to disasters such as floods, a major challenge that arises for the HCI is to respond to the crisis in a timely manner in an uncertain and variable environment. To address this issue the HCI should be disaster prepared, by fully understanding the complexities and interdependencies that exist in a hospital, emergency department or emergency response event. Modelling and simulation of a disaster scenario with these complexities would help in training and providing an opportunity for all the stakeholders to work together in a coordinated response to a disaster. The paper would present interdependencies related to HCI based on Stochastic Coloured Petri Nets (SCPN) modelling and simulation approach, given a flood scenario as the disaster which would disrupt the infrastructure nodes. The entire model would be integrated with Geographic information based decision support system to visualize the dynamic behaviour of the interdependency of the Healthcare and related CI network in a geographically based environment.
* Corresponding author
1. INTRODUCTION
Critical Infrastructure (CI) consists of services and technological networks such as healthcare, transport, water supply, electricity supply, information technology etc. These systems are necessary for the well-being and to maintain effective functioning of society (Panzieri et.al, 2005). Understanding, analyzing, and sustaining the robustness and resilience of the critical infrastructure and their interdependencies requires modelling tools to assess the technical, economic, and security implications of technology and policy decisions designed to ensure their reliability and security. CI can be described as large scale spatially distributed systems with high degree of complexity. These complexities arise from the vast functional and spatial dependencies and interdependencies that exist among the infrastructure systems (Rinaldi et al., 2001) classified Interdependencies as: Physical, Cyber, Geographic and Logical. Failures can arise from critical infrastructure weaknesses and vulnerabilities located at physical or logical components, and also from the interdependencies between the critical infrastructures. Whatever the origin, failures can easily spread out, affecting the operating safety and the security of all the infrastructures.
Following is an example of CI interdependence , due to flooding in an area electricity gets disrupted, underground communication cables get destroyed, this results in disruption in communication infrastructure (e.g. phone and cell phone services, etc.) and as well as the information technology infrastructure (email services, web services). Disruption in
transportation infrastructure (road services, rail services) would delay the arrival of the repair personnel for getting the underground cables repaired. CI can be represented as nodes in a network where they are connected through a set of links depicting the logical relationship among them; these nodes are interdependent on each other, and interact with each at other at various levels, such that the state of each infrastructure influences or is correlated to the state of another. In a scenario such as the disruption in the service of one infrastructure nodes ( e.g. transportation) of the network during a disaster would lead to cascading and escalating disruptions across other infrastructures nodes( schools, hospitals, power grid, etc.) in the network (Pederson et.al, 2006).
1.1Motivation
Critical Healthcare Infrastructure depends upon a complex interdependent CI network such as transportation, electricity, water supply, Information technology, etc. And during disasters it is very vital for the critical Healthcare Infrastructure to be protected, accessible and prepared for a mass casualty. They must be able to provide timely critical services such as medical, nursing care, laboratory, and should have rapid response capabilities. To reduce the consequences of a disaster on the Critical Infrastructure and to ensure a resilient Critical Health Infrastructure network, knowledge, understanding, modelling and analyzing the interdependencies between the infrastructures is required (Nivedita et.al, 2014).
For modelling and simulation of HCI interdependencies, time factor is of main concern. It is one of the most important The International Archives of the Photogrammetry, Remote Sensing and Spatial Information Sciences, Volume XLI-B8, 2016
indexes for performance evaluation and prediction of the various HCI interdependencies and cascading effects of the CI on each other.
Following Questions related to the Disaster Scenario can be answered with a timed performance model;
How much time would it take for a Healthcare facility to be completely out of function when the flood level starts increasing?
How much time would it take to reach a particular system state? etc.
Such Timed performance model can provide facilities to simulate concurrent event process and their interdependent relationship (Wu et.al, 2008). We have focused on using Petri Net for the performance modelling of the Interdependencies as Petri nets are a graphical and mathematical modeling tool used to describe and analyze different kinds of dynamic systems.
Petri net is based on graph theory and is used for modelling and analysing the network characteristics, a basic Petri net contains two kinds of nodes: One of the nodes is called as
‘place’, which describes the states of the system. The other is ‘transition’ which describes the actions. Places and transitions are connected by directed arcs. The arc expressions describe how the state of the Petri nets change when the transitions occur. Each place contains a set of tokens. The transition fires by removing tokens from its input places and creates tokens, which are distributed to its output places (Petri, 1962) (Murata, 1989) (Bobbio, 1990). However, if the petri net model is quite complex and large, Coloured Petri nets (CPN) can be used to express better than a normal Petri net as CPN can distinguish various places with different colors i.e., by adding a particular data value to a token called as the token colour (Jensen, 1997; Jensen, 1998). If time factor is added to the transition of the Petri net, then it is termed as Timed Petri Net.
2. NEED FOR STOCHASTIC COLOURED PETRI NET FOR HEALTHCARE CI INTERDEPENDENCIES
A simulation model is a particular type of a mathematical model of a system; it can be further classified as being deterministic or stochastic in nature (Sheldon, 1996). Deterministic models have a known set of inputs, which will result in a unique set of outputs. Deterministic arrivals of tokens would occur at the places in the Petrinet, if all tokens arrived at their scheduled times (Sheldon, 1996).
In a stochastic or random process there is some indeterminacy: even if the initial condition (or starting point) is known, there usually involve inter-arrival times and random service times. Thus in a stochastic simulation, the output measures – the
directional arcs from place to transition,
where
denotes the outputs , which defines all the
directed arcs from Transition to places.
denotes the marking of the Petri net, which defines
the number of tokens present in the places, is the initial transitions, which are associated by a firing rate that specifies a parameter of the exponential distribution of the time span between subsequent firings of the transition. Thus, SPNs can be used to model the timing behaviour of an interdependent HCI network system. The firing rates of the tokens in Stochastic Petrinet are proportional to the failure probabilities of the various components of the interdependent CI network. Moreover the cases of transitions with a firing rate equal to 1 indicate that following a failure in the previous place, the next place will stop as well (Marsan, 1988). In timed stochastic coloured Petri-net, a transition requires a period of delay time from occurrence-able to occurrence of an event. That is to say, the duration that a transition t changes from the occurrence-able state to the occurrence state can be viewed as a stochastic variable xi. The stochastic variable xi represents the delay time consumed by a certain CI for getting affected and damaged.
Analytical techniques construct the so-called reachability graph or the state space graph from a SCPN, which is a labelled transition system, where each state represents a possible marking of the net. SPNs have similar assumptions as Markov chains. They only allow exponentially distributed firing rates. The reachability graph of the SCPN can be compared with the inherent Markov chain which can be solved analytically to determine the probabilities of the states of the interdependent CI network (Marsan, 1988) (Petri, 1962) (Murata, 1989) (Bobbio, 1990), (Sultana et.al, 2009).
2.1 Failure rate Estimation
Failure rate is the frequency with which an engineered system or Critical Infrastructure facility fails to function, expressed for example in failures per hour. It is often denoted by the Greek
letter λ. In practice, the closely related Mean Time Between
Failures (MTBF) is more commonly expressed and used for systems. Failure rate is usually time dependent, and an intuitive corollary is that the rate changes over time versus the expected life cycle of a system. It is the average time between system failures of the entire sample population. It is calculated as the total time over the number of failures (Nel et.al, 2011) (Pinna et.al,2013).
For a multi-state system, the data must be classified as the time-to-event data between given two states. An exponential distribution can be fit to this data by assuming that the time-to-event is a random variable. The mean of this dataset can be considered as the distribution parameter, which is also the transition rate for a Markov transition (Nel et.al, 2011) (Pinna et.al, 2013).
2.2 Failure rate Estimation
Failure rate is the frequency with which an engineered system or Critical Infrastructure facility fails to function, expressed for example in failures per hour. It is often denoted by the Greek
letter λ. In practice, the closely related Mean Time Between
Failures (MTBF) is more commonly expressed and used for
systems; MTBF is denoted by (θ). Failure rate is usually time
dependent, and an intuitive corollary is that the rate changes over time versus the expected life cycle of a system. It is the average time between system failures of the entire sample population. It is calculated as the total time over the number of failures (Nel et.al, 2011) (Pinna et.al,2013).
(1)
(2)
For a multi-state system, the data must be classified as the time-to-event data between given two states. An exponential distribution can be fit to this data by assuming that the time-to-event is a random variable. The mean of this dataset can be considered as the distribution parameter, which is also the transition rate for a Markov transition.
For example a Water pumping CI facility is tested for 500 hours and during this time it the CI facility experiences shutdown due to Power failure twice.
The estimate of the MTBF is:
If the MTBF is known, one can calculate the failure rate as the
inverse of the MTBF. The formula for (λ) is
In the following Table 1 we have shown the failure rate corresponding to various CI in our Stochastic Coloured Petri net model.
Table 1. List of Transition rate for Different Transitions.
2.3 Stochastic coloured petri net for Healthcare CI Interdependencies Simulation Model.
The main focus of this work is to construct a SCPN for Healthcare CI Interdependencies, the interaction as well as the influence of Electric supply CI, Water Supply CI and Transport CI on Healthcare CI at the onset of increasing flood levels. Three different SCPN models have been developed, which have been integrated together in a SCPN, such as:
1. Flood Level SCPN.
2. Healthcare Infrastructure Interdependency with Electric Supply, Water Supply, Transport CI SCPN.
Following is a scenario which has been considered while constructing the SCPN model:
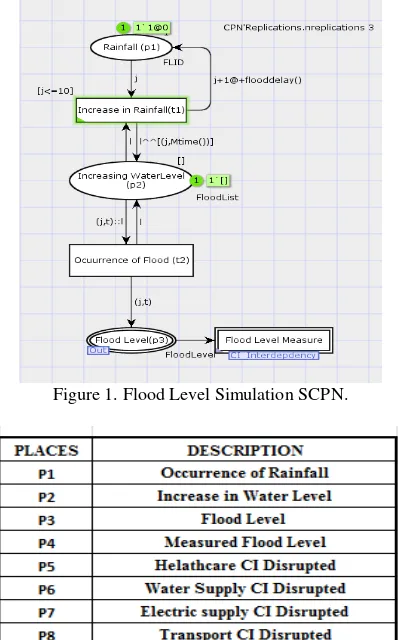
With the increase in Rainfall, onset of flood occurs and due to increasing flood levels, various CI present in different strategic locations have been disrupted. Each of the CI present in the SCPN as shown in figure 1 and figure 2 has been disrupted by an exponential time delay, therefore the CI would get affected at different time intervals and at different flood levels. However, even if the CI is disrupted at different time intervals, as these CI are interdependent on each other, disruption in one of the CI affects the other due to cascading effect of disruption. Hence, we can see that how there is a cascading effect of failure of one CI on another CI. Table 2 and Table 3 show the different places and transitions in the SCPN, whereas Figure 3 shows the various declarations, functions and Monitors used to create the HCI SCPN model.
Figure 1. Flood Level Simulation SCPN.
Table 2. Description of Places in HCI SCPN. The International Archives of the Photogrammetry, Remote Sensing and Spatial Information Sciences, Volume XLI-B8, 2016
Table 3.Description of Transitions in HCI SCPN.
Figure 2.Healthcare CI Interdependency Simulation SCPN.
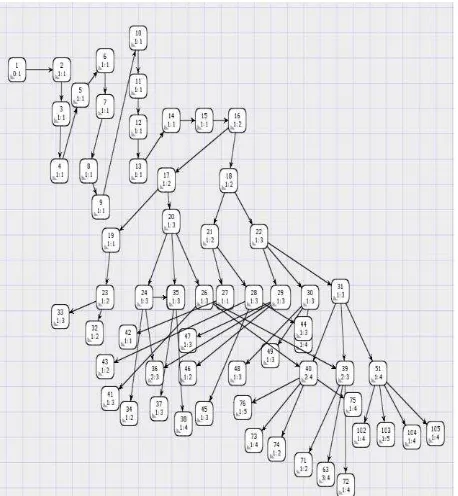
2.4 Reachability Graph
To derive performance indices from SPNs, either analytical techniques or simulation are available. Analytical techniques construct the so-called reachability graph from a SPN, which is a labelled transition system, where each state represents a possible marking of the net. With the firing rates, this is a Markov Chain (MC), which can be solved using Markov chain solution techniques. Instead, simulations execute an SPN, i.e., starting from an initial marking; they move tokens through the net by firing the transitions. After a simulation run reaches predefined stop criteria, various performance indices can be derived from the simulations data. SPNs have similar assumptions as Markov chains. They only allow exponentially distributed firing rates (Marsan, 1988) (Petri, 1962) (Murata, 1989) (Bobbio, 1990), (Sultana et.al, 2009). Figure 4 depicts some of the different states of the HCI interdependent SCPN.
Figure 4. Reachability Graph of the HCI Interdependent SCPN. The International Archives of the Photogrammetry, Remote Sensing and Spatial Information Sciences, Volume XLI-B8, 2016
3. PERFORMANCE ANALYSIS OF THE HCI INTERDEPENDENCIES SCPN MODEL
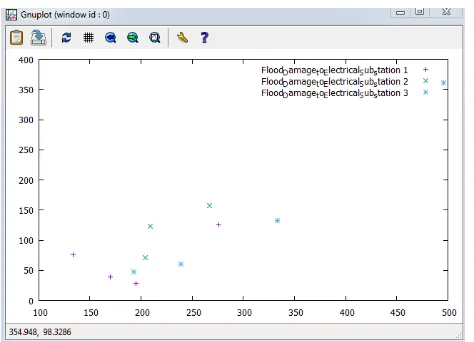
To measure the performance of the HCI SCPN model, simulation experiments have been performed in the CPN Tools. CPN Tools is a modeling and simulation tools based on the hierarchal CPN (Jensen, 1997; Jensen, 1998). CPN Tools includes many analysis and computation tools based on CPN. A visual platform for design and analysis of CPN is provided by CPN Tools. A group of performance analysis tools are provided by CPN Tools. Employing the group of performance analysis tools, various types of data collection monitors can be added into the simulation model. During the simulation experiments, these data collection monitors can observe and record online satisfied data value of the elements within our HCI SCPN model for offline analysis (Wells, 2006) (Wu et.al, 2008). Following Figure 5, Figure 6, Figure 7 depict the Increasing Flood Level Measure, Damage to Electrical CI and Damage to Healthcare CI for Different flood levels at different interval of time, whereas Figure 8 shows us the number of tokens present at the disruption of Healthcare CI.
Figure 5. Increasing Flood Level Measure.
Figure 6. Disruption to Electric Supply CI Due to Flood.
Figure 7. Disruption to Healthcare CI Due to Flood.
Figure 8. Number of Tokens Present in the Healthcare CI Place.
In experiments mentioned above, we see that with the increase in flood levels there is a change in the average delay time of the damage to the CI in Figure 6, and Figure 7. Whereas in Figure 5 shows the average delay in increase in flood levels with increase in rainfall. Figure 8 shows us that the Healthcare CI has been affected by increasing flood levels initially only those token were present , later the number of tokens for different flood levels have been added , which shows that the damage token form other affected CI have been added to the Healthcare CI. These are few performance indexes of the HCI SCPN model, However if we increase the number of monitoring conditions , the performance indexes would increase and various critical links of the Healthcare CI interdependencies can be identified. Therefore, the study of HCI Interdependencies can be improved, and the decisions in disaster rescue concerning the can be supported.
.
4. INTEGRATION OF THE HCI
INTERDEPENDENCIES SCPN MODEL WITH GIS
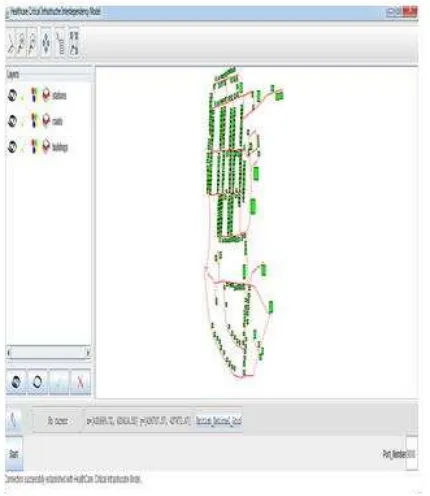
To integrate the developed HCPN model into a geographic information system, a code is been developed by using Comms/CPN which is a CPN ML library which makes it possible for CPN Tools to communicate based on TCP/IP with external application and processes (Jensen, 1997; Jensen, 1998), and GeoTools which is an open source Java package (GeoTools, 2016). GeoTools provides standards compliant methods for the manipulation of geospatial data, for example to implement Geographic Information Systems (GIS).The SCPN Healthcare Infrastructure model runs on the Petri net based environment whereas the Multi Agent simulation runs in GIS based environment, the communication between the two is done by using a TCP/IP enabler and client–server architecture as shown in Figure 9.
Figure 9. Healthcare SCPN model Connection with the GIS client.
Work is in progress for integrating it with a geographical information system for better visualization and analysing the interdependencies in a geographic analysis environment.
5. CONCLUSION
The targeted user community for the proposed model is the disaster response personnel or organisations managing crisis activities (e.g. Health care managers, Emergency management personnel etc.) who are responsible to manage disaster preparedness challenges with a broad range of facility, system, and response activities to quickly inform on and off-duty healthcare, and other interrelated sectors personnel in the event of an emergency.
REFERENCES
Bobbio A 1990. System modeling with Petri nets. In: Colombia AG, Saiz de Bustamante A (eds) System reliability assessment, pp 102–143.
CPN Tools, http://wiki.daimi.au.dk/cpntools/cpntools.wiki.
GeoTools, http://geotools.org.
Gursesli O, Desrochers AA 2003. Modeling infrastructure interdependencies using Petri Nets.IEEE:1506–1512.
Krings A, Oman P 2003,. "A simple GSPN for modelling common mode failures in critical infrastructures." System Sciences. Proceedings of the 36th Annual Hawaii International Conference on. IEEE, 2003. Disaster Rescue Action Using Stochastic Petri Net. In Industrial Control and Electronics Engineering (ICICEE), 2012 International Conference on (pp. 111-115). IEEE.
Murata T 1989. Petri nets: properties, analysis and applications. Proc IEEE 77(4):541–580.
Nel, D. T., & Haarhoff, J. (2011). Bulk water distribution power supply failures. Journal of the South African Institution of Civil Engineering, 53(1), 55-60.
Omidvar, B., Malekshah, M. H., & Omidvar, H. (2014). Failure risk assessment of interdependent infrastructures against earthquake, a Petri net approach: case study—power and water distribution networks. Natural Hazards, 71(3), 1971-1993.
Panzieri S, Setola R, Ulivi G 2005. "An approach to model complex interdependent infrastructures." World Congress. Vol. 16. No. 1. 2005.
Pederson, P., Dudenhoeffer,D., Hartley.S, and Permann,M 2006. "Critical infrastructure interdependency modeling: a survey of US and international research." (2006): 1-20.
Petri, C. A. 1962. 'Communicating with Automata'. PhD thesis, Technical University Darmstadt,Germany.
Pinna, B., Babykina, G., Brinzei, N., & Pétin, J. F. (2013, September). Deterministic and stochastic dependability analysis of industrial systems using Coloured Petri Nets approach. In Annual Conference of the European Safety and Reliability Association, ESREL 2013 (pp. 2969-2977). Taylor & Francis Group, ISBN 978-1-138-00123-7.
Sultana S, Chen Z 2007.Modeling of flood-related interdependencies among critical infrastructures. Geomatics The International Archives of the Photogrammetry, Remote Sensing and Spatial Information Sciences, Volume XLI-B8, 2016
Solutions for Disaster Management. Springer Berlin Heidelberg, 2007. 369-387.
Wells, L. (2006, October). Performance analysis using CPN tools. In Proceedings of the 1st international conference on Performance evaluation methodolgies and tools (p. 59). ACM.
Wu, Z., Yuan, L., Yang, J., & Xiong, W. (2008, December). A stochastic timed performance model for web service composition. In Information Science and Engineering, 2008. ISISE'08. International Symposium on (Vol. 2, pp. 535-538). IEEE.
Zuberek W (1991) Timed Petri nets: definitions, properties and applications. Microelectro Reliab 31(4): 627–644.