A Thesis
Submitted to English Department as a Partial Fulfillment of the Requirement for S.Pd Degree
by:
CINDYRA GALUH WARDANI 1201050012
ENGLISH DEPARTMENT
TEACHER TRAINING AND EDUCATION FACULTY UNIVERSITY OF MUHAMMADIYAH PURWOKERTO
EVALUATION IN TEACHING 6th
EDITION
TEXTBOOK AT ENGLISH DEPARTMENT
UNIVERSITY MUHAMMADIYAH OF
PURWOKERTO.
Author’s Identity:
Name : Cindyra Galuh Wardani
Sex : Female
Student Number : 1201050012
Faculty : Teacher Training and Education
Department : English Education Department
Address : Jl. Palem Indah Blok C2 no 62, Rt/w: 03/10,
Purwokerto Timur, Banyumas, Jawa Tengah
E-mail : cindyragaluhw @gmail.com
Supervisor : Dr. Furqanul Aziez, M. Pd.
Approved by:
Supervisor
Dr. Furqanul Aziez, M. Pd.
Alhamdulillahirobbil’alamin, praise be merely to the Almighty Allah SWT
for His gracious mercy, and tremendous blessing that enable me to accomplish this bachelor thesis entitled: “Students’ Perception as Readers of Groundlund’s
Measurement and Evaluation In Teaching 6th Edition Textbook at English Department University Muhammadiyah of Purwokerto.”. This thesis is presented to fullfil one of the requirements in accomplissing S-1 Degree in English Education Study Program, Teacher Training and Education Faculty, University of Muhammadiyah Purwokerto. The writer would like to express her great special appreciation to:
1. Drs. H. Syamsuhadi Irsyad, S. H, M. H, the Rector of University of Muhammadiyah Purwokerto
2. Drs. Pudiyono, M.Hum, the Dean of Teacher Training and Education Faculty who has given the permission to write this thesis.
3. Rina Agustina, S. S., MApplLing TESOL., the Head of English Department who has given opportunity and agreement to conduct this study.
4. Dr. Furqanul Aziez, M. Pd. for the valuable assistance and inspiration to the completion of this bachelor thesis.
5. All of my lecturers in English Department for inspiring me with their guidance and patience during my study in this university.
Hopefully this thesis will be useful for English education especially for lectures and English Learners.
Purwokerto, August 2016
Most Merciful, Allah SWT who always gives me all the best of this life and there is no doubt about it. This bachelor thesis is presented to fulfill one of the requirements in accomplishing the S-1 Degree at English Department of Teachers Training and Education Faculty in the University of Muhammadiyah Purwokerto.
The writer would like to take my opportunity to express my deep and sincere gratitude to following:
1. My father Hudoyo Supangat and My mother Ery Sutriyatmi, for your countless prayers, love, your endless forgiveness and always support in every single day.
2. My dearest lovely brothers Citra Pradipta, who always make my days colorful with your jokes, and thanks for your support and advice.
3. Dr. Furqanul Aziez, M. Pd. as my advisor who has guided me patiently in composing this thesis.
4. My best friends Unggul Budi Suryanto, who always stay with me, support me, and correct my mistakes, and give me million experiences with you. Thank you so much for your sincere, and accompanying me to finish my thesis well. Thank you for being my partner.
wonderful experience with you guys.
7. For everyone who gave every single small help and support during my study and my thesis working, including officer staffs, copy centers, food counters, and etc.
Purwokerto, August 2016
“Barangsiapa yang mengerjakan kebaikan seberat dzarrah (biji atom),
niscaya dia akan menerima (balasan)nya. Dan barangsiapa yang
mengerjakan kejahatan seberat dzarrah (biji atom) pun, niscaya dia
APPROVAL ... ii
CHAPTER 1 INTRODUCTION ... 1
A. Background of the Research ... 1
B. Reasons for Choosing the Topic ... 3
C. Problems of the Research ... 3
D. Objectives of the Research ... 4
E. Clarification of Term ... 4
F. Contribution of Research ... 5
CHAPTER II LITERATURE REVIEW ... 6
A. Perception ... 6
1. Definition of Perception ... 6
2. Factor Affecting Perception ... 7
3. Part of Perception ... 7
4. Basic Principles of Perception... 8
5. Students’ Perception ... 10
B. Textbook ... 10
1. Definition of Textbook ... 10
2. Evaluation ... 11
3. The Function of Perception ... 12
4. Textbook Criteria ... 14
E. The Technique of Analyzing Data ... 19
CHAPTER IV RESULT AND DISCUSSION ... 23
A. Results ... 23
B. Discussion ... 39
CHAPTER V CONCLUSION AND SUGGESTION ... 49
A. Conclusion ... 49
B. Suggestion ... 50 REFERENCES
LIST OF APPENDICES
APPENDIX A Instrument
CINDYRA GALUH WARDANI 1201050012
ABSTRACT
The aimed of this research were to find out the students’ perception of Gronlund’s textbook, entitled measurement and evaluation in teaching 6th
edition at English department University Muhammadiyah of Purwokerto.
This research used descriptive method. It was conducted at English Department University Muhammdiyah of Purwokerto on June 21st – 25th, 2016. The subject of this research was the sixth semester students at English Department University Muhammdiyah of Purwokerto, consisting of 115 students. To determine the sample, the writer used random sampling technique. The total number of sample was 35 respondents (30% of 115 students). The writers used close questionnaire as instrument of this research.
After data had been analyzed, it was found that most of students were in good category (54.28% or 19 students and had scale 2.97). It could be seen from mean scale of each indicators; 3.19 (material of textbook), 3.00 (grafika of textbook), and 2.94 (Readability of Textbook)
CHAPTER I INTRODUCTION
In this chapter, there are some descriptions about the background of the research, the reason of choosing the topic, the problem of the research, the aims of the research, the clarification of term, and the contribution of the research.
A. The Background of Research
People can get some information from electronic media such as television and radio, and print media like a books, article, newspaper, and internet. To getting information especially from print media, people should have reading skill. From reading, people can get more information easily that they needed in daily life. Reading is an important thing, which is to get some information from books. Books are a source of knowledge, and books often called the window of the world. Learners get more information about their lesson through reading some textbooks.
Tarigan, 1986) explained that textbook is learning tool that can be used in schools and colleges to support a program of teaching and understanding of modern and commonly understood. It can be said that through textbook, learners can develop their knowledge and insight that will be equipped to get a job, means the book is a tool that has important thing in supporting the learning process of students.
Students commonly use textbooks as an aid to study in the learning process, however some of them do not read their textbooks whereas they should. The lack of reading becomes clear concern, and teacher must overcome it in
order for students to read the textbook well. Understanding students’ perceptions
of their textbooks is first step to know the problem.
There is a research about students’ perception as reader to supporting this research. Filiatrault (2008) held the research about students’ perception of
themselves as readers. This research examined how big the impacts of students’
perceptions, toward students’ motivation to read. The results found that most students have a positive perception as reader while they are reading in school or at home. They feel enjoy reading in school, because they have many access to read various text genres.
Based on this condition, the writer was interested to investigate the
students’ perception as readers of Gronlund and Linn textbook entitled
Measurement and Evaluation in Teaching 6th Edition particularly students in
English Department at Muhammadiyah University of Purwokerto who has joined
textbook in LT 1 (Measurement and Evaluation in Teaching 6th Edition) is
appropriate or not for them. Therefore, a research entitled “Students’ Perceptions
as Reader of Gronlund and Linn textbook entitled “Measurement and Evaluation
in Teaching 6th Edition” at English Department, Muhammadiyah University of
Purwokerto” is conducted for observing the students’ perception of the textbook
that they used in Language Testing 1 courses.
B. The Reasons of Choosing the Topic
This research is conducted by holding on two reasons:
1. Textbooks is the pedagogical aids that can help the students in learning the
materials, especially in LT 1 courses. Textbook should readable for students,
because if the textbook is difficult to read, students do not understand well
about the materials which is in textbook. Therefore, it is needed a research to
know how is the students’ perception as readers of “Measurement and
Evaluation in Teaching 6th Edition” textbook.
2. Based on perception we can know the students’ interest in learning their
textbooks, especially in LT 1. The students who have good perception about
C. The Problems of The Research
To make an analysis of the problems, the statement of the problem of the research is stated as follows:
How is the students perception on “Measurement and Evaluation in Teaching 6th Edition” textbook?
D. The Aims of Research
Based on the problem of the research, the aim of this research is to find out the perception of the sixth semester students on “Measurement and Evaluation in
Teaching 6th Edition” textbook at English Department Muhammadiyah
University of Purwokerto.
E. Clarification of Terms
To help the readers, there were the clarification of term used in this study as follows:
1. Students’ Perception
Perception as the act, process, or product of perceiving, the ability or capacity to perceive, or a particular way of perceiving to become aware or gain knowledge of something through the sense, or to comprehend or grasp a stimulus. (Sabina, 2008)
2. Textbooks
F. Contribution of Research
I hope that, this research gives important contribution in learning process. The following are some contributions:
1. For the students
The students will be motivated and interested in learning “Measurement and
Evaluation in Teaching 6th Edition” textbook, so they can have more
knowledge. 2. For the lecturer
The lecture can know how the students’ perception about “Measurement and
Evaluation in Teaching 6th Edition” textbook in order to know the students’
point of view about this book. 3. For other the writers
CHAPTER II LITERATURE REVIEW
This chapter present the theoretical framework of this research. The writer write the definition of perception and textbook.
A. Perception
1. Definition of Perception
Perception is the process of selecting, organizing, and interpreting information. (Schmitz, 2009). Perception is the process that used by people to manage and interpret impression of their sense to give meaning to their environment. People that have perception on an object can be positive or negative ways.
Rakhmat (2001) said that perception is an experience about object phenomenon, or connections in ways to conclude information and to interpret message. The process of human to know something based on their sense. It can be said that during the process, a person continually interact with his/her environment. In the interaction, five senses are used. Those are vision, hearing, taste, smell, and touch. Those thing, may give stimulation. The
process of perception is cannot be separated from the sensation’ process.
Sensation is a part of perception.
give an image in their vision to form a response in their brain ro give a depend on personal psychological factors such as: feelings, willingness, needs, sex, motivations, and attentions. Every human being has different characteristics and temperament which are also shaped by individual’s
family and individual’s environment
b. External Factors
This factors, which comes from outside of individual such as stimulus, environment culture, believe. Our life relates with environment, both physical and social environment.
3. Part of Perception
Schmitz (2009) explained that there are three parts of Perceptions. Those are as follows:
a. Selecting
b. Organizing
Organizing is the second part of the perception process, in which we sort and categorize information that we perceive based in innate and learned cognitive patters.
c. Interpretation
Interpretation is the third part of the perception process, interpretation is the cognitive aspect of perception that give a meaning to stimulus which accepted. Interpretation process depend on how deepening, motivation, and personality.
4. Basic Principles of Perception
Knowing and implementing basic principles that related with perception is very important for the teachers, in order to know their student
well. Students’ perception is known to optimize the teacher when they are
teach. Understanding the students’ character will facilitate the teacher when they teaching, so teacher can know what they should do in class based on the
student’s want. Through students’ perception, the teacher will know the
character of the students. There are many basic principles about perception that should be known for teacher in order to know the students’ characteristic (Slameto, 2010) those are:
a. Perception is relative not absolute
The teacher can predict student’s perception for next lesson because the
teacher has been know this from previous lesson that being taught. b. Perception is selective
Human just pay attention with some stimulation from many stimulation in his environment. It means that perception which accepted will be depend on what is they have been learned.
Based on that principle, the teacher must should choose the part that need to be pressure to get more attention from the students.
c. Perception is arrangement
People receive the stimulus not with randomly. They will receive it in the form of relations or group. If the stimulation coming is uncompleted, they will complete it until the relations or groups can be clear.
For the teacher, this principle show that the lesson should be deliver in good order. If the subject matter is not composed well, students will composed it by themselves in a relationship of a group that can be understood by the students and it can be different from the teacher. The result is a misinterpretation or misunderstanding.
d. Perception is influence by expectation and readiness
e. Perception of someone or groups can be different with other perception although in the same situation
For the teacher, this principle means that the perception can be more or less the same with the perception shared by other classes with the same subject matter that have been taught.
5. Students’ Perception
Students are the most important of teaching and learning process.
Students’ perception is the preferential process of students toward
information they get from an object, in this research is students’ perception of
Gronlund's Measurment and Evaluation in Teaching 6th edition textbook. It
is important to understand student’s perception as a readers of the textbook
that they used in Language Teaching 1 course.
B. Textbook
1. The Definition of Textbook
Book is a window of the world. Through the books, people can observe and explore the world easily. Textbooks are made in order to be understood as learning media that which used among the other learning media. Textbook give teachings in a field of study.
action, skill, information, illustration in the form of fact, concepts, principles, and processes that related to a particular subject to achieve a goal of learning. Some argue state that textbooks are a magical tool, they give learners a sense of system, cohesion, and progress, and they help to achieve consistency and
continuation. (O’Neil, 1982; Littlejohn, 1998; Kayapinar, 2009)
Based on definition above, we can conclude that the meaning of textbook is an essay in form of standard book that used for teacher and students in teaching and learning process for instructional purposes. Using textbook, teaching and learning process in school or at the university can be more smoothly and effective. Textbook also can improve basic skill and knowledge that students have gained before enter the class. So, textbook can be used, for stabilization of memory, understanding concept, make students think critical, and develop their knowledge.
2. Evaluation
provide the information that is useful for the decision maker to determine the policies to be taken, based on the evaluation that has been done.
Textbook evaluation is needed to know whether the textbook is good or bad for students. With evaluation, textbook can be measured well. Analyze the textbook is one of the way to know the quality of the textbook that used in learning activity. Textbook have important role for teacher, and especially students as a media to help them.
Based on the definition above, can be concluded that evaluation is the systematic application of scientific procedures to assess the design, then present the information of decision on the implementation and effectiveness of a program. Evaluation includes of measuring and assessing that used in the decision making process. The relation between measuring and assessing is related each other.
3. The Function of Textbook
Greene and Pettyin Tarigan (1986) formulate some roles and uses of textbook as follows:
a. Reflects a point of view point, should be sophisticated and modern about teaching and demonstrating the application in teaching materials presented.
b. Provide a source of subject matter should be easy to read for students, and varied, also accordance with the interest and needs of the students, as the basic of activities programs suggested where expressional skill obtain in conditions that resemble real life.
c. Provide a source which is well organize and the staged of expressional skill.
d. Present methods and means of teaching to motivate students.
e. Presents the initial fixation as well as support for exercise and practical tasks.
f. Presenting the materials or the means of evaluation and remedial, should be harmonious and appropriate.
The status of textbook in teaching learning process is the one of learning source that provide the material which are needed for students to achieve the learning purpose. The other function of textbook to support teacher in teaching learning process, textbook also the source of knowledge for the students. Especially if we remember that the learning activity is cannot be separated from reading and writing activity.
4. Textbook Criteria
In principle, each book certainly has different advantages and disadvantages. However, the presentation of textbook are expected can fill many aspect of the teaching and learning process, and can be done independently by students as a learners.
Quality of textbooks are influence by several factors such as, point of view, clarity of concept, relevance of curriculum, attract students, motivate, stimulate the activity of students to learn, illustration, the language is
appropriate with students’ ability, effective sentence, the interesting
language, polite and modest, support the other subject, respect for individual opinion, not contain the disturbances element that related to ethnicity, race, and religion.
CHAPTER III
RESEARCH METHODOLOGY
This chapter presents the methodology of the present research. It deals with the method of research, the place and the time of research, the object of research, the technique of collecting data and the technique of analyzing data.
A. Research Method
Basically, research is activity or systematic process to solve the problem which doing with scientific method (Emzir, 2007). This research considers as descriptive research, because the writer does not do anything with object which is researched (Arikunto, 2010). Descriptive research is a study which is aimed to investigate a condition or situation, of the results are presented in form of a research report.
This research will be done to find out and describe the students’ perception as readers of Gronlund’s Measurment and Evaluation in Teaching 6th edition textbook at English Department in University Muhammadiyah of Purwokerto.
B. The Subject of Research 1. Population
Data population is the collection of data, which found by the writer at the
which can be human, animals, plants, and object that have the same
characteristic.
The population of this research is the students of sixth semester students
of English Department at University Muhammadiyah of Purwokerto in
academic year 2013/2013. The total number of population is 115 students.
2. Sample
more than 25 % from the population depends on the situation.
This research takes 30 % as sample because the number of population of
this research is more than 100. The number of sixth semester in academic
2013/2014 is 115 students. Therefore, the number of students that taken as
the sample of this research is 34.5 rounded to 35 students.
3. Sampling Technique
by mixing the subject in population, so all subjects have the same opportunity to be selected.
There are four classes of sixth semester students of English Department of Muhammadiyah University of Purwokerto, class a, b, c, and d. Each class of representatives chosen random, or by lottery method. Based on lottery, 35 students of sixth semester are chosen as representative of the population.
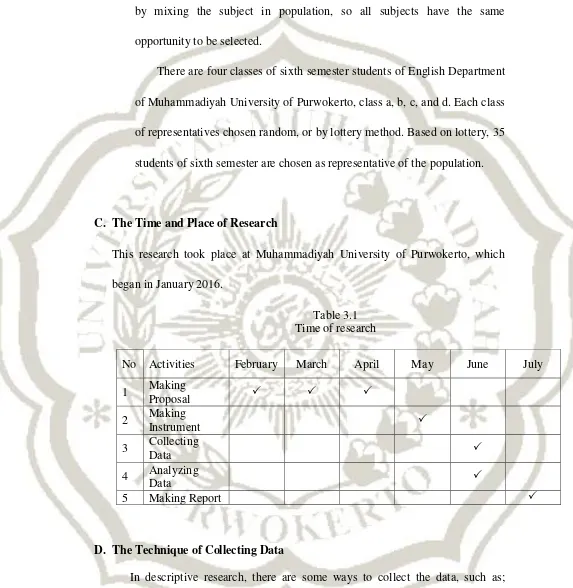
C. The Time and Place of Research
This research took place at Muhammadiyah University of Purwokerto, which began in January 2016.
D. The Technique of Collecting Data
This research chose questionnaire as the instrument to get the students’ perception responses. The instrument consisted of close questionnaire. In a research, collecting the data should be done carefully, systematic, and accurate. So that, the data which collected relevant with the problem of the research. Therefore, the data collection methods used in this research are as follows:
1. Literature Review
This technique used to collect the data that related with the theme of research. Literature review is done with studying reference books, reports, magazines, journals, and other media, which related with the this research. 2. Questionnaire
A questionnaire is a number or written question, which used to gain information from the respondents about themselves, their knowledge or whatever they know.
There are two types of questionnaires (Hadi: 2002), those are follows:
a) Essay questionnaire, this type have two forms, they are open form questionnaire and close form questionnaire. This research used closed questionnaire.
b) Choice questionnaire, this type also has two form. They are questionnaire and multiple choice.
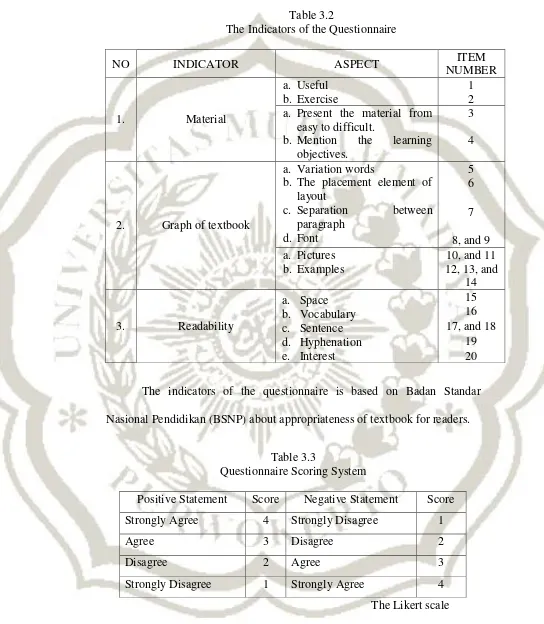
The instrument on the students’ perceptions was made by referring to the
Table 3.2 Nasional Pendidikan (BSNP) about appropriateness of textbook for readers.
Table 3.3
Questionnaire Scoring System
Positive Statement Score Negative Statement Score
Strongly Agree 4 Strongly Disagree 1
Agree 3 Disagree 2
Disagree 2 Agree 3
Strongly Disagree 1 Strongly Agree 4
Where: E. The Technique of Analyzing Data
After collecting the data, the next step is analyzing the data based on the
After the data collected, the writer analyze by the following steps: 1. Determining the score of the respondent from questionnaire.
2. Determining the scale of students’ perception by using the formula:
3. Determining the coefficient perception (mean) by using the formula:
After knowing the scale of students’ perception and the mean score of the
total scale of students’ perception, the the writer will carry on to the next step,
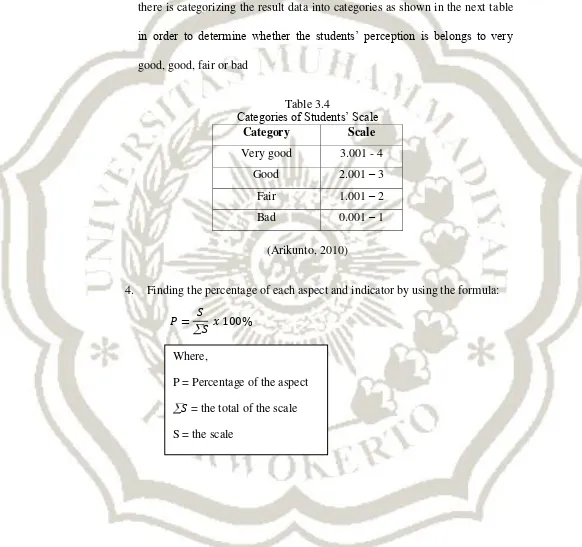
there is categorizing the result data into categories as shown in the next table
in order to determine whether the students’ perception is belongs to very
good, good, fair or bad
Table 3.4
Categories of Students’ Scale
Category Scale
Very good 3.001 - 4
Good 2.001 – 3
Fair 1.001 – 2
Bad 0.001 – 1
(Arikunto, 2010)
4. Finding the percentage of each aspect and indicator by using the formula:
Where,
P = Percentage of the aspect
5. The discussion and interpretation of the research finding.
This step the writer discusses about the result of the research finding from the questionnaire result. The procedure as follows:
a. Explaining each indicators. Those aspect are the material in textbook, the graphic, and the readability of textbook. It is based on questionnaire result that have been conducted.
b. Explaining each number. Number 1 – 20 6. Conclusion
After analyzing all the data, the writer will do the conclusion. The
conclusion of this research will answer the research’s question about
CHAPTER IV
RESULTS AND DISCUSSION
This chapter discusses the data analysis and findings from 20 questionnaires that completed by students who are being correspondent.
A. Results
The research was conducted on students of sixth semester in English Department, University Muhammdiyah of Purwokerto on June 2016. To get the data, the writer used questionnaire for students. After that the data analyzed by using descriptive statics. The result of the research are bellows.
1. Students’ Perception on “Measurement and Evaluation in Teaching 6th Edition” textbook.
After obtained the data from respondent, then make analysis of
student’s perception. It was used individual perception in computing the data.
For example of student no 1.
Thus, the student number 1 was belonged to very good category.
After finishing the computation on students’ perception scale, the
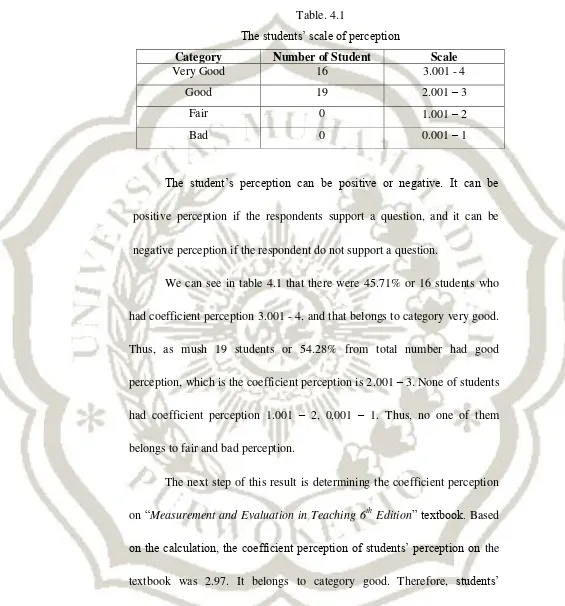
Table. 4.1
The students’ scale of perception
Category Number of Student Scale
Very Good 16 3.001 - 4
negative perception if the respondent do not support a question.
We can see in table 4.1 that there were 45.71% or 16 students who
had coefficient perception 3.001 - 4, and that belongs to category very good.
Thus, as mush 19 students or 54.28% from total number had good
perception, which is the coefficient perception is 2.001 – 3. None of students
had coefficient perception 1.001 – 2, 0,001 – 1. Thus, no one of them
belongs to fair and bad perception.
The next step of this result is determining the coefficient perception
on “Measurement and Evaluation in Teaching 6th Edition” textbook. Based
on the calculation, the coefficient perception of students’ perception on the
textbook was 2.97. It belongs to category good. Therefore, students’
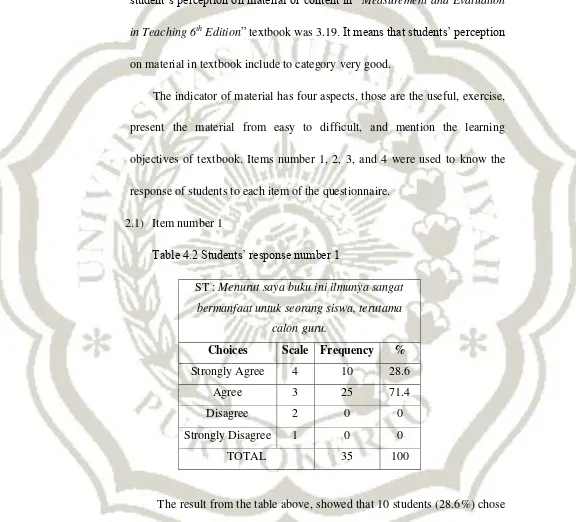
2. Students’ Perception on Materials
Based on formula in Chapter III, the result showed that the coefficient of
student’s perception on material or content in “Measurement and Evaluation
in Teaching 6th Edition” textbook was 3.19. It means that students’ perception
on material in textbook include to category very good.
The indicator of material has four aspects, those are the useful, exercise,
present the material from easy to difficult, and mention the learning
objectives of textbook. Items number 1, 2, 3, and 4 were used to know the
response of students to each item of the questionnaire.
2.1) Item number 1
Table 4.2 Students’ response number 1
ST : Menurut saya buku ini ilmunya sangat bermanfaat untuk seorang siswa, terutama
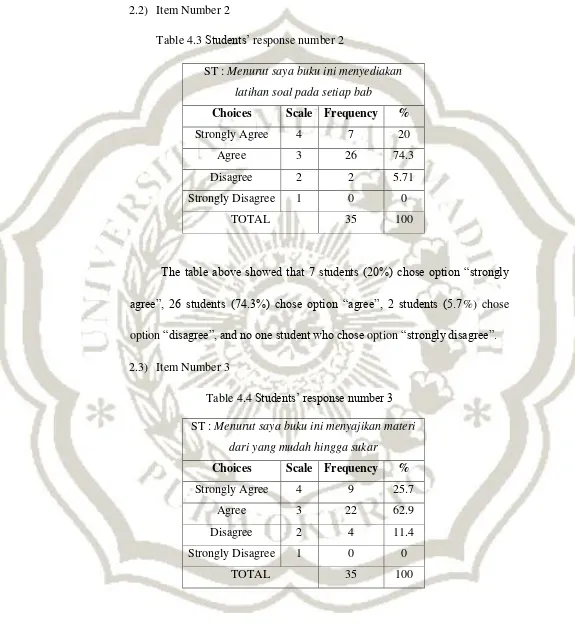
2.2) Item Number 2
Table 4.3 Students’ response number 2
ST : Menurut saya buku ini menyediakan latihan soal pada setiap bab
The table above showed that 7 students (20%) chose option “strongly
agree”, 26 students (74.3%) chose option “agree”, 2 students (5.7%) chose
option “disagree”, and no one student who chose option “strongly disagree”.
2.3) Item Number 3
Table 4.4 Students’ response number 3 ST : Menurut saya buku ini menyajikan materi
From the table above, we can see that 9 students (25.7%) chose
“strongly agree”, 22 students (62.7%) chose “agree”, 4 students (11.4%)
chose “disagree”, and in this item, there was no students who chose
“strongly disagree”.
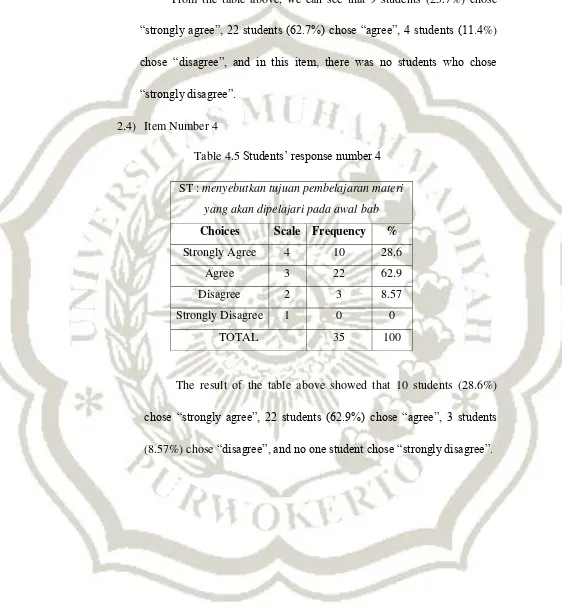
2.4) Item Number 4
Table 4.5 Students’ response number 4
ST : menyebutkan tujuan pembelajaran materi yang akan dipelajari pada awal bab Choices Scale Frequency %
Strongly Agree 4 10 28.6
Agree 3 22 62.9
Disagree 2 3 8.57
Strongly Disagree 1 0 0
TOTAL 35 100
The result of the table above showed that 10 students (28.6%)
chose “strongly agree”, 22 students (62.9%) chose “agree”, 3 students
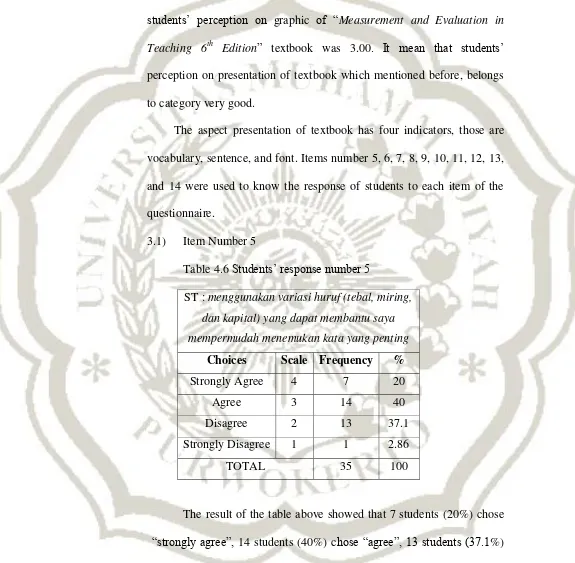
3. Students’ Perception on Graphic of textbook
The result of the computation showed that coefficient perception of
students’ perception on graphic of “Measurement and Evaluation in
Teaching 6th Edition” textbook was 3.00. It mean that students’
perception on presentation of textbook which mentioned before, belongs to category very good.
The aspect presentation of textbook has four indicators, those are vocabulary, sentence, and font. Items number 5, 6, 7, 8, 9, 10, 11, 12, 13, and 14 were used to know the response of students to each item of the questionnaire.
3.1) Item Number 5
Table 4.6 Students’ response number 5
ST : menggunakan variasi huruf (tebal, miring, dan kapital) yang dapat membantu saya mempermudah menemukan kata yang penting
The result of the table above showed that 7 students (20%) chose
“strongly agree”, 14 students (40%) chose “agree”, 13 students (37.1%)
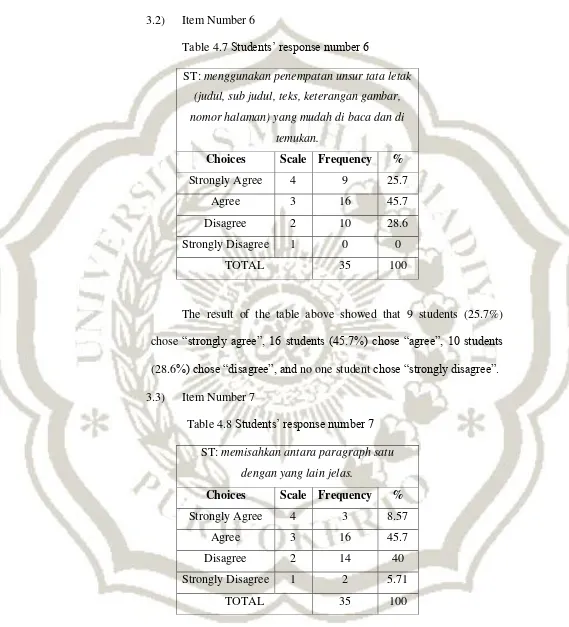
3.2) Item Number 6
Table 4.7 Students’ response number 6
ST: menggunakan penempatan unsur tata letak (judul, sub judul, teks, keterangan gambar, nomor halaman) yang mudah di baca dan di
temukan. chose “strongly agree”, 16 students (45.7%) chose “agree”, 10 students (28.6%) chose “disagree”, and no one student chose “strongly disagree”. 3.3) Item Number 7
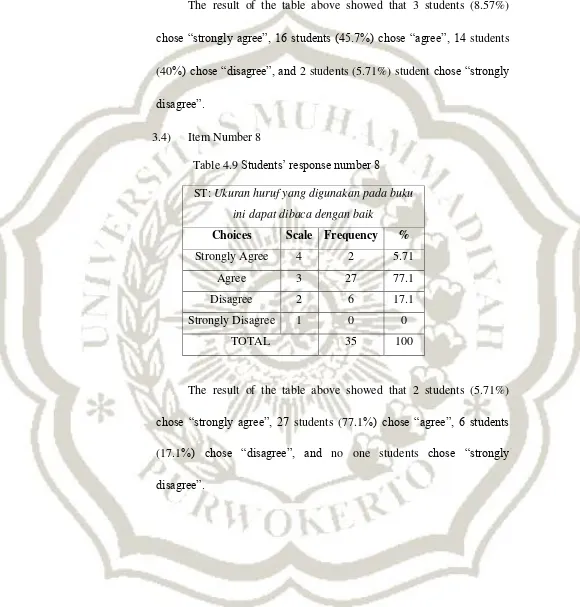
The result of the table above showed that 3 students (8.57%)
chose “strongly agree”, 16 students (45.7%) chose “agree”, 14 students
(40%) chose “disagree”, and 2 students (5.71%) student chose “strongly
disagree”.
3.4) Item Number 8
Table 4.9 Students’ response number 8
ST: Ukuran huruf yang digunakan pada buku ini dapat dibaca dengan baik
Choices Scale Frequency %
Strongly Agree 4 2 5.71
Agree 3 27 77.1
Disagree 2 6 17.1
Strongly Disagree 1 0 0
TOTAL 35 100
The result of the table above showed that 2 students (5.71%)
chose “strongly agree”, 27 students (77.1%) chose “agree”, 6 students
(17.1%) chose “disagree”, and no one students chose “strongly
3.5) Item Number 9
Table 4.10 Students’ response number 9
ST: Jenis huruf pada media ini terbaca dengan baik.
The result of the table above, we can see that 9 students (25.7%)
chose “strongly agree”, 25 students (71.4%) chose “agree”, 1 student
(2.86%) chose “disagree”, and no one students chose “strongly
disagree”.
3.6) Item Number 10
Table 4.11 Students’ response number 10 ST : Menyajikan gambar untuk mempermudah
From the table above, it was seen that 7 students (20%) chose
option “strongly agree”, 17 students (48.6%) chose option “agree”, 11
students (31.4%) chose option “disagree” and there no student chose
option “strongly disagree”.
3.7) Item Number 11
Table 4.12 Students’ response number 11
ST: Gambar yang disajikan sesuai dengan materi yang disajikan.
Choices Scale Frequency %
Strongly Agree 4 10 28.6
Agree 3 22 62.9
Disagree 2 3 8.57
Strongly Disagree 1 0 0
TOTAL 35 100
From the table above, it seen that 10 students (28.6%) chose
option “strongly agree”, 22 students (62.9%) chose option “agree”, 3
students (8.57%) chose option “disagree”, and there was no students who
3.8) Item Number 12
Table 4.13 Students’ response number 12 ST: Memberikan contoh ilustrasi pada
From the table above, it was known that 8 students (22.9%) chose
option “strongly agree”, 27 students (77.1) chose option “agree”, for mengganggu judul, teks, dan angka halaman
From the table above, it was seen that 7 students (20%) chose
option “strongly agree”, 27 students (77.1%) chose option “agree”, 1
students (2.86%) chose option “disagree”, and there was no students who
chose option “strongly disagree”.
3.10) Item Number 14
Table 4.15 Students’ response number 14
ST: Contoh ilustrasi pada buku ini mampu memperjelas materi
Choices Scale Frequency %
Strongly Agree 4 10 28.5
Agree 3 19 54.3
Disagree 2 6 17.1
Strongly Disagree 1 0 0
TOTAL 35 100
From the result above, we can see that 10 students (28.5%) chose
option “strongly agree”, 19 students (54.3%) chose option “agree”, 6
students (17.1%) chose option “disagree”, and for option “strongly
4. Students’ Perception on Readability of Textbook
The result of the computation showed that coefficient perception of
students’ perception on readability of “Measurement and Evaluation in
Teaching 6th Edition” textbook was 2.94. It mean that students’
perception on presentation of textbook which mentioned before, belongs to category good.
ST: menggunakan jarak spasi antar kata satu dengan yang lain nya normal (51.4%) chose option “strongly agree”, 17 students (48.6%) chose option
“agree” and for option “disagree”, and “strongly disagree” there was no
4.2) Item Number 16
Table 4.17 Students’ response number 16 ST: banyak menggunakan kosa kata yang
banyak saya ketahui
option “agree”, 10 students (28.6%) chose option “disagree”, 16 students
(45.7%) chose option “strongly disagree”, and for option “strongly
agree” there was no students who chose this option.
4.3) Item Number 17
Table 4.18 Students’ response number 17 ST: menggunakan kalimat yang sederhana dan
From the result above, we can see that no one students chose
option “strongly agree”, 15 students (42.9%) chose option “agree”, 18
students (51.4%) chose option “disagree”, and for option “strongly
disagree” there was 2 students (5.71%) who chose this option.
4.4) Item Number 18
Table 4.19 Students’ response number 18
ST: menggunakan susunan kalimat yang tidak terlalu rapat atau renggang
Choices Scale Frequency %
Strongly Agree 4 7 20
Agree 3 28 80
Disagree 2 0 0
Strongly Disagree 1 0 0
TOTAL 35 100
From the result above, we can see that 7 students (20%) chose
option “strongly agree”, 28 students (80%) chose option “agree”, and for
option “disagree”, and “strongly disagree” there was no students who
4.5) Item Number 19
Table 4.20 Students’ response number 19 ST: menggunakan tanda pemotongan kata
disagree” there was no students who chose this option.
4.6) Item Number 20
Table 4.21 Students’ response number 20 ST: menggunakan huruf yang menarik untuk
From the result above, we can see that 6 students (17.1%) chose
option “strongly agree”, 21 students (60%) chose option “agree”, 8
students (22.9%) chose option “disagree”, and for option “strongly
disagree” there was no students who chose this option.
B. Discussion
There are four points that will be discussed here. The first is the
students’ perception in general, the second is students’ perception on material
of textbook, the third is graphic of textbook, and the fourth readability of textbook.
1. Students’ perception in General
Based on research question was “how is the students’ perception as readers of Gronlund’s textbook?” it was known from
the result that the coefficient perception of students’ perception show
that the students perceived a good perception (scale 2.97) as readers
of “Measurement and Evaluation in Teaching 6th Edition” textbook is
in a good category.
2. Students’ Perception on Material of Textbook
must be considered in textbook, including the learning objectives,
category very good. When the respondents were given a statement number 1 “menurut saya buku ini ilmunya sangat bermanfaat
untuk seorang siswa, terutama calon guru”. It showed that the
coefficient perception number 1 is 3.29, that belongs to category very good. Most of students answered agree (25 students) and
strongly agree (10 students). It means that Gronlud’s textbook is
useful for students at English Department. b) Exercise
Students’ perception of exercise of the textbook belongs to
exercise for readers. Exercise can help them to understand well about the material which in the textbook.
c) Present the material from easy to difficult.
Students’ perception of this indicator belongs to category very
good. When the respondents were given the statement number 3 “menyajikan materi dari yang mudah hingga sukar”. It showed
that the coefficient perception number 3 is 3.14. Most of students answered agree (22 students), and strongly agree (9 students). It belongs to category very good. It mean that most of students agree with the statement, that the textbook are provides the material from easy to difficult.
d) Mention the learning objective
Student’s perception of learning objectives belongs to
category very good. It was taken from the respondents’ answer when they were given a statement in number 4 “menyebutkan
tujuan pembelajaran materi yang akan di pelajari setiap bab”. It
selectively, etc. learning objectives can also be used for
self-evaluation, which may direct the student’s effort (Sessions:2013)
3. Students’ Perception on Graphic of Textbook
Students’ perception on graph of textbook belongs to category
very good. The coefficient perception of students’ perception on graph of textbook was category very good. Textbook graph is a parts of textbook that related with physical books, including a book size, paper type, font size, color, and illustration, which makes the students feel enjoy to read a textbook (BSNP, 2016)
The discussion of aspects in material; those are variation words, the placement element of layout, separation between paragraph, font, pictures, and illustration examples.
a) Variation words
Student’s perception of variation words belongs to category
good. It was taken from the respondents’ answer when they were
b) The placement element of layout
Students’ perception on the placement element of layout
belongs to category good. It was known from the respondents’ answer when they were given a statement in number 6
“menggunakan penempatan unsur tata letak (judul, subjudul,
teks, keterangan gambar, nomor halaman) yang mudah di baca
dan di temukan”. It showed that the coefficient perception
number 6 is 2.97. So it belongs to category good. Most of students answered agree (16 students) and strongly agree (9 students) for this options. In conclusion that, the some students as readers of this textbook feel this book is provide the element of layout, that helped them to search the page number, or read the title of content clearly.
c) Separation between paragraph
Students’ perception on the separation between each
paragraph belongs to category good. It was known from the
respondents’ answer when they were given a statement in number
It can be concluded that, the composition of the text at the end of paragraph, is separated clearly. It can be a distance (in composition text left/right block or the composition of alenia). d) Font
Students’ perception on font of textbook belongs to category
very good. It was known from the respondents’ answer when they were given statement in number 8 “ukuran huruf yang digunakan
pada buku ini sudah baik” and number 9 “jenis huruf pada media
ini terbaca dengan baik”. The coefficient perception number 8 is
2.89 and number 9 is 3.23, the mean coefficient perception both of them is 3.06. So it belongs to category very good. Most of students answered agree and strongly agree. It means that the font in the textbook is readability for students. Based on guiding
category good. It was known from the respondents’ answer when
they were given statement in number 10 “menyajikan gambar
number 11 “gambar yang disajikan sesuai dengan materi yang
disajikan”. The coefficient perception number 10 is 2.89 and
number 11 is 3.23. The mean coefficient perception both of them is 3.04. So it belongs to category very good. Most of students answered agree, and strongly agree. It could be concluded that,
“measurement and evaluation in teaching 6th edition” textbook,
are provide the pictures which appropriate to explain the materials easily.
f) Illustration Examples
Students’ perception on example of textbook belongs to
category very good. It was known from the respondents’ answer
when they were given statement in number 12 “memberikan contoh ilustrasi pada penjelasan materi”, number 13
“menempatkan ilustrasi yang tidak menganggu judul teks, dan
angka halaman” and number 14 “memberikan contoh ilustrasi
yang mampu memperjelas materi”. The coefficient perception
number 12 is 3.23, number 13 is 3.17, and number 14 is 3.11. The mean coefficient perception both of them is 3.17. So it belongs to category very good. Most of students answered agree, and strongly agree. According to Bodmer (in Fang: 1996) illustration
serve to “expand, explain, interpret, or decorate a written text”. It
and evaluation in teaching 6th edition” textbook, are helpful for student to understand the material.
4. Students’ Perception on Readability of Textbook
Students’ perception on readibility of textbook belongs to
category good. The research result showed that the students gave agree responses for this indicator, so that the textbook is good in readability. Klare (in Dubay, 2014) state that readability as “the ease
of understanding or comprehension due to the style of writing”. So the
other hand, readability is what makes some text easier to read than others. It could be concluded that, the readability of “measurement and evaluation in teaching 6th edition” textbook is readable for students.
The discussion of aspects in readability of textbook; those are space, vocabulary, sentence, arrangement paragraph, and hyphenation. a) Space
Students’ perception on space of the each words in that textbook
belongs to category very good. It was known from the
respondents’ answer when they were given a statement in number
15 “menggunakan jarak spasi antar kata satu dengan yang lain
nya normal”. The coefficient perception number 15 is 3.51. So it
space between each word with the others is normal, so students can identify each word.
b) Vocabulary
Students’ perception of vocabulary belongs to category good.
It was known from the respondents’ answer when they were given
a statement in number 16 “menggunakan kosakata yang banyak saya ketahui”. It showed that the coefficient perception number
16 is 1.8. So it belongs to category bad. It could be concluded that, some students have known the vocabulary of the textbook, and partly of them does not know the unfamiliar vocabulary. Vocabulary is central in English, because without vocabulary, students cannot understand or express their own ideas (Elyas and Alfaki: 2014)
c) Sentence
Students’ perception on sentence belongs to category good. It
was known from the respondents’ answer when they were given a
statement in number 17 “menggunakan kalimat yang sederhana
dan mudah dimengerti” and number 18 “menggunakan susunan
kalimat yang tidak terlalu rapat atau renggang”. It showed that
understand the sentences in textbook. Because based on their response, the textbook use the complex sentence.
d) Hyphenation
Students’ perception on arrangement paragraph of textbook
belongs to category good. It was known from the respondents’ answer when they were given a statement in number 19
“menggunakan tanda pemotongan kata (hyphenation) untuk
memperjelas kata yang terpotong”. It showed that the coefficient
perception number 19 is 2.89. So it belongs to category good. It means that students felt helped with the hyphenation to clarify the word which truncated in the sentences.
e) Interest
Students’ perception on interest of textbook belongs to
category good. It was known from the respondents’ answer when
they were given a statement in number 20 “menggunakan huruf
yang menarik untuk dibaca”. It showed that the coefficient
CHAPTER V
CONCLUSION AND SUGGESTION
The last chapter, discusses the two main points. First, the conclusions of the research conducted based on the research question in the first chapter. Second, it reveals some suggestions. Hopefully this conclusion and suggestion can give a contribution in education.
A. Conclusion
Based on research question, how is the students perception on “Measurement and Evaluation in Teaching 6th Edition” textbook
. This study found out that students of sixth semester at English Department, Muhammadiyah University of Purwokerto, had good and positive response about the textbook. It was shown by percentage (54.28%) and scale (2.97). In this research, 30% students as respondents. Therefore, the number of students is 35 students. There were 16 students in good category and 19 students (45.71%) in very good category.
students can read this textbook without any distraction, from the font, size, sentence, and vocabulary they can understand well.
B. Suggestion
The results study indicate positive result. However, there are some
suggestion regarding students’ responses for the statement #16, and #17. In
response to the analysis result, for especially the mentioned statements, the lecture can used the new edition of “Measurement and Evaluation in Teaching 6th Edition” textbook, that not used the old English which make confuse the students to understand. So, students will more understand about the meaning of the words in that textbook.
Rineka Cipta
_________________.(2010). Prosedur Penelitian. Jakarta: Rineka Cipta _________________. (2013). Manajemen Penelitian. Jakarta: Rineka Cipta
Emzir. (2007). Metodologi Penelitian Pendidikan Kuantitatif dan Kualitatif. Jakarta: PT Raja Grafindo Persada.
Clark,Christina;Osborne,Sarah;Akerman,Rodie. (2008) Young People’s Self -Perception as Readers. Thesis. National Literacy Trust
Education Bereau. (2016, August 2). Guiding Principles for Quality textbook.
(website:www.edb.gov.hk/en/curriculum-development/resource-support/textbook-info/GuidingPrinciples/index.html)
Elisa, Irukawa.(2016). 6 Aspek Buku Ajar. (Online) (http://penerbitdeepublish.com/6-aspek-buku-ajar/ accessed on August 2, 2016)
Elyas, Tariq & Alfaki, Ibrahim. (2014). Teaching Vocabulary: The Relationship between Technique of Teaching and Strategies of Learning New Vocabulary Items. English Language Teaching: Canadian Center of Science and Education. (website: dx.doi.org/10.5539/elt.v7n10p40)
Filiatrault, Amanda. (2008).Students’ Perception of Themselves as Readers. Journal of Education. New York: St John Fisher College : Literacy Department
Hadi,S. (2002). Metodologi Research jilid I. Yogyakarta: Andi Offset.
BSNP. (Online) (http://litbang.kemdikbud.go.id/index.php/bsnp accessed on: August 2, 2016)
Kayapinar, Ulas.(2009) Coursebook Evaluation by English Teachers”. Journal of Education. Mersin University. Faculty of Education
Madiri, Sabina. (August 2008). A Study on The Perception and Attitudes of Teacher and Pupils to Thinking Maps. University of Bedfordshire Faculty of Education.
Revision Paris: United Nation Educational, Scientific and Cultural Organization.
Schmitz, Andy. A Primer on Communication Studies. 2012.( Lardbucket.org accessed on 26 March 2016)
Session, Derek. (2013). Advantages of Using Learning Objectives. Courses: University of California (Online).
(cole2.uconline.edu/courses/46295/pages/advantages-of-using-learning-objectives / accessed on 2 August 2016)
Slameto. (2010). Belajar dan Faktor yang mempengaruhi. Jakarta: Rineka Cipta Tarigan, Henry Guntur. (1986) Telaah Buku Teks Bahasa Indonesia. Bandung:
Angkasa
Tarigan, D. (1993). Telaah Buku Teks Bahasa Indonesia. Bandung: Angkasa
Tarigan,D & Tarigan H,G. (2009). Telaah Buku Teks Bahasa Indonesia edisi revisi. Depdikbud UT : Jakarta
Walgito, Bimo. (2004). Pengantar Psikologi Umum. Yogyakarta: Andi Offset
APPENDIX A
PROGRAM STUDI PENDIDIKAN BAHASA INGGRIS UNIVERSITAS MUHAMADIYAH PURWOKERTO
TAHUN AJARAN 2013/2014
I. IDENTITAS MAHASISWA
NIM : _______________
II. PETUNJUK PENGISIAN ANGKET
1. Sebelum mengisi angket ini, bacalah setiap butir pernyataan dengan seksama 2. Jawablah setiap butir pernyataan dengan sejujurnya sesuai dengan saudara alami
dan amati.
3. Untuk item No. 1 – 20 berilah tanda (
×
) pada kolom yang sesuai dengan pendapatsaudara berkaitan dengan buku ajar yang berjudul “Measurement and Teaching
Evaluation sixth edition”
4. Hasil angket ini sama sekali tidak berhubungan / terpengaruh dengan mata pelajaran apapun.
ST : Tidak Setuju 4. menyebutkan tujuan pembelajaran materi yang akan
dipelajari pada awal bab. SS S TS STS
5. menggunakan variasi huruf (tebal, miring, dan kapital) yang dapat membantu saya mempermudah menemukan kata yang penting
SS S TS STS
6. menggunakan penempatan unsur tata letak (judul, subjudul, teks, keterangan gambar, nomor halaman) yang mudah di baca dan di temukan.
SS S TS STS
7. memisahkan antara paragraf satu dengan yang lain
jelas SS S TS STS
8. menggunakan ukuran huruf dapat dibaca dengan
baik. SS S TS STS
9. menggunakan jenis huruf yang dapat terbaca dengan
baik SS S TS STS
10. menyajikan gambar untuk mempermudah materi di
jelaskan pada buku. SS S TS STS
11. menyajikan gambar yang sesuai dengan materi SS S TS STS 12. memberikan contoh ilustrasi pada penjelasan materi SS S TS STS 13. menempatkan ilustrasi yang tidak mengganggu judul,
teks, dan angka halaman SS S TS STS
14. memberikan contoh ilustrasi yang mampu
memperjelas materi SS S TS STS
15. menggunakan jarak spasi antar kata satu dengan yang
lain nya normal SS S TS STS
16. banyak menggunakan kosakatan yang belum saya
ketahui SS S TS STS
17. menggunakan kalimat yang sederhana dan mudah
dimengerti SS S TS STS
18. menggunakan susunan kalimat yang tidak terlalu
rapat atau renggang SS S TS STS
19. menggunakan tanda pemotongan kata (hyphenation)
untuk memperjelas kata yang terpotong SS S TS STS