LAPORAN PENELITIAN
INPUT-OUTPUT ANALYSIS:
AN APPLICATION OF ELECTRICITY DEMAND IN INDONESIA
Oleh:
Maria Praptiningsih, S.E., M.Sc.F.E Yusak Tanoto, S.T., M.Eng.
BUSSINESS MANAGEMENT PROGRAM -ELECTRICAL ENGINEERING DEPARTMENT
PETRA CHRISTIAN UNIVERSITY SURABAYA
Abstract
Energy policy planning is the most important part in macroenomonic analysis. It is very urgent to investigate and analyze how effective the energy planning is. Moreover, as part of energy planning, electricity also becomes the major resources that should be well-analyzed in order to achieve the stability of national economy system. Therefore, it was very important for electric utility to determine dominant sectors which have more impacts on electricity consumption in national economy system.
This study has three objectives. First is determining the input-output table of electricity demand based on the input-output table of national economy. Second is determining the relevancy of electricity demand in various sectors through the electricity consumption chains. Last is determining the dominant sectors imposing great impacts on electricity demand through the electricity demand multiplier . The study will utilized the input output model which is developed by Leontief which is then derived into matrices, inverses, coefficients, and multipliers in order to obtain contribution factors among all sectors in national economy system.
The research stages will be initiated with gathering relevant data during 2011. Model development and variable testing will be carried out subsequently, along with dominant contributor sector establishment. Finally, conclusion and suggestion shall be presented to provide insight into the decision maker in energy sector, particularly in establishing regulation in the power sector.
As the case study, four sectors are selected in order to obtain and analyze their respective EDM towards the electricity demand in Indonesian industrial sector. It is found that the tobacco industry imposes impacts on the electricity demand of the entire industry in Indonesia according to their EDM although the electricity consumption of this sector is not that much. However, the production of this sector requires large scale inputs from other sectors. The products from thesectors consumed more electricity such as paper-paper product-cardboard industry (sector 38), chemicals industry (sector 40) and rubber and plastic industry (sector 42), are absorbed as its inputs by the tobacco industry (sector 34). That leads to the biggest EDM for the tobacco industry, i.e. 1 as compared to other sector. It can be implied that although a certain industrial sector may not consumed large electricity, it can possibly hold the largest EDM since it consumes other industrial sector‟s output, which is in fact require more electricity supply. The dominant sectors with high EDM as shown in EDMtable should be paid more attention to in the development and establishment of electrical policy.
CHAPTER I INTRODUCTION
I.1. Background
In macroeconomic point of view, all resources should meet basic requirements of having the equilibrium between supply and demand. These resources, also called as production factors, are multivariable, nonlinier system and it‟s related to the changes of natural condition. This situation is known as the supply shock. As part of the production factors, power system also to be considered of having impact caused by the supply shock. Electricity supply should meet demand simultaneously in order to ensure the secure operation of power system. Hence, the states and relations between electricity supply and demand are significantly affecting the sustainability of national economy system.
As the electricity is usually consumed during the production in each sector, then it should be followed with the analysis of identifying dominant sectors that imposing great impacts on electricity demand quantitatively and its relations among sectors in economic activities particularly. The relation between electricity demand of individual sectors and electricity consumption of the entire economic system was explored preliminary and the overall electricity demand was determined based on analysis on the dominant sector.
Indonesian sectoral power sector is devided into four major customer segments, namely residential sector, industrial sector, commercial sector, and public sector. As reported by PLN on their 2010 annual report (PLN, 2011), commercial sector rank first with average growth of 10.45% on 2006 – 2010 electricity sales, followed by residential and industrial, with 9.14% and 3.86%, respectively. In 2010, the largest source of the electric power sales revenue still comes from the group of industrial and residential tariffs. In 2010 total revenue from electricity sales increased by 14.20% to Rp 102,974 billion, from Rp 90,712 billion in 2009. This increase was due to the increase of electricity tariff which came into effect on July 1, 2010. Based on this fact, the power sector management and its implications are believed to have strong interrelated between PLN as power sector operator and government as the regulator.
Regarding to the economic growth impact towards power sector development, the electricity consumption growth shall be seen to closely affect by it. The needs of having a clear understanding on how is sectoral electricity consumption trend in Indonesia being affected is unavoidable due to global economic competition. Resources scarcity is one of prominent driving factor that spur efficiency in using resources on power sector. Regarding to this condition, there are at least two implications to follow; firstly, policy on power sector expansion should be made accordingly, by looking into other macro condition so that sectoral electricity growth can be controlled and matched with available resources. Secondly, the needs of mathematical and forecasting accuracy in applying resources (input and output) analysis as part of policy making in energy planning particularly.
I.2. Specific Objectives
The objectives of this study are to obtain several findings on it as follows:
- Determine the input-output table of electricity demand based on the input-output table of national economy in Indonesia during 2011
- Determine the relevancy of electricity demand in various sectors through the electricity consumption chains
- Determine the dominant sectors imposing great impacts on electricity demand through the electricity demand multiplier
I.3. Research Urgency
CHAPTER II LITERATURE REVIEW
II.1. The Input-Output (I-O) Model
Input-output analysis is a method of systematically quantifying the mutual interrelationships among the various sectors of a complex economic system. In practical terms, the economic system to which it is applied may be as large as a nation or even the entire world economy, or as small as the economy of a metropolitan area or even a single enterprise (Leontief, 1986). The structure of each sector‟s production process is represented by an appropriately defined vector of structural coefficients that describes in quantitative terms the relationship between the inputs it absorbs and the output it produces. The interdependence among the sectors of the given economy is described by a set of linear equations expressing the balances between the total input and the aggregate output of each commodity and service produced and used in the course of one or several periods of time.
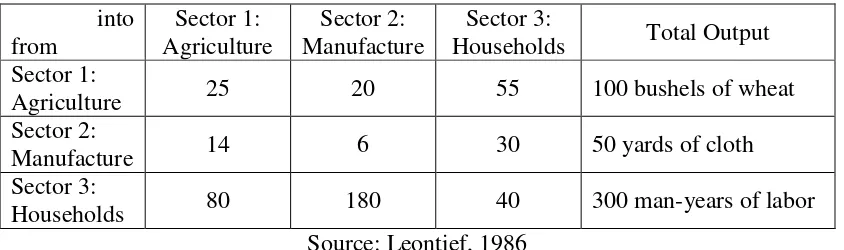
An input-output table describes the flow of goods and services between all the individual sectors of a national economy over a stated period of time, say, a year. A simplified example of an input-output table depicting a three-sector economy is shown in Table 2.1 below:
Table 2.1 Simplified input-output table for a three-sector economy
into from
Sector 1: Agriculture
Sector 2: Manufacture
Sector 3:
Households Total Output Sector 1:
Agriculture 25 20 55 100 bushels of wheat
Sector 2:
Manufacture 14 6 30 50 yards of cloth
Sector 3:
Households 80 180 40 300 man-years of labor
Source: Leontief, 1986
All entries in Table 2.1 are supposed to represent quantities or at least physical indices of the quantities, of spesific goods or services. Although in principle the intersectoral flows as represented in an input-output table can be thought of as being measure in physical units, in practice most input-output tables are constructed in value terms. The in input-output table expressed in value terms can be interpreted as a system of national accounts.
proposed using the column (or row) sums of the input coefficient matrix to calculate backward and forward linkages. However, this measure only captures direct effects and leaving out indirect impacts. Hirschman (1958) suggested that backward linkages effects are related to derived demand, while forward linkages effects are related to output utilization. More recently, linkages analysis methods have again attracted increasing attention from input-output analysts (Cella, 1984; Miller and Blair, 1985; Clements, 1990). However, each has its own advantages and disadvantages. The input-output modeling technique has been extensively used in decomposition analyses of sectoral energy consumption. This is mainly because an input-output table conveniently presents an exact quantitative relationship between the energy sector and its users. Energy input-output analysis is usually used to evaluate the efficiency and environmental impacts of production systems.
However, among all the studies available, there were very few using input-output tables as their sources of data. Instead, data were collected through survey questionnaires. The researchers of this study will only use data from input-output table which is more suitable for national economic planning as the data representing values aggregated at national level. Moreover, this study will utilize the input output table of national economy in order to derive and analyze the input output table of electricity demand. There were several researches that considered the analysis of electricity demand through the derivation of input output model. Salimian et al (2010) utilized the extended price I-O model to simulate the effects of energy price rise on socio-economic subsector's price indices in different scenarios in Iran particularly in electricity demand. Similarly, Allan et al (2007) suggested that the need for careful disaggregation of the electricity generation sector and emphasize the economic distinctiveness of individual generation technologies through I-O analysis. In addition, this paper will utilized the method used of Mu et al (2010) in order to determine the I-O table of electricity demand in Indonesia.
II.1.1 Basic Input-Output System
I-O is a standard method for examining the interrelationships between sectors of the economy and final demand. If certain assumptions are imposed, it provides a powerful tool for examining how changes in the final demand for products can affect the outputs of other sectors within the economy. Although I-O has traditionally been used for economic impact analysis, it has been subsequently extended to energy and environmental areas (Allan et al, 2007). For I-O analysis, the output of each sector of the economy in question is given by an equation relating total output to the demands for that sector‟s goods from both intermediate demand (i.e. other industrial sectors) and final demand. Final demands include, for example, consumption, government expenditure, and exports. Imposing constant returns to scale, a passive supply side, and unchanging technology allows specification of a set of linear equations of the sort:
𝑋1 = 𝑎11𝑋1+𝑎12𝑋2+𝑎13𝑋3+𝑎14𝑋4+⋯+𝑎1𝑛𝑋𝑛 +𝑌1 (1)
𝑋2 =𝑎21𝑋1+𝑎22𝑋2+𝑎23𝑋3+𝑎24𝑋4+⋯+𝑎2𝑛𝑋𝑛 +𝑌2 (2)
where 𝑋𝑖 represents the output of sector i and 𝑎𝑖𝑗 represents the output of sector i that is required to produce one unit of output of sector j. The 𝑎𝑖𝑗 coefficients are calibrated by dividing the value of the relevant intermediate purchases by the value of industry j‟s output. In matrix notation, the IO system can be expressed as:
𝑋=𝐴𝑋+𝑌 (4)
This says that gross output (X) is the sum of all intermediate sales (AX) (used in the production of all other industries‟ outputs) and sales to final demand (Y), which are taken to be exogenous, determined wholly outwith the system. Solving for gross output (X) yields:
𝑋= (𝐼 − 𝐴)−1𝑌 (5)
where I is an identity matrix and the term (𝐼 − 𝐴)−1 is known as the Leontief inverse matrix. The Leontief inverse matrix can be used to examine the extent of interrelationships between sectors within an economy, showing, as it does, the degree to which one sector relies upon the other sectors within an economic space for its inputs. The system described above is the „open‟ Leontief system in which all elements of final demand are considered to be exogenous and therefore are determined entirely outwith the system. The Leontief system can be „closed‟ with respect to households, where the values of the Leontief inverse include not only the direct and indirect purchases necessary to meet changes in final demand, but where induced impacts, arising from endogenous consumption demands being linked to disposable incomes, are also included. A key feature of this system is that consumer expenditures are linked directly to households‟ disposable income, rather than being treated as exogenous as in the „open‟ system. As income rises, this induces households to consume more. These induced impacts reveal the wider effect of the increased incomes of workers in sectors that have experienced increased demand for their outputs (Leontief, 1986; Allan et all, 2007).
II.1.2 The Input-Output (I-O) Multiplier
Rasmussen proposes to use the open (Type 1) Leontief inverse to estimate the direct and indirect backward linkages. These are more commonly referred to as output multipliers in that they show the additional gross output generated across an economy from an additional unit of final demand for an individual sector. They are calculated as the column sums of the Leontief inverse matrix, thus:
𝑂𝑗 = 𝛼𝑖𝑗 𝑛
𝑖=1
(6)
CHAPTER III
RESEARCH METHODOLOGY
This study can be classified into three broad stages, namely: preliminary stage, modeling stage, and reporting stage. Preliminary stage consists of: problem identification, problem definition and research scope, research objective, and literature review. In this regards, problem identification until some part of literature review have been included in this proposal. Modeling stage consists of: data gathering, analysis and result, which will be conducted as the main research work, whereas reporting stage will be covering conclusion, suggestion, and dissemination (report and publication).
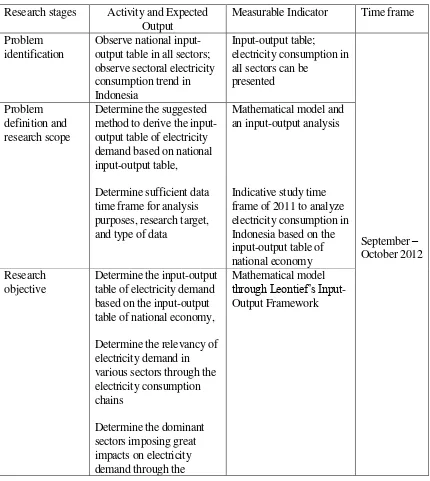
The overall research stages, output, and respective measurable indicator as well as indicative time frame are elaborated in the following table.
Table 3.1 Research stages
Research stages Activity and Expected Output
Measurable Indicator Time frame
Problem identification
Observe national input-output table in all sectors; observe sectoral electricity consumption trend in Indonesia
Input-output table; electricity consumption in all sectors can be
presented
September – October 2012 Problem
definition and research scope
Determine the suggested method to derive the input-output table of electricity demand based on national input-output table,
Determine sufficient data time frame for analysis purposes, research target, and type of data
Mathematical model and an input-output analysis
Indicative study time frame of 2011 to analyze electricity consumption in Indonesia based on the input-output table of national economy Research
objective
Determine the input-output table of electricity demand based on the input-output table of national economy,
Determine the relevancy of electricity demand in various sectors through the electricity consumption chains
Determine the dominant sectors imposing great impacts on electricity demand through the
electricity demand multiplier
Literature review Collect articles and relevant text books that have
appropriate method related to the typical problem, further study regarding to the selected method and analysis.
Articles and textbooks using in this research work
October – November 2012
Data gathering Collect relevant data from PLN and BPS as they will be served as final data
Availability of several data of input-output table in all sectors
December – February 2013 Analysis and
Result
Develop a mathematical model representing the input-output of electricity demand
Analyze the relevancy of electricity demand in various sectors through the electricity consumption chains
Analyze the dominant sectors imposing great impacts on electricity demand through the electricity demand multiplier
A spreadsheet to calculate the input-output table of electricity demand.
A role map to analyze the linkage between primary industry, secondary industry, and tertiary industry
A spredsheet to determine the electricity intensity of total output and the coefficient of direct electricity consumption
March – April 2013
Conclusion and suggestion
Establish conclusion and suggestion which is retrieved from the analysis result/findings. Important findings May 2013 Preparing research report and dissemination
Writing a research report draft and publication draft
Research report, article draft for publication in a journal
June - July 2013
In addition, the analysis and results part are divided into two main steps as shown as follows:
1. Establishing Input-Output Table of Electricity Demand (IOTED) 1.1.Input-Output Table of National Economy (IOTNE)
products of sector i. The balance between the total output and the combined inputs of the product in each sector can be described by the following equation:
𝑥𝑖𝑗+𝑌𝑖 =𝑋𝑖 𝑛
𝑗=1
,𝑖= 1, 2,…,𝑛 (3.1)
1.2 Input-Output Table of Electricity Demand (IOTED)
An IOTED describes the interrelationships of the electricity consumption among various sectors of economic systems. Electricity intensity is one kind of energy intensity, which is the electricity consumption in physical units (Killo Watt Hours/kWh) per monetary unit of GDP. The electricity intensity of total output (EITO) is defined as the electricity consumption in physical units (kWh) per monetary unit of total output in order to reflect all electricity consumption of production. It can be calculated as follows:
𝑔𝑖 =𝐸𝑖 𝑋
𝑋𝑖 , 𝑖= 1, 2,…,𝑛 (3.2)
Where 𝑔𝑖 is the EITO in sector i, 𝑋𝑖 is the total output of sector i, 𝐸𝑖𝑋 is the electricity consumed by sector i
2. Establishing Multiplier Effect of Electricity Demand 2.1 Coefficient of Direct Electricity Consumption (CDEC)
The CDEC from sector i to sector j describes the quantity of the electricty consumed by sector j, which is directly arose from the electricity consumed by sector i, per unit of the total electricity consumption in sector j. It is expressed as follows:
𝑐𝑖𝑗 = 𝐸𝑖𝑗 𝑋
𝐸𝑗𝑋, 𝑖,𝑗= 1, 2,…,𝑛 (3.3)
2.2 Electricity Demand Multiplier (EDM)
The multiplier effect of electricity demand can be measured by EDM. The sum of the uplifts of total electricity consumption in all sectors incurred by one uplift of electricity consumption in sector j called EDM of sector j, which is represented by symbol mj. The bigger the EDM of sector j, the greater the pulling effect on the electricity consumption of all sectors. The sectors with bigger multipliers are identified as dominant sectors.
𝑚𝑗 =
1
𝑞𝑗𝑗 𝑞𝑖𝑗, 𝑛
𝑖=1
CHAPTER IV RESULT AND ANALYSIS
Input-Output Table of Electricity Demand (IOTED) is developed based on Input-Output Table of National Economy (IOTNE) using approaches that was previously mentioned in Chapter 4. The application of IOTED and its results analysis are described in this chapter. The latest 2008 updated Indonesian IOTNE is applied as the primary data source, from which we obtained the value of intermediate input and intermediate product of certain sector that give added value and total input, and respective sector‟s final demand and total output. As we limit our work toward the development of electricity demand in industrial sector, the 2008 Statistic Book of Large and Medium Industry(SBLMI) is used to gather total electricity consumption of each selected sector. Other useful data of which provided by the SBLMI are number of establishments and number off workers by industrial code, electrical produced, purchased, and sold by industry code, input cost by industrial code, value added and value of gross output, and similar data with respect to each province. As the sector numbering in the 2008 Statistical Book of Large and Medium Industry is not the same to that listed in the 2008 updated Indonesian IOTNE, they are grouped and aggregated so that the whole data is eventually match one another. As example, the result of IOTED for 4 industrial sectors are presented and discussed in this chapter.
4.1. Example of IOTED for 4 Industrial Sectors
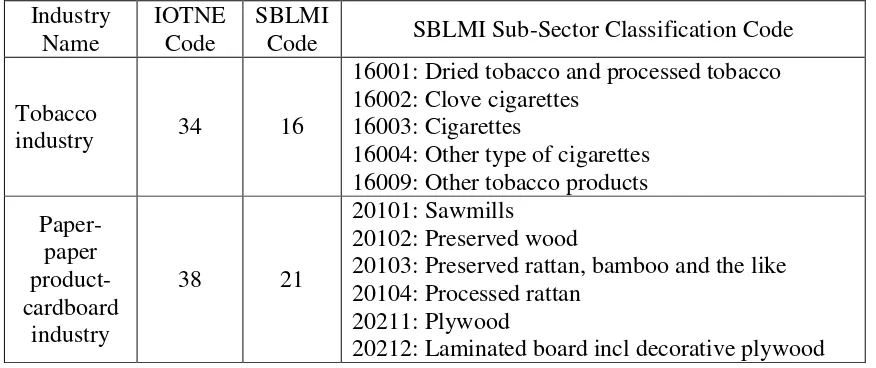
We have selected 4 various industrial sectors which directly or indirectly related to people consumption as well as other industrial requirement, i.e. tobacco industry, paper-paper product-cardboard industry, chemical industry, rubber and plastic industry. As mentioned earlier, the sector‟s classification between IOTNE and SBLMI is not the same since the SBLMI also contain its sub sector classification. The sector number (code) between IOTNE and SBLMI along with their sub sectors is shown in the following table.
Table 4.1. The Sector Number of 4 Selected Industries
Industry Name
IOTNE Code
SBLMI
Code SBLMI Sub-Sector Classification Code
Tobacco
industry 34 16
16001: Dried tobacco and processed tobacco 16002: Clove cigarettes
16003: Cigarettes
16004: Other type of cigarettes 16009: Other tobacco products
Paper-paper product-cardboard
industry
38 21
20101: Sawmills 20102: Preserved wood
20103: Preserved rattan, bamboo and the like 20104: Processed rattan
20211: Plywood
20213: Other wood panels 20214: Veneer
20220: Molding and building components 20230: Woods containers except coffin 20291: Plaits made of rattan and bamboo
20292: Plaits from plants except rattan and bamboo 20293: Wood carving except furniture
20294: Kitchen utensils made of wood, rattan, bamboo
20299: Other goods made of wood, rattan, cork, bamboo
21011: Pulp
21012: Cultural paper 21013: Precious paper 21014: Special paper 21015: Industrial papers 21016: Tissues paper 21019: Paper n.e.c
21020: Boxes made of paper and cardboard 21090: Paper product n.e.c
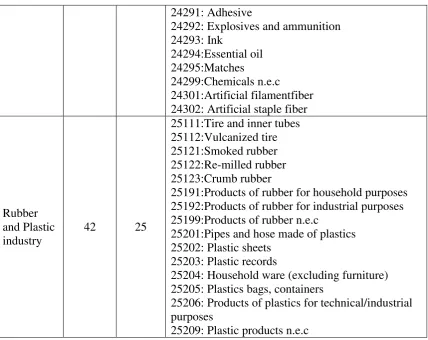
Chemical
industry 40 24
24111: Basic inorganic chemical chloride and alkali 24112: Basic inorganic chemicals industrial gas 24113: Basic inorganic chemicals pigment 24114:Basic inorganic chemicals n.e.c
24115:Basic organic chemical of vegetables/animal origin
24116:Coloring material, coloring and pigment/and pigment
24117:Basic organic chemicals from crude oil, natural gas and coal
24118:Basic organic chemicals resulting special chemicals
24119:Basic chemicals n.e.c
24121:Manufacture natural fertilizer / non synthetic 24122:Straight fertilizers
24123:Mixed, compound and complex fertilizers 24129:Other fertilizers
24131:Synthetic resins 24132:Synthetic rubber
24211:Pesticide s raw materials 24212:Pesticides
24213:Plantation gene rating chemicals 24220:Paints, varnishes and lacquers 24231:Pharmaceutical preparation 24232:Drugs and medicines
24233:Herbal medicine preparation 24234:Herbal medicine
24241:Soap and cleaning preparations, incl tooth paste
24291: Adhesive
24292: Explosives and ammunition 24293: Ink
24294:Essential oil 24295:Matches
24299:Chemicals n.e.c 24301:Artificial filamentfiber 24302: Artificial staple fiber
Rubber and Plastic industry
42 25
25111:Tire and inner tubes 25112:Vulcanized tire 25121:Smoked rubber 25122:Re-milled rubber 25123:Crumb rubber
25191:Products of rubber for household purposes 25192:Products of rubber for industrial purposes 25199:Products of rubber n.e.c
25201:Pipes and hose made of plastics 25202: Plastic sheets
25203: Plastic records
25204: Household ware (excluding furniture) 25205: Plastics bags, containers
25206: Products of plastics for technical/industrial purposes
25209: Plastic products n.e.c
After collecting relevant data as per required, following steps are taken as briefly described below along with their result:
1. Develop IOTNE of 4 selected sectors.
Table 4.2 Input-Output Table of National Economy (IOTNE)
2. Convert IOTNE of 4 selected sectors into IOTED.
Table 4.3 Input-Output Table of Electricity Demand (IOTED)
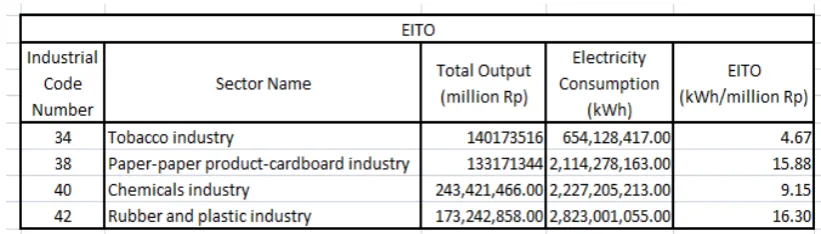
3. Obtained EITO (Electricity Intensity of Total Output).
The IOTNE can be transformed into the IOTED as shown in table aboveaccording to EITO. The electricity intensity of total output (EITO) is defined as the electricity consumption in physical units (Kilo Watt Hours (kWh),for example) per monetary unit of total output in order to reflect all electricity consumption of production. The calculation of EITO is previously described in chapter 2 and 3. The EITO for this case study is shown as;
Table 4.4 Electricity Intensity of Total Output
From the EITO table, we can see that the highest EITO is coming from rubber and plastic industry, closely followed by paper industry.
4. Obtained CEDC (Coefficient of Direct Electricity Consumption)
Table 4.5 Coefficient of Direct Electricity Consumption
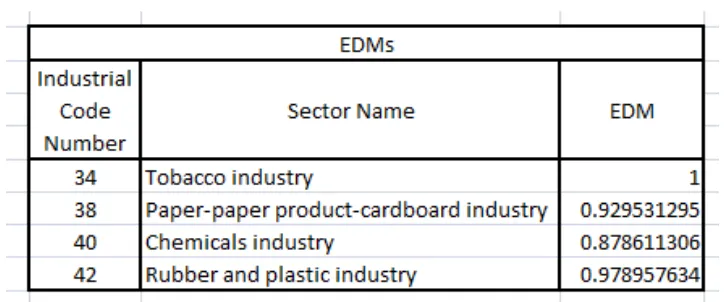
5. Obtained EDM (Electricity Demand Multiplier)
Finally, the EDM of each sector can be achieved as it is measuring the multiplier effect of electricity demand in each industrial sector. The sum of the uplifts of total electricity consumption in allsectors incurred by one unit uplift of electricity consumption insector j is called EDM of sector j, The bigger the EDM of sector j, the greater the pulling effect onthe electricity consumption of all sectors. The sectors with biggermultipliers are identified as dominant sectors. Tiny changes ofelectricity consumption in these sectors may bring significantchanges to the electricity consumption of economy system becauseof their greater multiplier effect of electricity demand. The EDM result of this case study is shown below.
Table 4.6 Electricity Demand Multiplier
CHAPTER V CONCLUSION
The research is focused on the development a tool for converting IOTNE into IOTED and apply the tool to obtain EDM in the Indonesian industrial sector based on the 2008 updated Input Output Table of National Economy and 2008 Large and Medium Scale Industry Statistic. The EDM itself identify dominant sectors which deserve greater attentions on their electricity consumption behavior. Based on this research, of which four industrial sectors has been chosen, the tobacco industry imposes impacts on the electricity demand of the entire industry in Indonesia according to their EDM although the electricity consumption of this sector is not that much.
ACKNOWLEDGEMENT
The authors express their gratitude to the Institute of Research and Community Outreach, Petra Christian University for providing grant to conduct this research under Contract No. 16/Pen-LPPM/UKP/2012. The authors would also delighted to thank to the utility and statistics office for their valuable help in providing relevant data particularly to Badan Pusat Statistik (BPS).
References
Allan., G, et al (2007), “Impact of alternative electricity generation technologies on the Scottish economy: an illustrative input-output analysis”, Journal of Power and Energy, vol. 221, pp. 243-254
Bekhet, H.A., and Abdullah, A., (2010), “Energy Use in Agriculture Sector: Input-Output Analysis”, International Business Research, Canadian Center of Science and Education, vol. 3, no. 3, July 2010
Cella, G. (1984). “The Input-Output Measurement of Interindustry Linkages”, Oxford Bulletin of Economics and Statistics, 46 (1), pp.73-84.
Chenery, H.B. and Watanabe, T. (1958). “International Comparisons of the Structure of Production”, Econometrica, 26 (4), pp. 487-521.
Clements, B.J. (1990) "On the Decomposition and Normalisation of Interindustry Linkages," Economics Letters, 33, pp.337-40
Gonzalez, J.F., “Assesing the macroeconomic impact of water supply restriction through an input-output analysis”, Water Resource Management-Springer Science, vol. 25, pp. 2335-2347
Hirschman, A.O. (1958). Interdependence and Industrialization. The Strategy of Economic Development. Yale University Press, New York.
International Energy Agency, 2011, World Energy Outlook 2011, Oslo-Norway
International Journal of Energy Economics and Policy, vol. 2, no.4, 2012, pp. 250-262
Kurz, H.D, et al (2000), “Input-output analysis”, Economic Systems Research, vol. 12, no. 1
Leontief, W., (1986), Input Output Economics, 2nd edition. New York: Oxford University Press
Miller, R.E., and Blair, P.D. (1985). Input-Output Analysis: Foundations and Extensions. Prentice Hall, New Jersey.
P.T. PLN (Persero) (2011), 2010 PLN Annual report, Jakarta, 2011.
Rasmussen, N.P. (1956). Studies in Inter-Sectoral Relations. Amsterdam, North Holland.
Saari, M.Y., et al (2007), “The impact of world crude oil price changes on the Malaysian economy: an input output analysis”, Malaysian Journal of Economic Studies, vol. 44, no. 1, pp. 1-12
T. Mu, et al, (2010), “Input-output table of electricity demand and its application”, Energy, vol.35, pp. 326-331