LAMPIRAN A
HASIL PARAMETER SIMPLISIA Perhitungan Susut Pengeringan
Replikasi Hasil Susut Pengeringan(%b/b) 1 4,42
LAMPIRAN B
Perhitungan Kadar Sari Larut Etanol Fraksi Etil Asetat Ekstrak Etanol Daun Dewa
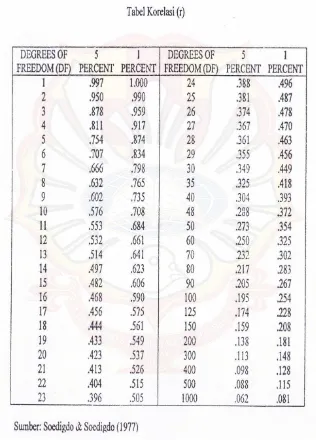
LAMPIRAN C Perhitungan Harga Rf
Keterangan UV Ȝ254 nm UV Ȝ 366 nm
Pembanding (rutin) 3,2/8 = 0,40 (noda 1) 5,7/8 = 0,71 (noda 2)
3,2/8 = 0,40 (noda 1) 5,7/8 = 0,71 (noda 2) Ekstrak etanol daun dewa 3,5/8 = 0,43 (noda 1)
6,8/8 =0,85 (noda 2)
3,5/8 = 0,43 (noda 1) 6,8/8 =0,85 (noda 2) Fraksi etil asetat ekstrak
etanol daun dewa
5,1/8 = 0,64 (noda 1) 6,5/8 = 0,81 (noda 2)
5,1/8 = 0,64 (noda 1) 6,5/8 = 0,81 (noda 2)
pelarut oleh ditempuh yang
jarak
zat oleh ditempuh yang
LAMPIRAN D Cara Perhitungan Dosis
Dosis LC50 = Anti Log Q dari analisis Probit (SPSS) = 96,074
Volume darah tikus =57,5- 69,9 ml/KgBB (Sharp and Regina, 1998) Dosis Tikus = 96,074 × 69,9 ml/Kg
I000 = 6,72 mg/KgBB Volume pemberian = 1ml/100 gr BB
6,72 mg/KgBB = 0,672 mg/100 gBB 10
Volume sediaan = 0,672 mg/100 gBB Terbagi Dalam 3 dosis, yaitu : Dosis atas = 2 × 0,672 mg/100 gBB
= 1,344 mg/100 Gbb = 13,44 mg/KgBB Dosis tengah = 0,672 mg/ 100 gBB = 6,72 mg/KgBB
Dosis bawah = ½ × 0,672 mg/100 gBB
= 0,336 mg/100 gBB = 3,36 mg/KgBB
3,36mg/Kg BB= 2b
LAMPIRAN E
Data Perhitungan SPSS (Koefisien Korelasi dan HSD 5%)
t1 PGA 3% -.06000 .02966 .291 -.1488 .0288 t1 Na Diklo -.02000 .02966 .960 -.1088 .0688 t1 PGA 3% t1 fraksi 1 .08000 .02966 .090 -.0088 .1688 t1 fraksi 2 .06000 .02966 .291 -.0288 .1488 t1 fraksi 3 .06000 .02966 .291 -.0288 .1488 t1 Na Diklo .04000 .02966 .666 -.0488 .1288 t1 Na Diklo t1 fraksi 1 .04000 .02966 .666 -.0488 .1288 t1 fraksi 2 .02000 .02966 .960 -.0688 .1088 t1 fraksi 3 .02000 .02966 .960 -.0688 .1088 t1 PGA 3% -.04000 .02966 .666 -.1288 .0488
Oneway JAM KE-2
ANOVA
Delta_V
Sum of Squares df
Mean
Square F Sig. Between Groups .054 4 .014 2,24 .033 Within Groups .084 20 .004
t3 fraksi 3 .04000 .02530 .525 -.0357 .1157 t3 Na Diklo .10000* .02530 .006 .0243 .1757 t3 Na Diklo t3 fraksi 1 .02000 .02530 .930 -.0557 .0957 t3 fraksi 2 -.06000 .02530 .164 -.1357 .0157 t3 fraksi 3 -.06000 .02530 .164 -.1357 .0157 t3 PGA 3% -.10000* .02530 .006 -.1757 -.0243 *. The mean difference is significant at the 0.05 level.
Oneway JAM KE-4
ANOVA
Delta_V Sum of
Squares df
Mean
Square F Sig. Between Groups
.062 4 .016 15.60
0 .000 Within Groups .020 20 .001
t5 PGA 3% t5 fraksi 1 .12000* .03225 .010 .0235 .2165 t5 fraksi 2 .06000 .03225 .369 -.0365 .1565 t5 fraksi 3 .04000 .03225 .729 -.0565 .1365 t5 Na Diklo .12000* .03225 .010 .0235 .2165 t5 Na Diklo t5 fraksi 1 .00000 .03225 1.000 -.0965 .0965 t5 fraksi 2 -.06000 .03225 .369 -.1565 .0365 t5 fraksi 3 -.08000 .03225 .135 -.1765 .0165 t5 PGA 3% -.12000* .03225 .010 -.2165 -.0235 *. The mean difference is significant at the 0.05 level.
Oneway JAM KE-6
ANOVA
Delta_V Sum of
Squares df
Mean
Square F Sig. Between Groups .090 4 .022 9.333 .000 Within Groups .048 20 .002
LAMPIRAN F
Lampiran H Hasil Skrining Fitokimia
Hasil Skrining Simplisia Daun Dewa
No Senyawa Hasil Pustaka *) Kesimpulan
1 Flavonoid Terbentuk lapisan amil alkohol berwarna
3 Alkaloid Dengan pereaksi dragendorf tidak
5 Kuinon Terbentuk warna cokelat
Warna merah Negatif
6 Sterol Tidak terbentuk warna merah
Warna merah Negatif
*)
LAMPIRAN J
PERHITUNGAN LC 50
Data Information
N of Cases
Valid 3
Rejected Missing 0
LOG Transform Cannot be Done
0
Number of Responses > Number of Subjects
0
Control Group 0
Convergence Information
Number of Iterations
Optimal Solution Found
PROBIT 17 Yes
Parameter Estimates
Parameter Estimate Std.
Error Z Sig.
95% Confidence Interval
Lower Bound
Upper Bound
PROBITa a_concentration 2.170 .415 5.231 .000 1.357 2.984
Parameter Estimates
a. PROBIT model: PROBIT(p) = Intercept + BX (Covariates X are transformed using the base 10,000 logarithm.)
Chi-Square Tests
Chi-Square dfa Sig.
PROBIT Pearson Goodness-of-Fit Test
.585 1 .445b
a. Statistics based on individual cases differ from statistics based on aggregated cases.
b. Since the significance level is greater than ,150, no heterogeneity factor is used in the calculation of confidence limits.
Cell Counts and Residuals
Number a_concentration
Responses Residual Probability
PROBIT 1 1.000 30 1 .676 .324 .023
2 2.000 30 16 16.983 -.983 .566
Confidence Limits
Probabil ity
95% Confidence Limits for a_concentration
.800 204.668 130.188 435.658 2.311 2.115 2.639 .850 251.655 155.356 590.498 2.401 2.191 2.771 .900 326.391 192.563 872.427 2.514 2.285 2.941 .910 347.548 202.612 959.625 2.541 2.307 2.982 .920 372.089 214.046 1064.64
5
2.571 2.331 3.027
.930 401.079 227.273 1193.90 8
2.603 2.357 3.077
.940 436.133 242.907 1357.51 5
2.640 2.385 3.133
.950 479.867 261.921 1572.45 3
2.681 2.418 3.197
.960 536.885 285.992 1869.99 7
2.730 2.456 3.272
.970 616.347 318.386 2315.85 5
2.790 2.503 3.365
.980 740.475 366.780 3080.78 1
2.870 2.564 3.489
.990 988.790 457.454 4840.97 6
2.995 2.660 3.685