Indo. J. Chem., 2007, 7 (1), 93 - 96 93
IDENTIFICATION OF THE ISOLATED COMPOUNDS FROM
Zingiber amaricans BL. RHIZOME
Sugeng Riyanto
Department of Pharmaceutical Chemistry, Faculty of Pharmacy, Gadjah Mada University, Yogyakarta, Indonesia 55281
Received 6 December 2006; Accepted 16 January 2007
ABSTRACT
Five extracts were obtained from extraction of rhizomes of Zingiber amaricans. Hexane, dichloromethane and methanol extracts were obtained by maceration, while dichloromethane and acetone extracts the resulted of soxhlet extraction. By column chromatography technique 2,6,9-humulantrien-9-one (zerumbone) was isolated as the major constituent of the hexane, dichloromethane and methanol extracts. The minor constituents were phytosterol mixtures isolated from hexane and dichloromethane extracts. The mixtures consisted cholesterol, campesterol, stigmasterol and β-sitosterol. The structure elucidations of zerumbone was confirmed by spectroscopic method, whereas the phytosterol mixtures was identified by gas chromatography-mass.
Keywords: zerumbone, phytosterol, zingiber amaricans, spectroscopy
INTRODUCTION
Zingiber amaricans Bl.(Zingiberaceae) is locally known in Central Java as “Lempuyang emprit”. It is distributed throughout Indonesia and resemble with Zingiber zerumbet which is locally named “Lempuyang Gajah”. Both plants are traditionally used as “jamu” and its can substitute each other. The differences between
them are the size each parts of the plant, Zingiber
amaricans is slightly smaller than Zingiber zerumbet and the rhizomes of the former are harder and darker [1]
The juice of the fresh rhizome of Zingiber
amaricans was used as an appetizer [1], and the juice was constituent of beverage “Cabepuyang”. There was
no other publication on Zingiber amaricans but Zingiber
zerumbet continued to become the subject for further investigations.
In 1980, Matthes at al. isolated one new and five
known compounds from Zingiber zerumbet rhizomes {2],
all of which showed cytotoxic activity on neoplasmatic rat liver cells cultured strain. The molecular structure of the new compound was established by spectral data and
chemical evidences as kaempferol-3-α-L-(3”,4”-O
-diacetyl) rhamnopyranoside or 3”,4”-O-diacetyl afzelin.
The known compounds were zerumbone and zerumbone epoxide, whereas diferuloylmethane,
feruloyl-p-coumaroylmethane and di-p
-coumaroyl-methane have not previously been reported in Zingiber
zerumbet, but are known in Curcuma species.
The aqueous extract of Z. zerumbet showed the
bronchodilator effects on isolated tracheal and ileum of Guinea pig and antiinflamatory effect on mice
experiment [3,4]. On the continuing study Asmawi et al.
reported that the water extract of Z. zerumbet showed
the antifertility on the female, Sprague-Dawley rats.
Masuda et al. also studied Z. zerumbet collected
in Ryukyus, Japan [5]. Three new acetylated and one known kaempferol glycosides were isolated from the fresh rhizomes. The molecular structures of the
aglycone were established as 3-O-(2-O-acetyl-α
-L-rhamnopyranoside), 3-O-(3-O-acetyl-α
-L-rhamno-pyranoside), 3-O-(4-O-acetyl-α-L-rhamnopyranoside)
and 3-O-α-L-rhamno-pyranoside .
Zerumbone was also isolated from rhizomes of Z.
zerumbet collected from Thailand by Murakami et al.
[6]. The methanol extract was partitioned with CHCl3,
and the CHCl3 soluble fraction was subjected to silica
gel column chromatography and eluted with EtOAc/n
-hexane mixtures.
This research aim to identify the constituents of Z.
amaricans rhizome because of the compounds content hold the principal role on the foods or beverages safety if the plants are used as their constituents.
EXPERIMENTAL SECTION
Material
Zingiber amaricans was purchased from central market Beringharjo, Yogyakarta, identified in Pharmaceutical Biology Department, University of Gadjah Mada and the voucher specimen was deposited in the herbarium of that department.
Instruments
Melting points were determined on Kohfler melting points apparatus XSP-12 Model 500X equipped with microscope and were uncorrected. Ultraviolet spectra were recorded on Shimadzu UV-VIS 160 in absolute ethanol or methanol. The IR spectra were recorded using KBr mini disc on Perkin Elmer
Indo. J. Chem., 2007, 7 (1), 93 - 96 94
FTIR spectrophotometer model 1725X. Mass spectra were recorded on an AE1-MS 12 spectrometer with ionisation induced by electron impact at 70 eV. Proton Nuclear Magnetic Resonance spectra were recorded on either a JEOL FTNMR (600 MHz) or a Bruker DRX-500 (500 MHz) spectrometer with tetramethylsilane (TMS) as
an internal standard. 13C-Nuclear Magnetic Resonance
spectra with off resonance decoupling and DEPT experiments were determined with either a JEOL FTNMR or a Bruker DRX-500 spectrometer operating at 150 and 125 MHz, respectively. The solvent used was
CDCl3 unless otherwise specified. The
1
H-1H COSY,
NOESY, HMQC and HMBC NMR spectra were obtained with the usual pulse sequences.
Procedure
Chromatography analysis
Vacuum column chromatography was performed
using Silica gel 60 PF254 MERCK 7749 as absorbent.
Length and diameter of column are 40 cm and 8 cm, respectively. The ratio of sample to the stationary phase was 1 part sample to 20 parts of stationary phase. The solvents or the mobile phases used were combination of hexane, petroleum ether, chloroform, dichloromethane, ethyl acetate, acetone, and methanol. Water pump was applied during the elution to absorb the pressure in the receiver flask. The gravity column chromatography was also used to further separate the fractions obtained from vacuum column chromatography. The column was prepared using silica gel 60 (70-230 mesh ASTM), MERCK 7734. The diameter and length of the applied column depend on the weight of sample. Generally, the ratio of sample to silica gel was 1 part of sample to 40 part of silica gel. On the special cases, if the amounts of samples are minimum, silica gel (230-400 mesh ASTM) MERCK 9385 was used.
Thin Layer chromatography (TLC) was used to detect the various components present in crude extract and fractions collected during elution or to examine the impurities of the isolated compounds. TLC plastic sheets
pre-coated with Silica gel 60 F254 (0.2 mm thickness,
20x20 cm) were used.The samples were spotted onto
the proper width of TLC plate using glass capillary tubes and then developed in the chromatographic tank containing saturated solution of the mobile phase. The
spots on the plates were examined under UV lamp at λ
254 and 366 nm or kept in iodine tank. Analytical gas chromatography (GC) were carried out on a Shimadzu model GC-16A gas-chromatograph fitted with CBP-1 capillary column of dimension 30 m x 0.25 mm x 0.25
μm and Helium was used as carrier gas. The GC oven
temperature was programmed from 80-265oC at
3oC/minute with an initial hold 2 minute and final hold 10
minute. GC-MS analyses were performed on the gas chromatograph (Shimadzu GC-17A) coupled to a
Shimadzu GCMS-QP5050 mass spectrometer. A fused silica capillary column BPX-5 ( 30 m x 0.25 mm x 0.25 mm), ionisation induced by electron impact at 70 eV
and ion source temperature of 170oC were applied.
Extraction and Fractionation of Extract of Rhizomes of Zingiber amaricans
The fresh rhizomes was sliced thinly, dried at the room temperature and ground into powdered form. The sample (1.5 kg) was subsequently extracted with hexane, dichloromethane and methanol. Follow-up procedures gave corresponding hexane extract (33.1 g), dichloromethane extract (32.4 g) and methanol extract (43.3 g). Another portion of the sample (1.1 kg) was extracted using Soxhlet apparatus. The solvent used was dichloromethane, which was followed by acetone. The extractions produced 64.8 g and 6.3 g of extracts, respectively.
Isolation and Spectroscopic Analysis of Compounds from Hexane Extract
The hexane extract (5 g) was fractionated using vacuum column chromatography from which collected 35 fractions. Fractions 10-12 were combined to give
residue which then afforded compound A (2.5 g) while
fractions 26-27 give phytosterol mixtures (65 mg). Follow-up procedure on dichloromethane and methanol
extract also resulted compound A, together with some
oily mixtures and unidentified in organic compound. Similar fractionation on dichloromethane fraction obtained from Soxhlet apparatus extraction afforded
only compound A and phytosterol mixtures. In contrast,
further work on acetone extract did not lead to identification of any compounds.
RESULT AND DISCUSSION
Compound A appeared as colourless crystals
with melting point 60-62oC. Infrared spectrum showed
peak at 3025 cm-1 indicating the olefinic C-H stretching,
and peaks at 2964, 2924 and 2864 cm-1 correspond to
aliphatic C-H. A strong peak at 1653 cm-1 attributed to
C=O group, while weak peaks at 1456 and 1264 cm-1
were signal of C=C group and C-O bond, respectively. The mass spectrum showed molecular ion at m/z 218 which corresponds to the molecular formula of
C15H22O.
1
H-NMR spectrum showed four singlets each
integrated to three protons at δ 1.07, 1.20, 1.54 and δ
1.80 attributed to the four methyl groups, of which two groups attached to C-3 and C-7, while other two groups
attached to C-11. The two doublets (J = 16.4 Hz)
observed at δ 1.90 and 2.35 were due to two
nonequivalent protons of H-1, while methylene protons
of H-4 and H-5 exhibited multiplets around δ 2.19-2.36.
A doublet of doublet (J=16.4, 4.0 Hz) at δ 5.25 was due
to the signal of H-2, which coupled to nonequivalent
Indo. J. Chem., 2007, 7 (1), 93 - 96 95
O H
B
O H
C
15 14
12
O
1 2 3
4 5 6 7
8 9 10
11 13
A
O H D
O H E
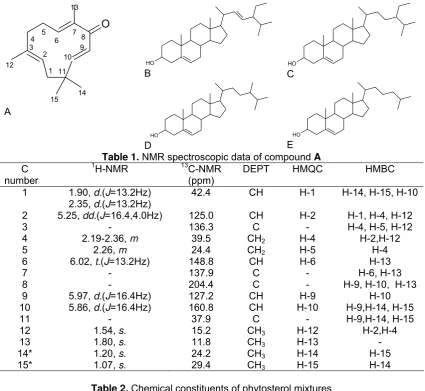
Table 1. NMR spectroscopic data of compound A
C 1H-NMR 13C-NMR DEPT HMQC HMBC
number (ppm)
1 1.90, d.(J=13.2Hz) 42.4 CH H-1 H-14, H-15, H-10
2.35, d.(J=13.2Hz)
2 5.25, dd.(J=16.4,4.0Hz) 125.0 CH H-2 H-1, H-4, H-12
3 - 136.3 C - H-4, H-5, H-12
4 2.19-2.36, m 39.5 CH2 H-4 H-2,H-12
5 2.26, m 24.4 CH2 H-5 H-4
6 6.02, t.(J=13.2Hz) 148.8 CH H-6 H-13
7 - 137.9 C - H-6, H-13
8 - 204.4 C - H-9, H-10, H-13
9 5.97, d.(J=16.4Hz) 127.2 CH H-9 H-10
10 5.86, d.(J=16.4Hz) 160.8 CH H-10 H-9,H-14, H-15
11 - 37.9 C - H-9,H-14, H-15
12 1.54, s. 15.2 CH3 H-12 H-2,H-4
13 1.80, s. 11.8 CH3 H-13 -
14* 1.20, s. 24.2 CH3 H-14 H-15
15* 1.07, s. 29.4 CH3 H-15 H-14
Table 2. Chemical constituents of phytosterol mixtures
Number Retention Molecular Molecular Composition Compound
peaks Time (min) Weight Formula (%)
1 23.74 386 C27H46O 1.12 Cholesterol (E)
2 25.64 400 C28H48O 12.38 Campesterol (D)
3 26.47 412 C29H48O 30.16 Stigmasterol (B)
4 27.98 414 C29H50O 56.28 β-Sitosterol (C)
two protons of H-1. The triplet (J=13.2 Hz) observed at
δ 6.02 was due to H-6 which overlapped with doublet
(J=16.4 Hz) at δ 5.97 attributed to H-9 and the later
correlated with H-10 to give another doublet (J=16.4 Hz)
at δ 5.87.
13
C-NMR spectrum (BCM) exhibited fifteen signals for each of fifteen carbons present in the molecule. The DEPT spectrum showed that four methine carbons
appeared at124.9, 127.2, 148.8 ppm and 160.7 ppm.
HMQC spectrum confirmed the assignments of 1H and
13
C-NMR data. The spectrum revealed that resonances
for H-1 protons at δ 2.35 and 1.90 correlated with carbon
signal for C-1 (δ 42.4). The signal of methylene protons
of H-4 and H-5 (δ 2.20-2.50) showed correlation with
carbon signals at δ 39.5 (C-4) and 24.4 (C-5). The
crosspeaks were also shown by signals of methyl protons of C-13, C-12, C-14 and C-15 with their respective carbon signals.
Some of the long-range C-H correlations of the compound are displayed by HMBC spectrum. The positions of the methyl groups were confirmed by
correlations of methyl proton signal at δ 1.54 (C-12)
with carbon signal at δ 136.3 (C-3), methyl proton
signal at δ 1.80 (C-13) with carbon signal at δ 137.9
(C-7), and methyl proton signal at δ 1.20/1.07 (C-14/C-15)
with carbon signal at δ 37.9 (C-11). The presence of
carbonyl group was also confirmed by correlation of
carbon peak at δ 204.4 (C-8) with proton signals at δ
Indo. J. Chem., 2007, 7 (1), 93 - 96 96
5.97 (H-9) and 1.80 (13-CH3). The protons signal at
around δ 2.19-2.36 (H-4) showed crosspeaks with
carbon signals at δ 24.4 (C-5), δ 136.3 (C-3), δ 15.2
(C-12), and δ 125.0 (C-2), while proton signal at δ 2.35
(H-1) showed correlation with carbon signals at δ 125.0
(C-2) and δ 136.3 (C-3). Other HMBC correlations and other
NMR data are summarized in Table 1.
Based on the spectroscopic data obtained and comparison to the data reported previously [2],
compound A was elucidated as 2,6,9-humulatrien-8-one
(zerumbone). The mass fragmentation pattern of the compound supported the assignment of the sesquiterpene.
The phytosterol mixtures was washed with acetone and followed by recrystallization using hexane to give
needles shape crystals with melting point of 138-140 oC.
GC – MS analysis showed that the substance consisted four component. The major components were
stigmasterol (B)(30.16%), β-sitosterol (C) (56.28%),
campesterol (D) (12.38%) and cholesterol(E) (1.12%).
Their retention time were obtained from the chromatogram and their structures were identified based on the similarities of their mass spectra patterns with the library data in the GC-MS system. The results of GC-MS
analysis are listed in Table 2. β-sitosterol (C); mass
spectrum m/z (% intensity) : 412(M+, 81), 400(25),
396(20), 369(18), 351(20), 314(28), 300(45), 271(60), 255(65), 231(18), 213(36), 163(31), 159(51), 145(55),
107(58), 81(80), 55(100). Stigmasterol (B); mass
spectrum m/z (% intensity): 412(M+, 81), 400(25),
396(20), 369(18), 351(20), 314(28), 300(45), 271(60), 255(65), 231(18), 213(36), 163(31), 159(51), 145(55),
107(58), 81(80), 55(100). Campesterol (D); mass
spectrum m/z (% intensity) : 400(M+,53 ), 382 (26), 367
(23), 315 (47 ), 289 (48 ), 273 (27 ), 255 (33), 231 (31), 213 (60), 173 ( 33), 159 (63),145 (84), 133 (53), 119
(64), 105 (98), 91 (86), 81 (82), 55(100). Cholesterol (E);
mass spectrum m/z (% intensity) : 386 (M+,47), 368 (23),
353 (22) , 301 (46), 275 (59), 255 (29), 231 (23), 213 (47), 159 (59), 145 (81), 119 (64) , 105 (97), 91 (91), 55 (100).
CONCLUSION
The major constituent of Z. amaricans rhizome
was 2,6,9-humulatrien-8-one (zerumbone), and the minor constituent was a mixture of phytosterol
consisted β-sitosterol, cholesterol, campesterol and
stigmasterol.
ACKNOWLEDGEMENT
I would like to express my appreciation to Ass Prof. Mohd Aspollah Sukari and Prof. Mawardi Rahmani as the supervisors when I studied at the Faculty of Science and Environmental Studies, University Putra Malaysia.
REFFERENCES
1. Heyne,K. 1987, Tumbuhan Berguna Indonesia,
Jilid I, Badan Litbang Kehutanan, Jakarta.
2. Matthes, H.W.D., Luu, B. and Ourisson, G., 1980, Phytochem., 19, 2643-2650.
3. Asmawi, M.Z., Sadikun, A., Jiu, L.L., and Rahman,
A.A. 1987, The Bronchodilator and Antiinflamatory
effects of Zingiber zerumbet (Lo.) Sm Rhizome,
eds. Mohd. Shohimi Mustapha, Proceeding, of
Seventh Annual Scientific Meeting of Maspet, 12-13 June 1987
4. Asmawi, M.Z. and Pauzi, M.A. 1989. Antifertility
effect of Lempuyang Gajah (Zingiber zerumbet Lo.), Eight Scientific Meeting of the Malaysian Society of Pharmacology and Physiology 21-22th July 1989,p 26. Kualalumpur.
5. Masuda, T., Jitoe, A., Kato, S. and Nakatani, N.
1991, Phytochem. 30(7), 2391-2392.
6. Murakami, A., Takahashi, M., Jiwajinda, S.,
Koshimizu, K., and Ohigashi, H. 1999, Biosci.
Biotechnol. Biochem, 63 (10),1811-1812.