ISSN (print): 1978-1520, ISSN (online): 2460-7258
DOI: 10.22146/ijccs.27871 53
Adaptive Unified Differential Evolution for Clustering
Maulida Ayu Fitriani*1, Aina Musdholifah2, Sri Hartati3 1
Magister of Computer Science FMIPA UGM, Yogyakarta, Indonesia 2,3
Department of Computer Science and Electronics, FMIPA UGM, Yogyakarta, Indonesia e-mail: *[email protected], [email protected], 3 [email protected]
Abstrak
Berbagai metode clustering untuk memperoleh informasi optimal terus berkembang salah satu perkembangannya adalah Evolutionary Algorithm (EA). Adaptive Unified Differential Evolution (AuDE), adalah pengembangan dari Differential Evolution (DE) yang merupakan salah satu teknik EA. AuDE memiliki parameter kontrol faktor skala (F) dan crossover rate (Cr) self-adaptive. Juga memiliki single strategi mutasi yang mewakili dari strategi-strategi mutasi standar yang sering digunakan dari penelitian-penelitian sebelumnya.
Metode clustering AuDE diuji menggunakan 4 dataset. Silhouette Index dan CS Measure merupakan fungsi fitness yang digunakan sebagai alat ukur kualitas hasil clustering. Kualitas hasil clustering AuDE kemudian dibandingkan terhadap kualitas hasil clustering menggunakan metode DE.
Hasil penelitian menunjukkan bahwa strategi mutasi AuDE dapat memperluas pencarian pusat cluster yang dihasilkan oleh DE sehingga dapat diperoleh kualitas hasil clustering yang lebih baik. Perbandingan kualitas dari AuDE dan DE menggunakan Silhoutte Index menujukan 1 : 0.816, sedangkan pada penggunaan CS Measure menunjukan perbandingan 0.565 : 1. Waktu eksekusi yang dibutuhkan AuDE menunjukan hasil yang lebih baik namun tidak signifikan, ditujukan dengan perbandingan pada penggunaan Silhoutte Index yaitu 0.99:1, sedangkan pada penggunaan CS Measure didapatkan hasil perbandingan 0.184 : 1.
Kata kunci— AuDE, DE, Clustering
Abstract
Various clustering methods to obtain optimal information continues to evolve one of its development is Evolutionary Algorithm (EA). Adaptive Unified Differential Evolution (AuDE), is the development of Differential Evolution (DE) which is one of the EA techniques. AuDE has self adaptive scale factor control parameters (F) and crossover -rate (Cr).. It also has a single mutation strategy that represents the most commonly used standard mutation strategies from previous studies.
The AuDE clustering method was tested using 4 datasets. Silhouette Index and CS Measure is a fitness function used as a measure of the quality of clustering results. The quality of the AuDE clustering results is then compared against the quality of clustering results using the DE method.
The results show that the AuDE mutation strategy can expand the cluster central search produced by ED so that better clustering quality can be obtained. The comparison of the quality of AuDE and DE using Silhoutte Index is 1:0.816, whereas the use of CS Measure shows a comparison of 0.565:1. The execution time required AuDE shows better but Number significant results, aimed at the comparison of Silhoutte Index usage of 0.99:1 , Whereas on the use of CS Measure obtained the comparison of 0.184:1.
1. INTRODUCTION
Clustering as one of the popular pattern recognition techniques and has been used in various fields, such as web mining, machine learning, image segmentation, biometric recognition, electrical engineering, mechanical engineering, remote sensing, and genetics [1].
Various clustering methods to obtain optimal information continue to grow with the rapidity of science. One such development is the Evolutionary Algorithm (EA). EA is part of the Evolutionary Computation in Artificial Intelligence that mimics the evolutionary biology of living things. There are several algorithms included in the Evolutionary Algorithm, including Genetic Algorithm (GA), Genetic Programming (GP), Evolutionary Strategies (ES), Differential Evolution (DE), Evolutionary Programming (EP), and Grammatical Evolution (GE). Data clustering studies like [2] and [3] use DE as the main method.
In 1995 Storm and Price introduced DE as one of the techniques of Evolutionary Computation. The DE population encoding uses real numbers and has been widely applied to solve optimization problems e.g. in data clustering, digital filter design, linear function optimization, and multi-objective optimization [4].
DE has parameters that greatly affect its own performance. Determining the right combination of parameter values in the DE is not easy because it takes careful observation and also depends on the issues to be solved. Therefore some researchers like [5], [6], and [7] developed parameter tuning models automatically to overcome manual parameter tuning weaknesses. In addition to the control parameters that greatly affect performance, DE also relies heavily on its mutation strategy [8]. When DE is used to solve the optimization problem, the first must be determined is the mutation strategy, then determined the control parameters of the DE by the procedure of trial and error. The selection of appropriate mutation strategies and parameter values with these trial and error procedures often takes a great deal of time, the problem being the initial ideas of developing new DE variations with self adaptive parameters.
In 2016 Qiang and Mitchel introduced Adaptive Unified Differential Evolution (AuDE). AuDE has a scale factor control parameter (F) and a self-adaptive crossover rate (Cr). AuDE also has a single mutation strategy from some combination of mutation strategy expressions that are representative of commonly used standard mutation strategies from previous studies [9].
In this study AuDE is used for clustering. The application of AuDE in clustering begins with a chromosome initialization process containing the centroid. Each chromosome contained the activation threshold to be used as an active determinant of whether or not a centroid. The initialization process of forming a chromosome population which underwent the process of updating the population through mutation, crossover and selection to get the population of chromosomes that will be used in the next generation. In the AuDE, there is a new generation of scaling factor parameter values (F) and crossover rate (Cr) self-adaptive in mutation and crossover processes so that users do not need to select the appropriate control parameters.
2. METHODS
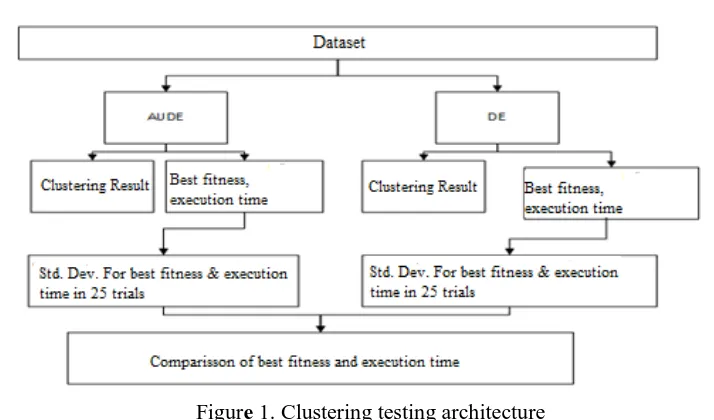
Figure 1. Clustering testing architecture
Figure 1 is a clustering testing architecture using AuDE and DE. The quality of clustering results and execution time is obtained from clustering testing of 25 experiments for each dataset with different methods and fitness functions.
2.1 Testing Data
Table 1 is a breakdown of the amount of data, attributes, and classes on each dataset used to test the clustering results.
Table 1 Details of the tested dataset (UCI Machine Learning Repository)
Dataset Number of
Data
Number of Attributes
Number of Classes
Iris 150 4 3
Wine 178 13 3
Glass 214 9 7
Ecoli 336 7 8
The dataset used to compare the clustering results of AuDE and DE is the Iris dataset, Wine, Glass, Ecoli from the UCI Machine Learning Repository (URL: http://archive.ics.uci.edu/ml/) [10].
2.2 Adaptive Unified Differential Evolution (AuDE)
AuDE is a development algorithm of Differential Evolution (DE) proposed by Qiang and Mitchell in 2016. DE belongs to the population-based metaheuristic category. The basic idea of ED is to take advantage of individual differences within the population to perform a search for solutions. DE is an algorithm included in the Evolutionary Algorithm (EA) group.
The development of the AuDE algorithm lies in the control parameters used during the mutation and crossover process, in addition the AuDE mutation strategy also gains development.
2.2.1 Initialization Population
population it can be written with .
a control parameter scale factor worth positive natural number between [0,1] that are used during the process of mutation to control the evolution of the population. Cr is a parameter of the control parameter value between the positive natural numbers [0,1] are used to determine the inheritance of genes possessed by the target vector and mutant vectors in formation trial vector by comparing it with the random number generated at the crossover process , in other words Cr controls the crossover process.
2.2.2 Mutation Process
Mutation is the process of mutant vector formation. Before the process of forming the mutant vector, the four parameters of the new scale factor control Fj with j = 1, 2, 3, 4 in generation (G + 1) are searched using Equation 1. While the mutant vector formation is done by using Equation 2.
... (1)
(2) ... (2)
In Equation 2, is the i-th mutant vector, is the i-th destination vector, is the best vector among the population NP, and , , , , are random vectors of the population NP.
2.2.3 Crossover Process
The crossover process between the mutant vector and the target vector is done to improve the diversity of potential new solutions. Prospective new solutions formed from these two vectors are called trial vector . The component of the trial vector is generated from the mutant vector or the target vector depending on the value of the crossover rate control parameter (Cr). Equation 4 is a crossover scheme used in AuDE. Before performing the crossover process, carried out searches crossover rate control parameter in the generation of new Cr (G + 1) using Equation 3.
... (3)
... (4)
In Equation 4, is the i-th trial vector, is a random value between [0, 1], and is the randomly selected element of the target vector target .
2.2.4 Selection Process
target vector or the new chromosome in the next generation. Conversely, if the fitness value of the trial vector is no better, then will still be used as a chromosome in the next generation. The rule can be written in Equation 5 as follows:
... (5)
In Equation 5, is the i-th destination vector for the next generation, is the fitness value of the i-th trial vector and is the value fitness i-th target vector.
2.3 Silhouette Index
In Equation 6, Si is the Silhoutte Index of the i data or silhoutte width, is the average distance of the i data with the other data in the same cluster, whereas is the average distance between the i data and the data in different clusters [11]. and can be calculated using Equation 7 and Equation 8, representing the distance between the i-th and j-th data while and represent the number of i-th cluster data and the k-cluster
... (6)
... (7)
... (8) After obtaining the silhoutte width for each data, the calculation of the Silhoutte Index (SC) value is done as a whole by summing all Si values then divided by the amount of data (n) or can be seen in Equation 9. SC values are in the range [-1, 1 ] where -1 shows the result of bad clustering, 0 indicates indifferent, and 1 shows good.
... (9)
2.4 CS Measure
CS Measure is one of the simplest index tools that can put more centroid into areas with low data density. Before CS Measure was applied, the centroid was derived from the average data point used in the clustering. The distance between the 2 data points Xi and Xj in Source with d (Xi, Xj) CS Measure is defined as in Equation 10.
... (10)
2.5 Similarity Measure
The Euclidean distance between X and Y is defined as Equation 11.
... (11) In Equation 11 Xk and Yk are the values of x and y in the k-th attribute. Determination of cluster membership is done by allocating data into cluster members where the data distance to the cluster center point is the shortest [13].
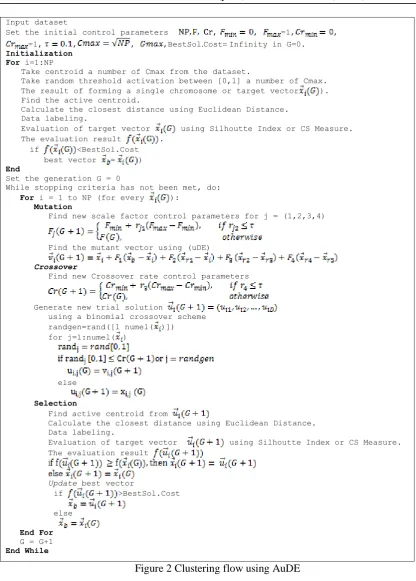
2.6 Clustering Flow Using AuDE
Set the initial control parameters , , =1, ,
=1, , , ,BestSol.Cost= Infinity in G=0. Initialization
For i=1:NP
Take centroid a number of Cmax from the dataset.
Take random threshold activation between [0,1] a number of Cmax. The result of forming a single chromosome or target vector ). Find the active centroid.
Calculate the closest distance using Euclidean Distance. Data labeling.
Evaluation of target vector using Silhoutte Index or CS Measure. The evaluation result .
if <BestSol.Cost best vector = ) End
Set the generation G = 0
While stopping criteria has not been met, do: For i = 1 to NP (for every ):
Mutation
Find new scale factor control parameters for j = (1,2,3,4)
Find the mutant vector using (uDE)
Calculate the closest distance using Euclidean Distance. Data labeling.
Evaluation of target vector using Silhoutte Index or CS Measure. The evaluation result
The active centroid of each i-target vector is obtained by using rule Figure 3. IF activation threshold > 0.5 THEN centroid ACTIVE, ELSE centroid INACTIVE
Figure 3 The centroid activation rule
Figure 3 is a centroid activation rule. Centroid is declared active when threshold
3. RESULT AND DISCUSSION
3.1 Comparison of Number of Final Clusters
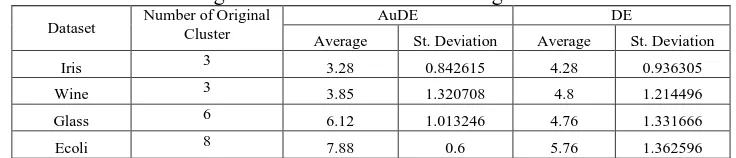
Table 2 is the average number of clusters end results of 25 trials using Silhouette Index. On testing Aude use Silhouette Index, Ecoli dataset has average number of clusters end results and the standard deviation of the best among the four datasets are 7.88 and 0.6. While dataset Wine has the average number of clusters end result and the worst standard deviation is 3.85 and 1.3.
Reviewed DE testing using Silhouette Index, Iris dataset has the average number of clusters end results and the standard deviation of the best among the four datasets are 4.28 and 0.93. While E. coli dataset has the average number of clusters end result and the worst standard deviation is 5.76 and 1.36. Standard deviation can have great value due to the result of the number of clusters in 25 trials had variations in results with a range of great value.
Table 2 Average number of final clusters using Silhouette Index
Dataset Number of Original Cluster AuDE DE
Average St. Deviation Average St. Deviation
Iris 3 3.28 0.842615 4.28 0.936305
Wine 3 3.85 1.320708 4.8 1.214496
Glass 6 6.12 1.013246 4.76 1.331666
Ecoli 8 7.88 0.6 5.76 1.362596
Table 3 is an average number of 25 trial times the final cluster uses CS Measure. In the AuDE test using CS Measure, Glass dataset has average number of final clusters and the standard deviation of the best among the four datasets, which is 6 and 1. While dataset Wine has average number of final clusters and the standard deviation which is 5.1 and 2,66.
Table 3 Average number of final clusters using CS Measure
Dataset Original
Class
AuDE DE
Average St. Deviation Average St. Deviation
Iris 3 3.52 1.530795 3.36 0.907377
Wine 3 5.1 2.66966 4.95 0.950055
Glass 6 6 1 3.96 1.171893
Ecoli 8 6.88 1.536229 4.96 1.536229
Table 3 is the result of DE using CS Measure, Iris dataset has the best average number of final clusters and the standard deviation among the four datasets which is 3.36 and 0.91. While Ecoli dataset has average number of final clusters and the worst standard deviation which is 4.96 and 1.53.
3.2 Comparison of Clustering Results Quality
Comparison of cluster quality using Silhoutte Index from clustering result by using AuDE and DE method can be seen in Table 4.
Table 4 Comparison of cluster quality using Silhouette Index
Dataset AuDE DE
Iris 0.715359 0.702683
Wine 0.735226 0.714945
Glass 0.582457 0.375623
Ecoli 0.502398 0.440565
Silhouette Index has a value range [-1 1], the resulting clusters would be well worth it if the validity of close to 1, and will be worth bad if close to -1. The clustering results in Table 4 using Silhouette Index shows Aude has validity better value in all the tested dataset compared with the use DE methods, but the methods of DE also generate good validity in the dataset Iris and Wine.
Tabel 5 Perbandingan validitas cluster menggunakan CS Measure
Dataset AuDE DE
Glass 0.315147 2.706308
Ecoli 1.487058 2.164753
Comparison of CS Measure of clustering results by using Aude and DE can be seen in Table 5. The results of the cluster using the CS Measure will be well worth it if the validity value close to 0, and would be worth worse if the value generated even greater. The clustering results using the CS Measure cluster validity show that the AuDE method has better validity on all tested datasets than the DE method, but the AuDE method also has poor validity on the Iris, Wine and Ecoli datasets because they have sufficient CS measures which is 0.78, 0.86, and 1.48.
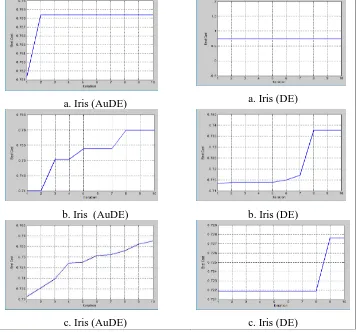
3.3 Comparison of Cluster Quality Changes
Figure 4 is a comparison graph of changes in cluster quality values or fitness values for each generation in AuDE and DE using the Silhoutte Index cluster quality gauge. Based on Figure 4 it can be analyzed that on the use of the Silhouette Index the change in the rate of fitness in AuDE has increased in the next generation. Increased fitness values in AuDE occur because of the search for adaptive control parameters and mutation strategies that can perform wider searches.
The use of the Silhouette Index in DE, most of the 25 trials of each dataset, results in a fitness value that does not change significantly for each generation. This occurs because of the search for control parameters on static DE and simple mutation strategies owned by ED so that the results in updating chromosomes mutation process is less varied.
a. Iris (AuDE) a. Iris (DE)
b. Iris (AuDE) b. Iris (DE)
c. Iris (AuDE) c. Iris (DE)
Figure 4 Comparison of cluster quality change graphs or fitness values
3.4. Comparison of Execution Time
Glass and Ecoli require longer execution time in AuDE compared to the time of execution on DE. This is because AuDE takes time to look for new scale factor parameters in the mutation process and new crossover rate parameters in crossover process adaptively.
Tabel 6 Waktu eksekusi menggunakan Silhoutte Index
Dataset Silhoutte
AuDE DE
Iris 7.124031 8.686344
Wine 26.19617 23.58887
Glass 21.32109 21.2569
Ecoli 27.04355 26.19172
Besides finding a new control parameters, Aude also takes time to get five random vectors and have a longer mutation strategy. The execution time in the clustering testing process using AuDE and DE is greatly influenced by the size of the population and the number of generations.
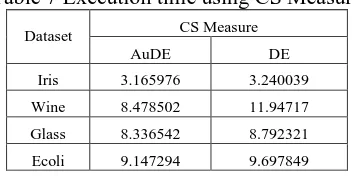
Table 7 Execution time using CS Measure
Dataset CS Measure
AuDE DE
Iris 3.165976 3.240039
Wine 8.478502 11.94717
Glass 8.336542 8.792321
Ecoli 9.147294 9.697849
The required execution time using CS Measure in AuDE and DE also shows the result difference is not too large. By Table 7, execution time using CS Measure validity takes more time on DE testing, with the most time difference occurring in the Wine dataset.
4. CONCLUSIONS
Based on the data used in this study can be concluded the quality of the clustering using a measuring instrument Silhouette Index show that the clustering results generated by Aude better with a ratio of 1: 0816 compared to classical DE. The quality of clustering results using a measuring instrument CS Measure indicate that the clustering results generated by Aude better with a ratio of 0565: 1 compared to DE.
Execution time using Silhouette Index in AuDE shows the execution time is almost equal to DE, can be seen from the comparison of execution time AuDE with DE is 0.99: 1. While the execution time using CS Measure, AuDE and DE has a ratio of 0.82: 1.
ACKNOWLEDGEMENTS
Suggestions that can be given for further research, especially those using the AuDE method of clustering methods are exploring the fitness function that minimizes computation with better results from Silhoutte Index and CS Measure.
REFERENCES
2017.
[2] Kuo, R.J., Syu, Y.J., Chen, Z.-Y., and Tien, F.C., 2012, Integration of Particle Swarm Optimization and Genetic Algorithm for Dynamic Clustering, Information
Sciences, 195(0): 124-140,
:http://www.sciencedirect.com/science/article/pii/S0020025512000400, accessed on
August 12, 2017.
[3] Kuo, R. J., Suryani, E., and Yasid, A., 2013, Automatic Clustering Combining Differential Evolution Algorithmand k-Means Algorithm, Proceedings of the Institute of
Industrial Engineers Asian Conference Springer Science. Singapore,
:https://link.springer.com/content/pdf/10.1007%2F978-981-4451-98-7_143.pdf, accessed
on August 12, 2017.
[4] K. Prince, R. Storm, and J. Lampinen, 2005, Differential Evolution - A Practical Approach to Global Optimization Natural Computing Science, Berlin : Springer.
[5] Zou, D., Liu, H., Gao, L., and Li, S., 2011, A Numbervel Modified Differential Evolution Algorithm for Constrained Optimization Problems, Computers &
Mathematics with Applications (Elsevier), 61(6): 1608-1623,
:http://www.sciencedirect.com/science/article/pii/S0898122111000460, accessed on
August 10, 2017.
[6] Qin, A. K., Huang, V. L., and Suganthan, P. N., 2009, Differential Evolution Algorithm with Strategy Adaptation for Global Numerical Optimization, IEEE Transactions on
Evolutionary Computation, vol. 13, Number. 2, pp. 398-417,
http://ieeexplore.ieee.org/document/4632146/, accessed on August 10, 2017.
[7] Y. Wang, Z. Cai, and Q. Zhang, 2011, Differential Evolution with Composit Trial Vektor Generation Strategies and Control Parameters, IEEE Transactions on
Evalutionary Computation, Vol. 15, Number. 1, 1089-778X,
:http://ieeexplore.ieee.org/document/5688232/. accessed on August 10, 2017.
[8] S. Das, A. Konar, and Chakraborty, 2005, Two Improved Differential Evolution Schemes for faster global Search, ACM SIGEVO proccedings Genetic Evolution
Computation Conference, Washington DC, pp. 991-998,
https://www.cs.york.ac.uk/rts/docs/GECCO_2005/Conference%20proceedings/docs/p99
1.pdf, accessed on August 10, 2017.
[9] J. Qiang, C. Mitchell, and A. Qiang, 2016, Tuning of an Adaptive Unified Differential Evolution Algorithm for Global Optimization. (K. Tang, Ed.), IEEE World Congress on Computational Intelligence, Vancouver, Canada: IEEE, :http://wcci2016.org/index.php- Report Number: LBNL-100436, accessed on August 6, 2017.
[10] A. Musdholifah and S. Z. M., Hashim, 2010, Triangular Kernel Nearest Neighbor Based
Clustering For Pattern Extraction in Spatio-Temporal Database, Intelligent Systems Design and Applications (ISDA), 2010 10th International Conference on pp. 67-73, :http://ieeexplore.ieee.org/document/5687288/, accessed on August 8, 2017.
[11] E. Rendon, I. Abundez, A. Arizmendi, and E. M. Quiroz, 2011, Internal versus External Cluster Validation Indexes, International Journal of Computers and Communications, Vol. 5, Numbermor 1, pp. 27-34, :http://www.universitypress.org.uk/journals/cc/20-463.pdf, accessed on August 10, 2017.
[12] P. A. Pratama and A. Harjoko., Penerapan Algoritma Invasive Weed Optimnization untuk Penentuan Titik Pusat Klaster pada K-Means, IJCCS (Indonesian J. of Computing and Cybernetic Syst, vol. 9, Number. 1, pp.56-76 221, Jan. 2015,