ROAD INFRASTRUCTURE AND SPATIAL ECONOMIC DEPENDENCE IN
THE WESTERN REGION OF JAVA
Siti Herni Rochana
Institut Teknologi Bandung ([email protected])
B. Kombaitan
Institut Teknologi Bandung ([email protected])
Eka Purwanda
STIE STEMBI Bandung ([email protected])
ABSTRACT
The western region of the island of Java consists of three provinces, namely: West Java, Banten, and Jakarta, is a region that contributes significantly to the GDP of Indonesia. In 2010 the contribu-tion of the three provinces was 33.94% of the total GDP, and the remaining 66.06% came from the other 30 provinces. In spite of its high contribution, in terms of the value added by the western region of Java, there are inequalities between the regions. In the year 2010, Jakarta’s per capita income was ten times, or more, than that of Lebak. The existence of this problem in the income disparity between the regions in western Java raises questions relating to the spatial economic dependence of the west-ern region of Java. The unit analysis of the research is all the districts/cities in West Java, Banten, and Jakarta. The measurement used for the spatial economic dependence is Moran’s Index. Spatial varia-bles were comprised in the spatial weight matrix (matrix-W), which was formed using three approach-es: based on the distance, the neighbourhood, and the road transportation network. The economic variables in this study are the level of income per capita and economic growth. The results showed spatial economic dependence, based on distance and neighbourhood, tended to be low. Whereas, the spatial economic dependence based on road connectivity, especially freeways, showed a moderate correlation.
Keywords:road infrastructure, spatial economic dependence, Moran’s Index, western region of Java.
INTRODUCTION
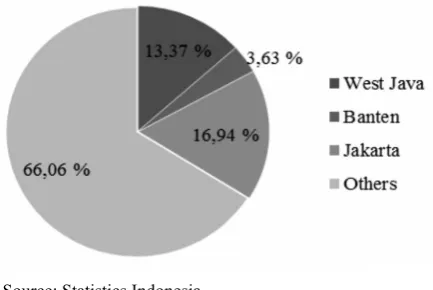
West Java, Banten, and Jakarta are provinces producing high added value in Indonesia. The contribution of the three provinces to Indonesia's GDP is quite large (Figure 1). The GDP of West Java, Banten, and Jakarta in 2010 were IDR308.96 trillion, IDR83.80 trillion and IDR391.53 trillion respectively. These figures represent the percentage proportions 13.37%, 3.63%, and 16.94% of Indonesia's GDP respec-tively. The total GDP contribution given by the three provinces was 33.94%, with the remaining 66.06% coming from the other 30 provinces. The high GDP generated from these three
prov-inces shows that the three provprov-inces have high intensity economic activities. This is not sur-prising because the country's capital Jakarta is the centre for government and business, while West Java and Banten are districts/cities adja-cent to Jakarta.
capita of Jakarta was about 14 times that of Leb-ak. Large differences in the per capita income levels of the two areas show that the disparities between the regions are quite striking. This ex-ample of inter-regional income disparities be-tween Jakarta and Lebak raises great concerns because the geographical distance between the two areas is not so far. The distance between Jakarta and Lebak is approximately 131 kilo-meters. The per capita income gap between the regions in the study area showed the presence of a regional income disparity problem.
Theoretically, spatial economic relations can be explained from the theory of trade and eco-nomic geography. Dixit and Norman (1980) stated that the areas having trade relations tend to have the same relative prices for goods and factors of production, including wages. Because wages are a source of income, it can be said that in areas that have trade relations, then incomes should be relatively equal in those areas.
The new economic geography (Fujita et al., 1999) stated that inter-regional trade will occur if transportation costs are low enough so that the inter-regional trade is economically feasible. Transportation costs are the determining factor for trade relations. If the transportation costs are too expensive, then trade is not economically feasible. If the transportation costs are low, then trade will be economically feasible. Transport costs are very closely related to infrastructure, particularly the roads. Good infrastructure for transport will cause low transportation costs. Conversely, poor infrastructure causes high transportation costs.
Source: Statistics Indonesia
Figure 1. GRDP contribution of West Java, Banten, and Jakarta to Indonesia’s GDP in 2010
The problem of the regional income disparity in the western region of Java raises a question about connectivity and trade relationships. If the transportation accessibility links among the re-gions are available equally in all directions, the difference in the revenues of adjacent regions should not be great. The income gap between the regions of West Java, Banten, and Jakarta raises many questions relating to economic dependen-cies (trade relations) and inter-regional transport connectivity in the western region of Java.
THEORETICAL FRAMEWORK
The economic theory that explains the effect of road infrastructure on economic spatial de-pendence can be seen in Figure 2. Road infra-structure can reduce transportation costs. The new economic geography theory (Krugman, 1991; Fujita et. al., 1999) explains that a low cost for transportation will create and establish trade relations between regions. Trade between regions would then equalize the price of the fac-tors of production, including wages and interest rates. The factor of price equalization can lead to spatial economic dependency.
1. Transportation Costs and Trade
The new economic geography was formed by Krugman (1991) and then Fujita et. al. (1999). This theory explains the connection be-tween transportation costs and trade relations. Low transportation costs can create trade rela-tions and form an agglomeration built core and also periphery formations. Conversely, high transportation costs can impede trade relations so that regions will produce goods in an autarky manner.
Consumer utility is a function of the quantity of goods manufacturing (M) and agricultural goods (A) in the form:
µ
µ −
=M A1
U (1)
1 zation, the demand functions for manufactured goods and agriculture goods are:
)
By entering the manufacturing demand tion (2) and agriculture (3) into the utility func-tion resulting from the indirect utility funcfunc-tion as follows, we get:
) fected by the price index. The form of the trans-portation costs in the core periphery models is iceberg where transportation costs are entered as a multiplier of the home price. As an example, if the price of goods produced in the North isprM, and the transportation costs from North to South is TrsM, then the price of goods delivered to the
By including the transportation costs (5), the demand function for manufactured goods is:
M amount of labour used is shown in the following equation: of manufactured goods, minus the cost of labour:
)
mization is obtained from:
ρ
profit function:⎥
The balance of the manufacturer (at the zero profit condition) is obtained:
M found that the wage of manufacturing workers in the North is as follows:
]
2. Trade and Factor Price Equalization
Dixit and Norman (1980) built a proposition that trade would make the factor price equaliza-tion. Suppose a country produces goods named 1 and 2, respectively priced at a
condition for trade is therefore:
0 the wages, which can be written as follows:
2 ing from changes in the relative factor prices can be described as follows:
22
Equation (17) shows that changes in the tive factor prices will lead to changes in the rela-tive output prices if the ratio of the input coeffi-cient is different.
3. Hypotheses
A study of the available literature showed that low transportation costs will encourage trade relations, and further equalize the relative wages. The development of adequate transport infrastructure will decrease transportation costs. Thus this can be arranged in a hypothesis that the regions linked by sufficient transport infra-structure will have an economic dependence.
METHODOLOGY
1. Data
The observation area covered all the dis-tricts/cities in West Java, Banten, and DKI Ja-karta. In West Java there are 17 districts and 9 cities. The province of Banten consists of 4 dis-tricts and 4 cities. While in this study Jakarta is treated as one region. The year of observation in this study was 2010.
2. Spatial Dependence Measurement
Measurement of the spatial economic de-pendence is done using Moran’s Index.
Princi-pally, Moran’s Index is a modified form of cor-relation between the economic variables and the spatial variables. The formula for Moran’s Index (Fischer and Wang, 2011) is as follows:
∑
i : districts/cities i j : districts/cities j
The range value of Moran’s Index is -1 ≤ I ≤
1. A Moran’s Index value of +1 indicates a per-fect correlation, while the value -1 indicates a perfect dispersion. The value 0 indicates no cor-relation. Expected values and variations for Mo-ran’s Index are:
)
3. Spatial Weight Matrix Specification
form-ing a matrix-W (Anselin, 1988; Chen, 2012). Formation of the matrix-W can be described as follows:
Spatial weight matrix:
⎥
Spatial contiguity matrix:
⎥ eral methods that can be used. In this study, ma-trix-C was built using three approaches: based on distance, based on adjacent territories (neigh-bours), and based on the road transportation network:
1. Spatial contiguity matrix based on distance.
The formation of matrix-W is usually made based on distance. This formation starts with making a matrix-C, which has elements of the
distance decay. This distance decay is the in-verse distance or inin-verse distance squared (An-selin, 2003).
2. Spatial contiguity matrix based on neigh-bourhoods.
Matrix-W can also be made using the neigh-bourhood approach. In this case, matrix-W’s formation starts with building matrix-C, which contains weighted elements. The weights are valued as 1 for the adjacent areas and 0 for the other areas (LeSage, 1997).
3. Spatial contiguity matrix based on the trans-portation network.
a. Freeway
Recently, matrix-W was also developed to be able to capture the transportation network. In this study, matrix-W was built from matrix-C which had weighted elements based on free-ways.
b. Ordinary Roads
Besides capturing freeways, matrix-W also captured ordinary roads as indicators of the con-nectivity among the districts/cities.
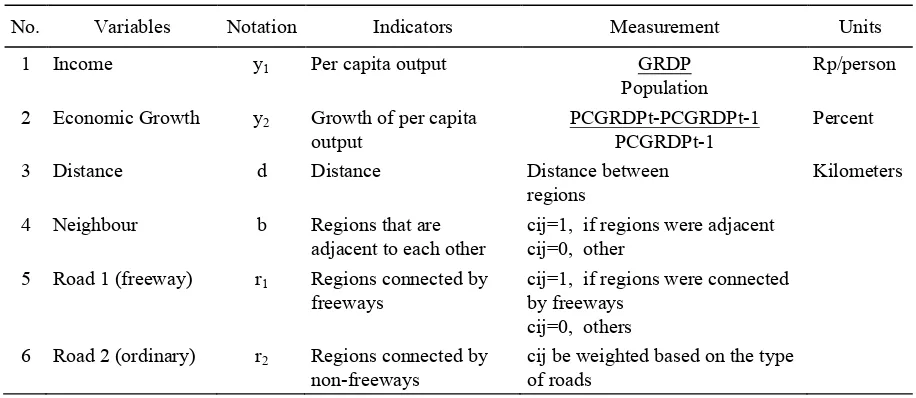
The operationalisation of the variables in this study is shown in Table 1.
Table 1. Operationalisaton of variables
No. Variables Notation Indicators Measurement Units
1 Income y1 Per capita output GRDP adjacent to each other
cij=1, if regions were adjacent cij=0, other
5 Road 1 (freeway) r1 Regions connected by freeways
cij=1, if regions were connected by freeways
cij=0, others
6 Road 2 (ordinary) r2 Regions connected by non-freeways
cij be weighted based on the type of roads
RESULT
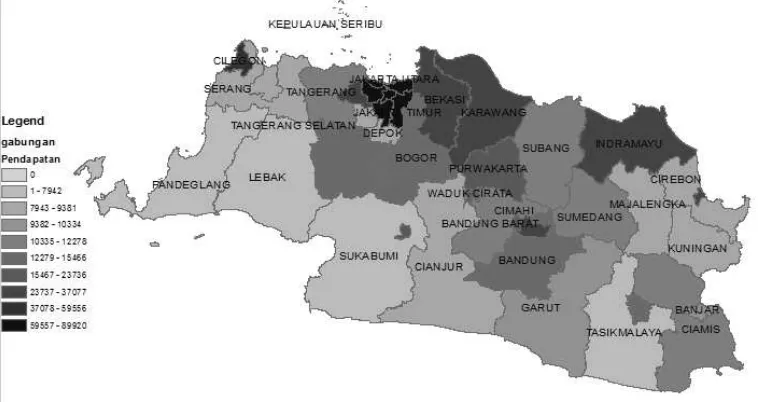
Figure 2 is a map of West Java which de-scribes the distribution of per capita income. Districts/cities with dark colours show a higher per capita income. Jakarta has the highest per capita income with IDR89.9 million per capita per year, while the lowest is Lebak, which only has IDR6.5 million per capita per year.
This description of the income distribution, with Jakarta having the highest rank is not surprising, because Jakarta is the capital and the largest business centre in Indonesia. On the other hand, Lebak has the lowest per capita income. This finding is quite odd, because Lebak is located
not that far away from Jakarta (about 131 kilo-meters away). This relatively small distance be-tween both cities should not result in so big a difference between their per capita income lev-els.
Figure 3 shows the economic growth of the districts/cities in the western region of Java. The districts/cities having higher economic growth are shown by their increasingly intense colour. Karawang has the highest economic growth, with a growth rate of 18.19%, while Tasikma-laya has the lowest economic growth, at a growth rate of only 6.21%.
Figure 2. Income per capita of the districts/cities in the western region of java
Karawang is the centre for industrial activity. The high economic growth in Karawang is caused by the encouragement given to industrial activity in the region. Tasikmalaya is an agricul-tural area, whose low economic growth could be caused by the slow growth in the agricultural sector in this region.
Moran’s Index value for each matrix-W on income and economic growth can be seen in Ta-ble 2. From TaTa-ble 2 we find three significant Moran’s Index values for income dependence: that based on the distance between regions is 0.01763, the income dependency based on the connectivity of ordinary roads is 0.0628, and the dependency of economic growth based on the freeways’ connectivity is moderate at 0.2260.
Of the three significant Moran’s Index val-ues, two of the values are very low, 0.01763 for the income dependencies based on distance and 0.0628 for the income dependencies based on ordinary roads’ connectivity. A low value for Moran’s Index indicates that the relationship of the income among regions based on distance and ordinary roads is very small. An increased come from an area is associated with the in-creased income in other regions, but the correla-tion is very small.
This finding is similar to a study in China. Ho and Li (2010) found that there was no abso-lute convergence across cities during the period 1984–2003. They found that cities with a com-parable per capita GDP level were likely to be located in the same region; further, cities tend to mirror the mobility of their counterparts located within the same province.
Referring to classical economics, income levels are determined more by the initial income. The findings in this research, that distance and ordinary roads correlated with income levels, requires further research to test the spatial econ-ometric method by adding other explanatory var-iables such as the level of initial income.
From Table 2 the high value and significance of the Moran’s Index for dependencies of eco-nomic growth among areas linked by freeways can also be seen, with a value of 0.2260. This value illustrates that, among areas connected by
freeways, they have a high degree of interde-pendency in their economic growth. A high rela-tionship of interdependencies in economic growth among the regions indicates that the economy is interrelated. Specifically, the rela-tionship in question is the one for economic trade.
Table 2. Moran’s index value for spatial economic dependence in the western region of java
Matrix-W Economic Variables
Income Growth
Distance 0.01763
(2.9675)**
-0.0276 (0.2731)
Neighbour 0,0798
(0.8555)
-0.2067 (-1.0329)
Road-1 (freeway) 0.1546
(1.0915)
0.2260 (1.4721)*
Road-2 (ordinary road)
0.0628 (10.4089)***
0.0899 (0)
*,**, *** are significant at α=0.1, α=0.05, and α=0.01; z-statistic in parentheses
Back to the new economic geography theory, inter-regions would have trade relations if the transportation costs were lower and vice versa. The observation by Moran’s Index indicates that the regions linked by freeways have a high eco-nomic dependency. This occurs because the are-as connected by freeways have lower transport costs than areas that are not connected by free-ways. Lower transport costs lead to the trade between regions becoming economically feasi-ble.
Moran’s Index for economic growth depend-encies among the regions based on distance is not significant. This situation occurs because the distance between two adjacent regions is not necessarily associated with lower transport costs. In contrast, regions that are far from each other may have lower transportation costs because they are connected with a good transportation network.
probably due to the existence of business clus-ters, and to the fact that importers in Spain find it easier to cooperate with transportation matters than exporters do.
Also similar are the results of research in China, Hering and Poncet (2007) found that the positive contribution by market access to income disparities in China was mitigated by the hetero-geneous impact of market access on income, depending on the local immigration intensity. The elasticity of market access to income was 62% higher in cities located in provinces charac-terized by low immigration flows.
Another interesting finding from this study is that there is a tendency for differences in the levels of per capita income between the North and the South. The result suggests that economic activity is more concentrated in the North. Eco-nomic activity tends to be pooled in the North due to the freeway network being more widely available in the North than in the South. This situation has created an economic gap between the North and the South in the western region of Java.
CONCLUSION AND RECOMENDATION
1. Conclusion
In the western region of Java, a significant relationship with per capita income has occurred among regions that are correlated based on their distance and ordinary roads connectivity, but the degree of interdependence is very low. On the other hand, a significant relationship with eco-nomic growth occurred among regions connect-ed by freeways.
2. Policy Recommendation
This study recommends policy makers build sufficient road infrastructure to support trade relations. The freeways that connect regions di-rectly with their markets will make trade rela-tions more rapid. Trade relarela-tions in turn will have a positive effect on the economic growth of the regions connected to their central market ar-eas.
REFERENCES
Alama-Sabater, L., L. Marquez-Ramos, C. Sua-rez-Burguet, and J. Miguel Navarro-Azorin. 2012. Interregional Trade and Transport Connectivity. An Analysis of Spatial De-pendence. Castellon Working Paper 2012/20.
Anselin, L. 1988. Spatial Econometrics: Meth-ods and Models. Kluwer, Dordrecht. Anselin, L. 2003. Spatial Externalities, Spatial
Multipliers, and Spatial Econometrics. In-ternational Regional Science Review 26(2),153–166.
Chen, Y. 2012. On the Four Types of Weight Functions for Spatial Contiguity Matrix. Letter Spatial Resource Science 5,65-72. Dixit, A. K. and V. D. Norman. 1980. Theory of
International Trade. Cambridge, Cambridge University Press.
Feenstra, R. C. and A. M. Taylor. 2011. Interna-tional Economics. Second Edition. New York, Worth Publisher.
Fischer, M. M. and J. Wang. 2011. Spatial Data Analysis. Models, Methods, and Techniques. Heidelberg, Springer.
Fujita, M., P. Krugman, and A. J. Venables. 1999. The Spatial Economy: Cities, Regions and International Trade. Cambridge. The MIT Press.
Hering, L. and S. Poncet. 2007. Economic Geog-raphy, Spatial Dependence, and Income In-equality in China. CEPII Working Paper 2007-22.
Ho, C. Y. and D. Li. 2010. Spatial Dependence and Divergence across Chinese Cities. Re-view of Development Economics 14(2),386-403.
Krugman, P., 1991, Increasing Returns and Eco-nomic Geography. Journal of Political Economy 99(3),483-499.