Short communication
Biodiversity in Mediterranean buffalo using two
microsatellite multiplexes
A.R. Elbeltagy
a,⁎
, Salah Galal
b, A.Z. Abdelsalam
b, F.E. El Keraby
a,
M. Blasi
c, Mahasen M. Mohamed
aa
Animal Production Research Institute, Ministry of Agriculture and Land Reclamation, P.O.B 443, Dokki, Giza, Egypt b
Faculty of Agriculture, Ain Shams University, P.O.B. 68, Hadaeq Shubra, Cairo, Egypt c
Laboratorio di Genetica e Servizi, LGS, 26100 Cremona—Via Bergamo, 292, Italy
Received 25 July 2006; received in revised form 29 September 2007; accepted 1 October 2007
Abstract
The present study was carried out to investigate genetic diversity in Nile-Delta and Southern-Egypt buffalo populations in comparison with the Italian buffalo utilizing two microsatellite multiplexes. A total of 104 animals classified into three groups were used, 28, 38 and 38 representing the Nile-Delta, Southern-Egypt and Italian buffalo, respectively. The 15 studied microsatellites were CSSM38, CSSM70, CYP21, CSSM42, CSSM60, MAF65, BM0922, CSSM19, INRA006, ETH02, BM1706, BMC1013, CSSM47, INRA026 and CA004. All studied microsatellites showed allelic polymorphism. Number of polymorphic alleles ranged between 4 alleles (CSSM38, CSSM70 and CYP21) and 11 alleles (CA004). Pairwise Chi-square test for Nile Delta and Southern Egypt showed significant differences in allelic distribution at five loci, CSSM70, CSSM38, BM0922, ETH02 and BM1706. Italian buffalo showed the lowest percentage of observed heterozygotes (65%), while the Southern Egypt showed the highest (71%). Both the Italian and the Delta populations deviated significantly (Pb0.05) from HW equilibrium. Italian buffalo is relatively the most inbred population while the Southern-Egypt buffalo is the only outbred population. High level of genetic differentiation (FSTestimates) between the Italian
group and each of the Delta and Southern-Egypt group (0.083 and 0.076, respectively) was observed while Southern-Egypt group showed a lower level of genetic differentiation with the Delta group (0.014). Italian buffalo had the greatest genetic distance values with the two Egyptian groups (0.25 and 0.23) while much lower values between the Southern-Egypt and the Delta groups (0.06) was observed. Genetic variation between the Italian buffalo and the Egyptian buffalo was detected in 14 (out of 15) microsatellite loci. While a lower level (than that between Egyptian and Italian) of genetic variation between Southern-Egypt and Delta buffalo populations was expressed by 5 loci. It was concluded that the Southern-Egypt buffalo could be considered as distinct population from the Delta buffalo. In addition, Southern-Egypt group, being the only group with non-significant global deviation from HW equilibrium, the most heterozygous, and the only outbred population as well, is expected to respond more favorably to selection. © 2007 Elsevier B.V. All rights reserved.
Keywords: Bos bubalus bubalis; Biodiversity; Egyptian buffalo; Italian buffalo; Microsatellites
1. Introduction
Buffalo sub-populations (e.g. breeds) in Egypt are mainly based on geographical origin within the country
Livestock Science 114 (2008) 341–346
www.elsevier.com/locate/livsci
⁎ Corresponding author. Department of Animal Biotechnology, Animal Production Research Institute, P.O.B 443, Nadi Elsaid St., Dokki, Giza, Egypt. Tel.: +20 010 562 0692; fax: +20 02 337 2934.
E-mail address:[email protected](A.R. Elbeltagy).
with little or no documented phenotypic or genetic dif-ferences that may help in characterizing these sub-pop-ulations and relating them to other Mediterranean breeds. Examples of the breed names mentioned in the Egyptian and international literature are the Baladi (Native), Beheri, Monoufi, Masri and Saiedi (Southern Egypt) (FAO Domestic Animal Diversity Information System (DAD-IS)). Minor phenotypic differences are reported concerning size, color and performance that have not been updated or verified since the establishment of DAD-IS. These differences are not well defined to be relied on as taxonomic classification for those populations.
Limited number of researches has been conducted globally exploring the genetic diversity on molecular ge-netic basis in buffalo in comparison with other farm animal genetic resources (FAnGR). Only very few studies were conducted including the Egyptian buffalo, e.g. Moioli et al. (2001), in which a limited sample size and particular regions of Egypt were selected as sample sources.
The present study aimed at investigating genetic diversity in Nile-Delta and Southern-Egypt buffalo popu-lations in comparison with the Italian buffalo and inves-tigating the distinction between Delta and Southern-Egypt buffalo populations.
2. Materials and methods
2.1. Sampling of animals
Hundred and four animals classified into three groups were sampled as: i. Nile-Delta buffalo represented by 24 females and 4 males kept in three adjacent buffalo experimental farms of the Animal Production Research Institute (APRI) located in Kafr Elsheikh governorate in Mid Nile Delta which represent an admix of non-characterized buffalo germplasm in the Delta region. Selected animals were genealogically traced to be unrelated as far as three generations back. ii. Southern-Egypt buffalo represented by 38 females kept in 23 small scale private animal holdings scattered in Sohag governorate. Sohag was selected for being a remote governorate in Southern Egypt. Animals were selected for belonging to various holdings and different generations (age class) to minimize co-ancestry. iii. Italian buffalo, represented by 38 animals belonging to various farms in central and southern Italy.
2.2. Specimen collection and DNA extraction and quantification
For the Egyptian buffalo populations, blood samples were collected from all the females while hair pulps were collected from the males. DNA samples of the Italian animals were supplied by the Laboratory of Genetic Service (LGS), Cremona, Italy.
DNA of the Egyptian animals was extracted using either the “reversible binding to silica membrane”or“salting out”(Miller
et al., 1988) techniques, while the DNA of the Italian animals was extracted at LGS using CHELEX/Protinase-K procedure for DNA release using Chelex® 100 (BioRad) resin (Cano and Poinar, 1993). Extracted DNA from Egyptian buffalo was quantified using BioPhotometer, Eppendorf AG, Germany.
2.3. Utilized microsatellite markers
All 15 markers used were microsatellite type recommended by Laboratory for Genetics and Services, LGS, and shown to be polymorphic in cattle and buffalo (Moore et al., 1995; Barker et al., 1997; FAO, 2004). Studied microsatellites were amplified using two multiplexes. The first multiplex consisted of nine microsatellites (being MAF65, INRA006, CSSM47, CSSM19, CA004, CSSM42, CYP21, ETH02, and BMC1013) while the second multiplex consisted of six microsatellites (CSSM70, CSSM60, INRA026, BM0922, BM1706, and CSSM38). The labeling dye for each forward segment of primers is presented in
Table 1.
2.4. Polymerase chain reaction (PCR) and allelic fragmentation
Studied microsatellites were amplified using PTC-200 thermal cycler (M. J. Research, Watertown, USA). PCR cocktail, in each of the multiplexes, was composed of 300 ng template DNA, 1× PCR buffer, 3 mM MgCl2, 2 U of Taq Gold (Applied Biosystems),
400μM of dNTP's mix (Applied Biosystems). The first multiplex contained 400, 200, 400, 100, 400, 100, 200, 200, and 200 pM from each of the forward and reverse segments of MAF65, INRA006, CSSM47, CSSM19, CA004, CSSM42, CYP21,
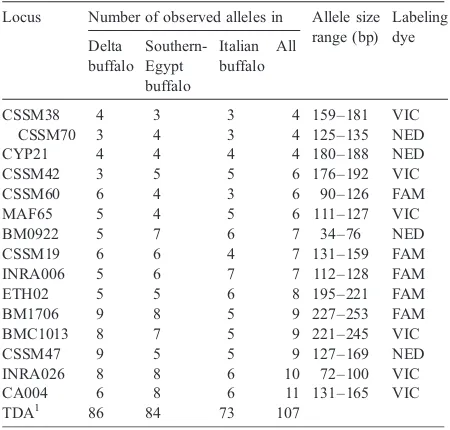
Table 1
Observed number of alleles in each of the three sampled buffalo groups/populations and detected allele size range
Locus Number of observed alleles in Allele size range (bp)
ETH02, and BMC1013 primers, respectively. The second multi-plex contained 150, 500, 500, 75, 400, and 500 pM of each segment of CSSM70, CSSM60, INRA026, BM0922, BM1706, and CSSM38, respectively. Final reaction volumes were made to 10 and 11μL for the first and the second multiplexes, respectively. Thermal profile was a pre-run at 95 °C for 10 min., followed by 30 tri-phasic cycles of denaturation at 95 °C for 15 s, annealing at 57 °C for a minute and extension at 72 °C for a minute, and final extension for 10 min at 72 °C. PCR product was then denatured in a denaturation mix composed of 0.9 μl PCR product + 2.1 μl loading master mix, while the loading master mix was composed of 250μl deionized Hi-Di-Formamide (Applied Biosystems, P/N. 4311320), 50 μl GENESCAN-350 size standard (Applied Biosystems, P/N. 401735), and 50μl loading stain (Blue dextrane, 50 mg/ml in EDTA, 25 mM, PHARMACIA P/N. 17-0360-01). The denaturation mix was incubated at 95 °C for 4 min and immediately chilled in ice to prevent re-annealing. A volume of 1.5μl of such mix was loaded to the Applied Biosystems 377 DNA sequencer. GeneScan v. 3.1 software was utilized by the equipment for fragmentation of various alleles by comparison against the GENESCAN-350 standard.
2.5. Quantitative measures
Quantitative measures, at the molecular level, were clas-sified into four main categories: a. microsatellite polymorph-ism in order to assess polymorphpolymorph-ism profile in the studied populations. Detected alleles and their molecular length (in base pairs) in every studied group and all over the groups were determined using GenePop software, Version 3.3, March 2001 updated fromRaymond and Rousset (1995a). b. Genetic var-iability, in which five measures were estimated. i. Allele fre-quency. ii. Chi-square test for the heterogeneity of genetic frequencies. iii. Observed Hobs and expected Hexp
hetero-zygosity for each studied group all over studied loci and mean heterozygosity (Nei, 1978).Hexp, was calculated as defined by
Nei (1973). iv.“FIS”, as a measure of the within group
het-erozygosity deficit or inbreeding, representing Wright's fix-ation indices (Wright, 1943, 1978) was estimated using permutation tests (Goudet, 2002) with determined level of significance of 0.01 and 2000 permutation tests of alleles within populations and was adjusted with the sequential Bon-ferroni procedure (Holm, 1979; Hochberg, 1988) applied over loci. v. Deviation from HW equilibrium of population per locus and globally over all loci. The test was performed using the unbiased estimates of HW exact P values according to
Raymond and Rousset (1995b) using Markov Chain Monte Carlo method applied to compute unbiased estimate of the exact test probability, P, (Guo and Thompson, 1992). Sig-nificant levels for each test were determined by applying the probability estimates calculating the sequential Bonferroni procedure for multiple tests (Hochberg, 1988; Lessios, 1992). Test for HW equilibrium was performed using the GenePop software, Version 3.3, while the first four genetic variability measures were estimated using FSTAT software, version 2.9.3.2 (Feb. 2002), updated fromGoudet (1995). c. Genetic
differentiation measures which included: i.“FST”as a measure
of the between populations heterozygosity deficit or popula-tion differentiapopula-tion assessing the variapopula-tion in the group relative to that in the total groups, calculated for each pair of groups. Similar to the “FIS”, “FST” was also computed using
per-mutation tests (Goudet, 2002) with a level of significance of 0.01 and 2000 permutation test of genotypes within the total population (FST) and was adjusted with the sequential
Bon-ferroni procedure applied over loci. ii. Genetic distance; (D), a measure of the number of detectable genetic substitutions that have accumulated in two populations since they diverged (and therefore a measure of genetic difference). Nei's standard genetic distanceDs(Nei, 1987) was estimated. Both Genetic
differentiation measures were estimated using FSTAT. d. Phylogenetic analysis, representing the inter-individual-genetic distance based on dendrogram relationship in popula-tion pairs aiming at studying proposed evolupopula-tionary relapopula-tion- relation-ships between pairs of studied buffalo populations. Standard genetic distance estimates, DA of Nei and Takezaki (1994)
were used to construct dendrograms of phylogenetic relation-ship trees with the neighbor-joining (NJ) on clustering algorithm (Saitou and Nei, 1987) using PHYLIP, Phylogeny Inference Package, version 3.6 (Jul., 2004), updated from (Felsenstein, 1985), NEIGHBOR module. Tree-View 32 was used to draw the dendrogram presentations.
3. Results
3.1. Microsatellite polymorphism
All studied microsatellites showed polymorphism in all studied buffalo groups. Number of polymorphic alleles ranged between four (CSSM38, CSSM70 and CYP21) and eleven (CA004) as shown in Table 1. The highest number of detected alleles over all loci was shown by the Nile-Delta group (86), while the lowest polymorphic alleles were shown by the Italian buffalo (73 alleles).
3.2. Allele frequency
Allele frequency of studied loci over the buffalo groups showed the presence of exclusive alleles with low frequencies (between 0.01 and 0.17 for a single population).
3.3. Homogeneity test of allelic distribution across all groups and pairwise comparison
vs. Southern Egypt, five loci showed significant hetero-geneity (Table 2).
3.4. Observed and expected heterozygosity
Generally, the average expected heterozygosity for studied groups was higher than the observed except the Southern-Egypt group, where, the average observed was slightly higher than the expected (Table 3), indicating heterozygosity deficit, in both Italian and Delta buffalo groups. Italian buffalo showed the lowest percentage of observed heterozygotes (0.65).
3.5. Deviation from Hardy–Weinberg equilibrium
Deviation from Hardy–Weinberg equilibrium (Table 3) was statistically significant (Pb0.05) in 17 locus-breed combinations. Four loci showed significant deviation in all of the three studied breeds (CYP21, CSSM60, CSSM70
and CSSM38). The three loci CSSM19, CA004, and ETH02 showed significant deviation only in the Italian population while CSSM42, INRA026 showed the sig-nificant deviation in the Delta population. The global test of deviation overall loci indicated that both Nile-Delta and Italian buffalo populations deviated from HW equilibrium due to heterozygosity deficiency.
3.6. Within population heterozygosity deficit (inbreeding) measure
AveragingFIS(within population heterozygosity def-icit) over all loci as an estimator of inbreeding (Table 3) indicates that the Italian buffalo is relatively the most inbred population while the Southern Egypt is the only outbred population. Obtained results are compatible with heterozygosity results.
3.7. Population differentiation measure, FST
Table 4 shows the high level of genetic differentia-tion between the Italian group and each of the two Egyptian groups, while Southern-Egypt group showed a lower level of genetic differentiation with the other Egyptian group. All pairwise population differentiation estimates, after the Bonferroni correction, showed highly significant differences (Pb0.01).
3.8. Genetic distance
Italian buffalo had the greatest distance values with the two Egyptian groups and expectedly, the lowest distance estimate was shown between the two Egyptian groups (Table 4).
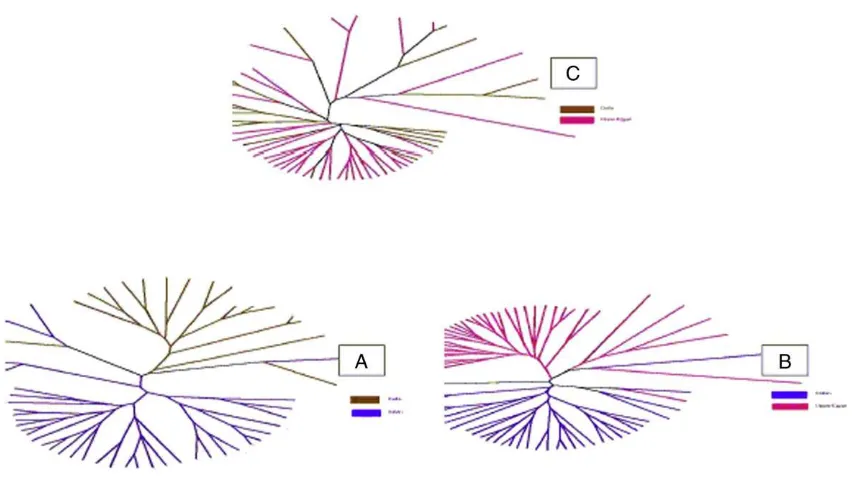
3.9. Relationship dendrogram
Fig. 1 (A, B and C) represent the inter-individual-genetic distance based dendrogram relationship in population pairs. The radial trees of individuals' genetic distances show a separated pattern between the individuals of the Italian and both the Egyptian groups
Table 2
Chi-square test of significance of the population homogeneity for the 15 loci studied in the three buffalo groups, and in a pairwise comparisons between the Nile-Delta and the Southern-Egypt groups
Locus No. Alleles
All groups Delta and Southern-Egypt groups
D.F. χ2 D.F. χ2
CSSM38 4 12 29.73⁎⁎ 3 12.52⁎⁎ CSSM70 4 12 50.21⁎⁎ 3 8.28⁎ CYP21 4 16 21.95ns 3 5.71ns
CSSM42 6 20 124.87⁎⁎ 4 2.19ns CSSM60 6 32 52.65⁎ 5 4.14ns MAF65 6 20 51.63⁎⁎ 4 8.30ns BM0922 7 24 201.43⁎⁎ 6 16.29⁎ CSSM19 7 28 104.34⁎⁎ 6 7.12ns INRA006 7 24 75.45⁎⁎ 5 4.68ns ETH02 8 28 148.60⁎⁎ 5 22.57⁎⁎⁎ BM1706 9 40 125.24⁎⁎ 8 20.53⁎⁎ BMC1013 9 40 102.87⁎⁎ 8 13.07ns
CSSM47 9 44 310.16⁎⁎ 8 13.65ns
INRA026 10 40 122.19⁎⁎ 8 7.59ns
CA004 11 44 139.88⁎⁎ 9 13.41ns
⁎Pb0.05,⁎⁎Pb0.001⁎⁎⁎Pb0.0001 and ns = non-significant.
Table 3
Mean observed,Hobs, and mean expected,Hexpheterozygosity, within population heterozygosity deficiency, FIS, and number of loci deviating from HW equilibrium
Buffalo population
Hobs Hexp FIS No. of loci deviating from HW equilibrium Delta 0.661 0.680 0.052 6
Southern Egypt 0.709 0.695 −0.005 4
Italian 0.65 0.677 0.059 7
Table 4
Estimated pairwiseFST(above diagonal) and genetic distance (below diagonal) between pairs of studied buffalo groups
Group Delta Italian Southern Egypt Delta 0.0827⁎⁎ 0.0142⁎⁎ Italian 0.2525 0.0762⁎⁎ Southern Egypt 0.0574 0.2295
(A and B) while a mixture of individuals from the two Egyptian groups is shown. Individual-pairs distance was only estimated for the individuals with no missing data in the allelic forms for all the studied 15 loci and only those individuals appeared in the unrooted trees.
4. Discussion
In comparison of microsatellite polymorphism results with other studies on water buffalo (Bubalus bubalis) for some similar loci,Barker et al. (1997)working on Asian water buffalo, reported number of alleles of 5, 9, 18 and 9 for the CSSM19, CSSM38, CSSM47 and CSSM60, respectively. Their results showed that Asian water buffalo carries higher corresponding number of alleles in CSSM38 (9 vs. 4), CSSM60 (9 vs. 6) and CSSM47 (18 vs. 9) loci, and lower number of alleles in locus CSSM19 (5 vs. 7).Moioli et al. (2001)detected a total number of alleles (in the three populations of Italian, Greek and Egyptian buffalo) of 8, 6, 9, 10 and 16 alleles for loci CSSM70, CSSM38, CSSM60, BMC1013, and CSSM47, respectively, which is higher than the corre-sponding markers in the present study (Table 1).Kumar et al. (2006), studying eight Indian buffalo breeds, reported 9 alleles for each of CA004 and CSSM47 loci, which is a similar number for the latter in the present study, but lower than those detected for the CA004 (being 11 in the present study).
Lower degree of polymorphism shown by the Italian population may possibly be explained by the selection practiced in the Italian buffalo population that could have eroded polymorphism throughout successive gen-erations, assuming the presence of a degree of linkage disequilibrium between some of the studied loci and the QTL or functional segments affecting economic traits, mainly milk.
The lowest percentage of observed heterozygotes shown by the Italian buffalo (0.65), may be partially explained by reasons given above for lower degree of polymorphism. Barker et al. (1997) reported observed heterozygosity range between 0.531 and 0.613 and expected heterozygosity range between 0.564 and 0.607.Kumar et al. (2006)reported ranges of 0.63–0.71 and 0.71–0.78 for the observed and the expected hetero-zygosity, respectively, indicating higher expected than observed heterozygosity in all the studied breeds. Gen-erally, heterozygosity estimates of the present study are agreeable with other estimates reported for the Asian water buffalo.
The non-significant global deviation from Hardy– Weinberg equilibrium shown by the Southern-Egypt population might be due to a sort of random mating (no specific genetic improvement plan is reported to be applied within this group). The higher heterozygosity shown in that population is an indication of higher variability, thus allowing the possibility of genetic improvement.
Conversely, global significant deviation from HW equili-brium in groups selected from experimental herds of Nile Delta, as well as the Italian group, might be due selection applied for the genetic improvement of economic traits.
Results of theFISaverage over all loci indicate that the Italian buffalo is relatively the most inbred popula-tion while the Southern Egypt is the only outbred popu-lation. This is compatible with heterozygosity results since the Southern-Egypt group was the most heterozy-gous group while the Italian was the least.
The dendrogramic relationships of individuals' ge-netic distances, showing a separated pattern between the individuals of the Italian and both the Egyptian groups (Fig. 1, A and B) and a mixture of individuals from the two Egyptian groups (Fig. 1, C), emphasize the distinctiveness of the Italian buffalo from the Egyptian and the common ancestry for both the Egyptian buffalo populations.
5. Conclusion
On one hand, there was a reasonable genetic variation, at the molecular level, between Italian and the Egyptian buffalo. On the other hand, there was a lower but signifi-cant level of genetic variation between Southern-Egypt and Nile-Delta buffalo, expressed in 5 loci. Therefore, Southern-Egypt buffalo could be considered as a distinct population from the Nile-Delta buffalo. More studies need to be carried out to study probable variations among further putative sub-populations (breeds/types) of Nile-Delta buffalo.
The Southern-Egypt group, being the only group with non-significant deviation from HW equilibrium and the most heterozygous group, as well, can more significantly respond to genetic improvement based on selection.
Acknowledgements
Authors gratefully acknowledge the staff of the Laboratory of Genetic Service, LGS, in both Cremona and Potenza, Italy, especially Mrs. Giovanna Berrotta, Mrs. Adele Lanza, Mrs. Cinzia Senese and Mr. Mario Pertoletti for their technical support and personal help in PCR optimization, the AB 377 sequencer maintenance and operation, allele size determination and standardiza-tion between the AB 377 and AB 3100 sequencing machines.
References
Barker, J.S.F., Moore, S.S., Hetzel, D.J.S., Evans, D., Tan, S.G., Byrne, K., 1997. Genetic diversity of Asian water buffalo (Bubalus bubalis):
microsatellite variation and a comparison with protein-coding loci. Anim. Genet. 28, 103–115.
Cano, R.J., Poinar, H.N., 1993. Rapid isolation of DNA from fossil and museum specimens suitable for PCR. Biotechniques 15 (3), 432–436.
FAO, 2004. Secondary Guidelines for Development of National Farm Animal Genetic Resources Management Plans, Measurement of Domestic Animal Diversity (MoDAD). Recommended Micro-satellite Markers, Rome, Italy.
Felsenstein, J., 1985. Confidence limits on phylogenies: an approach using the bootstrap. Evolution 39, 783–791.
Goudet, J., 1995. FSTAT (vers. 1.2): a computer program to calculate F-statistics. J. Heredity 86, 485–486.
Goudet, J., 2002. FSTAT, a program to estimate and test gene diversities and fixation indices (version 2.9.3.2). URL:http// www2.unil.ch/popgen/softwares/fstat.htm. Access 21st Dec. 2004. Guo, S.W., Thompson, E.A., 1992. Performing the exact test for Hardy–Weinberg proportion for multiple alleles. Biometrics 48, 361–372.
Hochberg, Y., 1988. A sharper Bonferroni procedure for multiple tests of significance. Biometrika 75, 800–802.
Holm, S., 1979. A simple sequentially rejective multiple test procedure. Scand. J. of Statist. 6, 65–70.
Kumar, S., Gupta, J., Kumar, N., Dikshit, K., Navani, N., Jain, P., Nagarajan, M., 2006. Genetic Variation and relationships among eight Indian riverine buffalo breeds. Mol. Ecol. 15, 593–600. Lessios, H.A., 1992. Testing electrophoretic data for agreement with
Hardy–Weinberg expectations. Mar. Biol. 112, 517–523. Miller, S.A., Dykes, D.D., Polesky, H.F., 1988. A simple salting out
procedure for extracting DNA from human nucleated cells. Nucleic Acids Res. 16, 1215.
Moioli, B., Georgoudis, A., Napolitano, F., Catillo, G., Giubilei, E., Ligda, Ch., Hassanane, M., 2001. Genetic diversity between Italian, Greek and Egyptian buffalo populations. Livest. Prod. Sci. 70, 203–211.
Moore, S.S., Evans, D., Byrne, K., Barker, J.S.F., Tan, S.G., Vankan, D., Hetzel, D.J.S., 1995. A set of polymorphic DNA microsatellites useful in swamp and river buffalo (Bubalus bubalis). Anim. Genet. 26, 355–359.
Nei, M., 1973. Analysis of gene diversity in subdivided populations. Proc. Nat. Acad. Sci. U. S. A. 70, 3321–3323.
Nei, M., 1978. Estimation of average heterozygosity and genetic distance from a small number of individuals. Genetics 89, 583–587. Nei, M., 1987. Molecular Evolutionary Genetics. Columbia University
Press, New York. 512 pp.
Nei, M., Takezaki, N., 1994. Estimation of genetic distance and phylogenetic trees from DNA analysis. In: Smith, C., et al. (Ed.), Proceedings of the 5th World Congress on Genetics Applied to Livestock Production, vol. 21. University of Guelph, Canada, pp. 405–412.
Raymond, M., Rousset, F., 1995a. Genepop (Version 12): population genetics software for exact tests and ecumenism. J. Heredity 86, 248–249.
Raymond, M., Rousset, F., 1995b. An exact test for population differentiation. Evolution 49, 1280–1283.
Saitou, N., Nei, M., 1987. The neighbor-joining method: a new method for reconstructing phylogenetic trees. Mol. Biol. Evol. 4 (4), 406–425.
Wright, S., 1943. Isolation by distance. Genetics 28, 114–138. Wright, S., 1978. Evolution and the genetics of populations. Variability