Full Terms & Conditions of access and use can be found at
http://www.tandfonline.com/action/journalInformation?journalCode=cbie20
Download by: [Universitas Maritim Raja Ali Haji] Date: 19 January 2016, At: 19:58
Bulletin of Indonesian Economic Studies
ISSN: 0007-4918 (Print) 1472-7234 (Online) Journal homepage: http://www.tandfonline.com/loi/cbie20
Productivity growth in Indonesian agriculture,
1961–2000
Keith O. Fuglie
To cite this article: Keith O. Fuglie (2004) Productivity growth in Indonesian
agriculture, 1961–2000, Bulletin of Indonesian Economic Studies, 40:2, 209-225, DOI: 10.1080/0007491042000205286
To link to this article: http://dx.doi.org/10.1080/0007491042000205286
Published online: 19 Oct 2010.
Submit your article to this journal
Article views: 218
View related articles
ISSN 0007-4918 print/ISSN 1472-7234 online/04/020209-17 © 2004 Indonesia Project ANU DOI: 10.1080/0007491042000205286
PRODUCTIVITY GROWTH IN
INDONESIAN AGRICULTURE, 1961–2000
Keith O. Fuglie
International Potato Center, Bogor
This paper uses an index number approach to measure total factor productivity (TFP) growth in Indonesian crop and livestock agriculture from 1961 to 2000. Tornqvist–Theil chain-weighted indices of output, input and TFP are developed to minimise biases that may result from relative changes in input and output price aggregation weights. The results indicate that agricultural TFP growth accelerated in the 1970s and 1980s but stagnated in the 1990s. Without new efforts to increase productivity in agriculture, Indonesia’s goal of using agricultural growth to gener-ate broad-based rural development and further reduce poverty may be under-mined.
INTRODUCTION
During the latter half of the 20th century, rising output per hectare replaced expansion of crop land as the predominant source of agricultural growth in most of the world (Hayami and Ruttan 1985). This transition from agricultural exten-sification to intenexten-sification was most noticeable in Asia, where population den-sity is relatively high and land scarcity most acute. In this paper, I examine the performance of agricultural productivity in Indonesia during the last 40 years of the 20th century. Although agriculture’s share of the economy declined over this period, at the end of the century it still provided the main livelihood for half of the nation’s population, or over 100 million people. Sustaining productivity growth in agriculture can make a significant contribution to food security, poverty reduction and broad-based economic growth.
Assessing the productivity performance of the agricultural sector in Indonesia has been difficult because of the lack of appropriate data. Significant improve-ments in agricultural input and output measurement provided by Van der Eng (1996) have, however, eased this task. In particular, the author provides improved estimates of agricultural crop land in Indonesia that differ markedly from the agricultural land use data provided by the Food and Agriculture Organization (FAO), the primary source of data used in previous assessments of productivity growth in Indonesia (e.g. Mundlak, Larson and Butze 2002; Suhariyanto 2001). In addition, previous studies of agricultural growth have sometimes used changes in agricultural value added rather than changes in output quantities (Van der Eng 1996; Mundlak, Larson and Butze 2002), a practice that confounds the effect of changes in productivity and changes in terms of trade on agricultural growth. The series I develop for the rate of real output growth differs greatly from the rate of change in agricultural GDP.
In this study, I use time series of 49 categories of crop and livestock outputs and 19 categories of inputs, with their respective prices, to construct a Tornqvist– Theil chain index of total factor productivity (TFP) between 1961 and 2000. A TFP index is simply the ratio of an output index to an input index. Therefore, growth in TFP is the residual share of output growth after accounting for percentage changes in land, labour and other conventional factors of production. Changes in TFP can be interpreted as a measure of the collective contribution of non-conven-tional inputs in agriculture, such as improvements in input quality, economies of scale and technology (Alston, Norton and Pardey 1995). Using a Tornqvist–Theil index reduces the bias that arises in fixed-weight indices when price weights change over time. Recent studies of agricultural productivity growth in India (Fan, Hazell and Thorat 1999) and China (Fan and Zhang 2002) have found this approach to give significantly different results from TFP indices based on a con-stant set of aggregation weights.
In general, my approach finds a faster rate of input growth (especially more land expansion) and a slower rate of output growth than previous studies of agri-cultural growth in Indonesia. In particular, I find that agriagri-cultural productivity in Indonesia stagnated in the 1990s after two decades of rapid growth. What emerges from this exercise is a picture that raises concern for the future perform-ance of Indonesia’s agriculture and the welfare of the people who depend on it for their livelihood. I conjecture that without major increases in public and pri-vate investment in the sector, agriculture will not return to a path of sustained productivity growth.
METHODOLOGY
Productivity can be defined as a ratio of output to inputs used in production. An increase in the amount of output per unit of inputs, equivalent to an outward shift in a production function, is then measured as an increase in factor produc-tivity. Partial productivity indices, such as output per worker, give the ratio of output to a single factor of production. However, since the amounts of other inputs may vary, increases in output per worker can result from either increases in the use of other inputs or changes in technology. A TFP index compares changes in output with changes in aggregate inputs. Changes in TFP provide a better picture of changes in technology and other unmeasured improvements in the means of production (such as improvements in input quality). In applications of TFP measurements to agriculture, it is common to aggregate outputs and con-ventional inputs using market or shadow prices as weights. The theoretical underpinnings of TFP index measurement assume that producers maximise prof-its, that output markets are competitive and that the production technology is characterised by constant returns to scale. Under these conditions, total revenue will equal total costs, the elasticity of output with respect to each input is equal to its factor share, and TFP growth can be estimated using observed input and output quantities and prices (Alston, Norton and Pardey 1995).
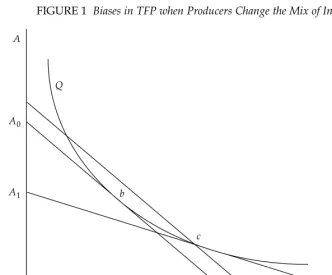
A well known limitation of index numbers is that changes in input prices over time may lead to biases in the measurement of TFP because producers change the mix of inputs in response to such price changes. To illustrate, figure 1 shows an isoquant (Q) of a production function in which two inputs, Land A, are used to
produce a commodity. The ratio of input prices is given by w0, and point bis the cost-minimising combination of Land Ato produce the level of output indicated by the isoquant. Now suppose that technical change results in fewer inputs being required to produce a given amount of output, so that the isoquant in the dia-gram now indicates a higher level of output than previously. A true index of pro-ductivity growth should measure the proportional change in the output level rep-resented by this isoquant.
If the prices of inputs remain unchanged, this is given by the increase in out-put for the given aggregate inout-put cost (A0, using Aas the numeraire). However, if the price of Lrelative to Adeclines (from w0to w1), then the optimal input com-bination for the new, higher level of output becomes point c. At the old relative price level, cis more costly than b, so if input costs are aggregated using observed quantities together with the initial prices as aggregation weights, moving from point bto point cwould imply an increasein aggregate inputs to produce the now higher level of output. This would result in underestimation of the actual change in productivity. On the other hand, if the new prices are used to aggregate inputs, then input combination cwill appear cheaper (A1) than that at b, falsely magnify-ing the observed improvement in TFP. Similar problems are encountered in aggregating across multiple outputs (Alston, Norton and Pardey 1995).
The Tornqvist–Theil chain-weighted index minimises the effect of changes in price weights on output and input aggregation by allowing the weights to adjust over time as prices change.
FIGURE 1 Biases in TFP when Producers Change the Mix of Inputsa
aSee text for explanation of terms.
A
A0
A1
Q
b
c
w0 w1
L
The Tornqvist–Theil index of output in year tis defined as
(1)
where Ri,tis the revenue share of output iand Yi,tis the quantity of output iin year t. Thus, the growth rate of aggregate output Ybetween period tand t–1 is a sum of the growth rates of the n commodities that make up total output, each weighted by the average of their revenue shares during tand t–1.
Similarly, the aggregate input index is defined as
(2)
where the growth rate of aggregate input Xbetween period tand t–1 is the sum of the growth rates of the j= 1,2,…mcategories of inputs, each weighted by the average of their factor shares Sjduring adjacent periods. (A ‘factor share’ is the
proportion of total cost paid for an input.)
The proportional change in TFP between period tand t–1 is then given as
(3)
Estimation requires data on the quantities and prices of each output and input for each period. For comparative purposes, I also estimate Paasche indices of out-put, input and TFP, in which end-period prices are used as fixed weights to aggre-gate items over the entire series. Comparison between the Tornqvist–Theil and Paasche indices gives an indication of the size of the bias resulting from fixed weights.
DATA
The lack of reliable time series data on agricultural production and input use in Indonesia has been a limiting factor in previous attempts to quantify productiv-ity growth (Booth 1988; Van der Eng 1996; Arnade 1998; Suhariyanto 2001; Mundlak, Larson and Butze 2002). Agriculture is generally defined to include crops, livestock, fresh water and marine fisheries, and forestry. But most studies on agricultural productivity growth focus on crop and livestock agriculture because of serious deficiencies in measuring outputs and inputs used in fisheries and forestry (Craig, Pardey and Roseboom 1997). This study follows that practice as well.
Measurement uncertainties also affect crop and livestock production and input use. On the output side, some studies have used the national accounts value of agricultural production or value added (GDP) as a measure of aggregate output (e.g. Van der Eng 1996; Arnade 1998; Suhariyanto 2001; Mundlak, Larson and Butze 2002). But using value added confounds quantity and terms of trade effects on changes in output. For example, if agricultural prices fell relative to
non-(
1)
(
1)
agricultural prices, this would reduce agricultural GDP even if output was con-stant. Further, deriving real changes in agricultural GDP depends critically on the choice of inflation deflator. For periods of high inflation such as during the early 1960s, the CPI and GDP deflators available for Indonesia are subject to a wide margin of error. Instead, I use revenue and factor shares calculated to current prices to construct aggregation weights. This avoids having to use an inflation deflator altogether. For inputs, FAO estimates of agricultural land in Indonesia are highly suspect. While agricultural land is inherently difficult to define and measure, Van der Eng (1996) has significantly improved the record of agricultural land change in Indonesia.
In the remainder of the paper, data sources are represented by ‘FAO’ for the FAO’s FAOSTAT series (FAO 2001), ‘BPS’ for statistics from the Indonesian Central Statistics Agency (Statistical Yearbook of Indonesiaunless otherwise noted) (BPSa, BPSb, BPSc), ‘MOA’ for sources from the Ministry of Agriculture (MOA 1999, various issues) and ‘VDE’ for data series reported in Van der Eng (1996). I discuss the land measurement issue in more detail below.
Crop and Livestock Output
FAO production data are used to measure outputs of food, horticultural and non-food crops, and meat, milk and eggs since 1961. The FAO production data are equivalent to the agricultural output data reported in BPSa, but include a larger set of commodities. For crop and livestock production, I measure these in metric tonnes net of seed and animal feed requirements.
Crop and Livestock Product Prices
Consistent, long-term time series of producer prices for agricultural commodities in Indonesia are difficult to find, except for the most important crops such as rice, rubber and palm oil. FAO provides a ‘producer’ price series for most commodi-ties from the mid 1960s, but in fact these price series may represent farmgate, rural or urban wholesale prices, depending on the country and commodity. VDE also supplies price series for several major food and non-food crops that the author calls ‘rural bazaar prices’. For many commodities, both the FAO and VDE price data are close to or the same as the Jakarta wholesale prices reported in the BPS statistical yearbooks. For this study I used BPS annual price series for 17 commodities reported in various issues of the annual Statistical Yearbook of Indonesia and Agricultural Indicators. These commodities account for more than three-quarters of the value of total crop–livestock output. Prices for another 18 commodities (mostly horticultural products) were taken from selected publica-tions of the Ministry of Agriculture.1MOA price data are also mostly urban or
Jakarta wholesale prices. FAO producer prices were used for another 14 com-modities, accounting for about 7.5% of output value. VDE price data were used for tobacco, and to supplement MOA data for palm oil and cane sugar prices prior to 1986 and 1990 respectively.2
For some commodities, consistent price series were established in Indonesia only in the late 1960s or early 1970s. For missing years, the average normalised price (commodity price relative to the price of rice) for the nearest five-year period for which price data were available was used to extend the series back to 1961. These relative prices were then used to construct revenue shares for those
years. In summary, then, the agricultural product prices used in this study are a generally consistent time series of prices at the Jakarta wholesale level.
Crop Land
Historical data on agricultural land use in Indonesia are generally unreliable or unavailable except for recent years.3Since the 1980s, BPSa has published
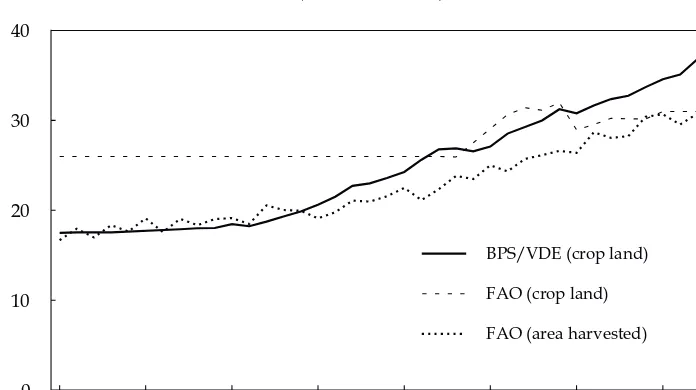
reason-ably good estimates, by province, of land area in sawah(bunded land for paddy rice, irrigated and non-irrigated), land area planted to garden crops, land area planted to upland crops (including fallow land) and land area planted to perma-nent crops (perennials). VDE extends these series back to 1880 and provides sep-arate series for Java and non-Java. While FAO has been the primary source of data on agricultural land for most previous studies of agricultural growth in Indonesia (Arnade 1998; Suhariyanto 2001; Mundlak, Larson and Butze 2002), the FAO land series differs markedly from the BPS and VDE land use estimates (figure 2). The BPS/VDE data show that agricultural crop land in Indonesia expanded from about 17 million hectares in the 1960s to over 37 million hectares in the 1990s, with virtually all of the expansion occurring outside Java. This series tracks closely the trend in area harvested reported by FAO.4The FAO series on arable
land and land under permanent crops, on the other hand, shows a constant 26 million hectares of crop land in Indonesia until the mid 1980s, followed by uneven growth to 31 million hectares by the mid 1990s. The FAO agricultural land data are consistent neither with what we know from casual observation to have occurred over these decades nor with published government statistics on land use in the country. And the differences are substantial: while the FAO data show a declining land-to-labour ratio in Indonesia, the BPS/VDE data show that available crop land per agricultural worker actually increased during the 1961–2000 period for the country as a whole (but did decline in Java).
FIGURE 2 Estimates of Agricultural Crop Land in Indonesiaa (million hectares)
1961 1966 1971 1976 1981 1986 1991 1996
0 10 20 30 40
BPS/VDE (crop land)
FAO (crop land)
FAO (area harvested)
aSee text for explanation of terms.
In this study I use the BPS/VDE estimates of crop land, that is, land planted to crops, fallow land and land planted to perennials (permanent crops). Crop land is further divided into two land quality types: irrigated and non-irrigated crop land. Since price series are unavailable for crop land, I follow Mundlak, Larson and Butze (2002) in giving irrigated land 2.5 times the value of non-irrigated land. The service flow (price weight) of irrigated and non-irrigated crop land is then estimated as a residual—the remainder of total output after paying for agricul-tural labour, fertiliser, machinery and livestock.
Labour and Wages
Data on two categories of labour—adult male and adult female workers employed in agriculture—are from FAO. Daily wages for male and female work-ers are from VDE and refer to average wages paid by plantations. Agricultural wages are extended beyond 1996 using data from BPSc. To find total annual labour costs, daily wages (in rice equivalents) are multiplied by 300 days worked per year for men and 250 days worked per year for women. There is evidence that farm work by households claiming agriculture as their principal occupation may have declined over time as they diversified into more non-farm activities. Booth (2002), for example, found that between the 1983 and 1993 agricultural censuses the share of farm income in the total income of agricultural households declined from 55% to 50%. The diversification into non-farm work was especially signifi-cant for households with very little land. To examine the implications of labour diversification for the measurement of agricultural productivity, I developed an alternative measure of labour inputs, by assuming that from 1970 onwards the average time spent per worker in agriculture declined by two days per year. In percentage terms this is slightly less than the decline in the share of farm income in total household income estimated by Booth, to reflect (probably) higher aver-age returns to labour in non-farm occupations. Aggregate input and productivity indices with and without this adjustment for declining labour intensity in agri-culture are reported in the results.
Fertiliser
Annual applications of chemical fertilisers—nitrogen (N), phosphorus (P2O5) and potash (K2O)—are from FAO. Prices paid for fertiliser are from VDE, updated since 1996 using BPSb. From the early 1970s until 1999, chemical fertilisers were heavily subsidised in Indonesia, sometimes by as much as 50% of the actual cost. This raises the question of whether fertiliser inputs should be weighted by their social or private costs. Private costs (at the subsidy price) are used in this study to conform with the theory underpinning the index number approach to measur-ing productivity. However, despite rapid growth in fertiliser application durmeasur-ing the last several decades, the share of fertiliser in total costs has remained small. Even at the social cost of fertiliser, total (private and government) expenditure on fertiliser has rarely exceeded 4% of the value of agricultural output.
Agricultural Machinery
Agricultural machinery is measured in terms of horsepower available from trac-tors and threshers used in agriculture. Machinery includes two-wheel tractrac-tors, small, medium and large four-wheel tractors, and power threshers. Machinery data are from FAO, supplemented by a more detailed breakdown of machinery
by type published in BPSa. Machinery prices are FAO import values amortised over five years to derive an annual service flow.
Livestock
Livestock contribute to agriculture in several ways. In addition to yielding meat, hides, milk and eggs, they provide power, fertiliser and offspring, and serve as a store of wealth. I measure livestock inputs as the total annual stock of buffalo, beef cattle, dairy cows, horses, pigs, small ruminants and poultry. Data on animal stocks are from FAO. The relevant price weight for an animal input is the value of services from that animal in a given year, and not its stock value. This is important for animals that provide services for several years, such as large ruminants. Prices for live animals are derived from FAO agricultural trade statistics. For cattle, buf-falo and horses, the annual service flow is approximated by dividing the unit value of imported live cattle by three. The assumption here is that the cattle price reflects the present value of lifetime animal services, and that cattle have a work-ing life of about three years on average. The unit value of imported sheep is used for sheep and goats. Unit export values are used as prices for pigs and poultry.
RESULTS
Agricultural Output Growth
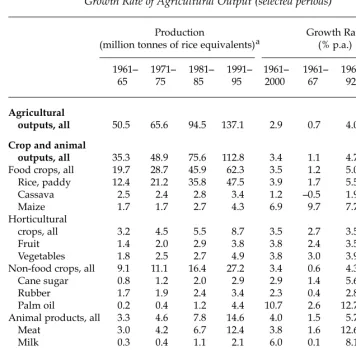
Indonesia produces a diverse set of agricultural commodities. Food crop produc-tion is dominated by rice, but also includes several secondary food crops, espe-cially cassava and maize. Non-food crops include rubber, palm oil, coffee, tea, cacao, sugar cane, coconut and numerous other species. Poultry has been the fastest growing component of animal production, but large and small ruminants and pigs are also significant. Besides crops and animal products, fresh water and marine fisheries and forestry are important components of Indonesia’s agricul-tural sector. Table 1 shows the changing level and composition of agriculagricul-tural output in Indonesia since 1961. The first four columns report average yearly out-put levels during the first half of each decade in terms of ‘rice equivalents’, where commodities are valued and aggregated by their current price relative to the price of rice. Between 1961–65 and 1991–95, total annual agricultural output increased from 50.5 million tonnes to 137.1 million tonnes of rice equivalents. Rice was by far the most important commodity, accounting for about 25% of total agricultural output in the early 1960s and nearly 35% of total output in the early 1990s. Among non-food crops, palm oil grew very rapidly, especially after 1980. Meat and milk production also gained in output share. According to the figures, pro-duction of forest products hardly grew at all over the four decades, but these fig-ures are probably not reliable.
In assessing overall growth of the Indonesian agricultural sector since 1961, I distinguish three periods. The first, 1961–67, was a time of economic and politi-cal instability in Indonesia. Non-food crop production fell sharply following the nationalisation of foreign-owned estates, and food crop production barely kept pace with population growth. Indonesian agriculture was probably operating inefficiently during this period, inside the production function frontier. During the second period, 1968–92, Indonesia sustained rapid growth in both crop and animal production, with average annual output growth of around 4%. Green
olution technologies brought large increases in rice yield, and the area under non-food crops grew rapidly outside Java. However, growth began to slow during the late 1980s and stagnated in the 1990s. During the third period, 1993–2000, output growth averaged only 1% per year. Indonesia suffered from weather-induced and macroeconomic shocks during the latter part of the 1990s that exacerbated the slowdown in output growth, but the slowdown appears to have begun before these shocks.
TABLE 1 Average Annual Level, Composition and Growth Rate of Agricultural Output (selected periods)
Production Growth Rate
(million tonnes of rice equivalents)a (% p.a.)
1961– 1971– 1981– 1991– 1961– 1961– 1968– 1993–
65 75 85 95 2000 67 92 2000
Agricultural
outputs, all 50.5 65.6 94.5 137.1 2.9 0.7 4.0 1.0
Crop and animal
outputs, all 35.3 48.9 75.6 112.8 3.4 1.1 4.7 1.2
Food crops, all 19.7 28.7 45.9 62.3 3.5 1.2 5.0 0.4
Rice, paddy 12.4 21.2 35.8 47.5 3.9 1.7 5.5 0.7
Cassava 2.5 2.4 2.8 3.4 1.2 –0.5 1.9 0.2
Maize 1.7 1.7 2.7 4.3 6.9 9.7 7.7 2.5
Horticultural
crops, all 3.2 4.5 5.5 8.7 3.5 2.7 3.5 4.2
Fruit 1.4 2.0 2.9 3.8 3.8 2.4 3.5 5.7
Vegetables 1.8 2.5 2.7 4.9 3.8 3.0 3.9 3.9
Non-food crops, all 9.1 11.1 16.4 27.2 3.4 0.6 4.3 2.7
Cane sugar 0.8 1.2 2.0 2.9 2.9 1.4 5.6 –4.1
Rubber 1.7 1.9 2.4 3.4 2.3 0.4 2.8 1.8
Palm oil 0.2 0.4 1.2 4.4 10.7 2.6 12.7 10.2
Animal products, all 3.3 4.6 7.8 14.6 4.0 1.5 5.7 0.7
Meat 3.0 4.2 6.7 12.4 3.8 1.6 12.6 3.9
Milk 0.3 0.4 1.1 2.1 6.0 0.1 8.1 3.5
Fish products 2.9 3.9 6.4 11.1 4.4 4.6 4.4 4.3
Forest products 12.3 12.8 12.4 13.2 –0.5 –1.5 0.7 –3.5
aTo aggregate agricultural output, I weight each commodity by the ratio of its current price
to the current price of rice. Thus, output is measured as millions of tonnes of ‘rice equiva-lents’, or its value in terms of rice. I chose rice as the output numeraire because of its strate-gic importance to Indonesia and because in most years it accounts for more than 30% of agricultural output.
Sources: Commodity production: FAO (2001); commodity prices: BPSa, BPSb; MOA (vari-ous issues); FAO (2001); Van der Eng (1996).
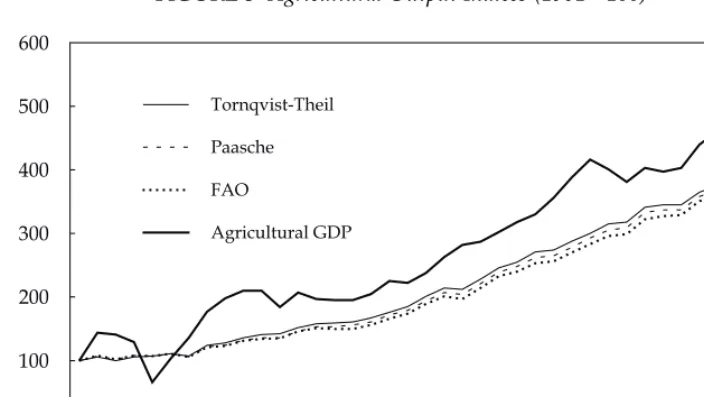
Indices of agricultural output are shown in figure 3, with annual growth rates for different periods given in table 2. (Here, agricultural production includes only crop and animal components; fisheries and forestry production have been ex-cluded because of the unreliability of the data.) For comparative purposes, I have also constructed a Paasche index, which uses fixed weights to aggregate outputs based on average end-period prices (the average value of normalised commodity prices during 1996–2000). The Tornqvist–Theil, Paasche and FAO indices are quantity-based, while the agricultural GDP index is a value-of-production index. The Tornqvist–Theil index shows that agricultural output increased by 272% between 1961 and 2000, slightly faster than is indicated by the Paasche index (264% over the period). This difference between the two indices gives an indica-tion of the extent of bias from using fixed weights for aggregaindica-tion. The FAO pro-duction index also uses fixed weights based on a global set of commodity prices. It shows somewhat slower growth in agricultural output: 254% over the 40 years. All three indices show that the rate of output growth in Indonesian agriculture slowed significantly in the 1990s.
All the output indices show that the years between 1968 and 1992 were excep-tionally good for Indonesian agriculture, with annual growth averaging 4.6–4.8% (table 2). However, the quantity-based indices indicate that growth in the years before and after this green revolution period was considerably slower, at 1.1–1.3% p.a. The very high growth shown by the GDP index during the hyperinflation years of 1961–67 may partly be attributable to errors in the CPI. However, choice of deflator does not explain the differences in growth between agricultural GDP and the quantity-based indices after 1993. It is possible that the growth in value of output (after discounting for general inflation) during the 1990s was primarily due to terms of trade effects, and not to increases in the quantity of production.
FIGURE 3 Agricultural Output Indices (1961 = 100)a
1961 1966 1971 1976 1981 1986 1991 1996
0 100 200 300 400 500 600
Tornqvist-Theil
Paasche
FAO
Agricultural GDP
aSee text for explanation of terms.
Agricultural Input Use
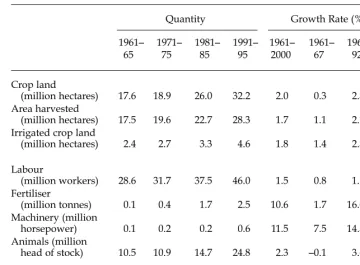
Table 3 provides a breakdown of inputs used in Indonesian agriculture during the first half of each of the past four decades, plus average annual growth rates over the entire period and during the three periods of instability, growth and stagnation described above. Crop land expanded by about 2% per year during 1961–2000, even in the last decade of the century. Virtually all of the expansion occurred outside Java, especially on the relatively sparsely populated islands of Kalimantan, Sumatra and Sulawesi. Irrigated crop land expanded by 1.8% per year, slightly less than the overall growth in crop land. The agricultural labour force also grew continuously over the four decades, and was still growing by about 1% per year in the 1990s. However, this may overstate actual growth in labour if agricultural households expanded their non-farm activities during this period (and reduced the amount of time spent in agricultural pursuits).
The number of farm animals grew by an average of 2.3% p.a. during 1961– 2000, but growth was highly variable within this period. A large share of this growth was in poultry, which relied heavily on imported feed. The number of livestock fell sharply during the economic crisis of 1997–98, when the cost of imported feed increased several-fold as the rupiah lost most of its exchange value.
Growth in industrial inputs used in agriculture, namely fertiliser and machin-ery, was very rapid, averaging more than 10% p.a. between 1961 and 2000. However, use of these inputs started from a very small base, and industrial input use per hectare remained small by Asian standards (Mundlak, Larson and Butze 2002). From 1993 there was virtually no growth in fertiliser use, and per hectare application actually declined. The slowdown in fertiliser use can be attributed in
TABLE 2 Average Annual Growth in Agricultural Output (%)
Tornqvist–Theil Paasche FAO Index of
Index Index Index Agricultural GDP
(chain (fixed (fixed (deflated by
weights) weights) weights) CPI)
By decade
1961–70 3.7 3.3 3.2 13.5
1971–80 4.0 4.0 3.8 1.5
1981–90 4.6 4.7 4.6 5.4
1991–2000 1.7 1.8 1.9 3.0
By period
1961–2000 3.5 3.4 3.4 5.7
1961–67 1.2 1.1 1.2 12.2
1968–92 4.8 4.7 4.6 4.7
1993–2000 1.1 1.2 1.3 3.7
Sources: Tornqvist–Theil and Paasche indices: author’s estimates; FAO index: FAO (2001); agricultural GDP and CPI: BPSa.
FIGURE 4 Aggregate Input Use and TFP in Agriculture (1961 = 100)a
1961 1966 1971 1976 1981 1986 1991 1996
0 50 100 150 200 250
Tornqvist-Theil input
Paasche input
Tornqvist-Theil TFP
Paasche TFP
TABLE 3 Average Annual Quantity and Growth Rate of Inputs Used in Agriculture
Quantity Growth Rate (% p.a.)
1961– 1971– 1981– 1991– 1961– 1961– 1968– 1993–
65 75 85 95 2000 67 92 2000
Crop land
(million hectares) 17.6 18.9 26.0 32.2 2.0 0.3 2.3 2.1
Area harvested
(million hectares) 17.5 19.6 22.7 28.3 1.7 1.1 2.1 0.8
Irrigated crop land
(million hectares) 2.4 2.7 3.3 4.6 1.8 1.4 2.3 0.3
Labour
(million workers) 28.6 31.7 37.5 46.0 1.5 0.8 1.7 1.1
Fertiliser
(million tonnes) 0.1 0.4 1.7 2.5 10.6 1.7 16.0 0.1
Machinery (million
horsepower) 0.1 0.2 0.2 0.6 11.5 7.5 14.3 5.9
Animals (million
head of stock) 10.5 10.9 14.7 24.8 2.3 –0.1 3.6 –0.3
Fertiliser/crop land
(kg/ha) 6.9 22.7 64.0 76.3 8.5 1.3 13.6 –2.0
Sources: Crop land and irrigated crop land: BPSa; Van der Eng (1996); others: FAO (2001).
aSee text for explanation of terms.
part to farmers’ rising real costs. The level of fertiliser subsidy was as high as 50% from the mid 1970s to the mid 1980s, but then declined gradually. The subsidy finally ended in 1999.
Trends in aggregate input use in Indonesian agriculture are shown in figure 4. The Tornqvist–Theil input index is based on actual factor shares paid for inputs, while the Paasche input index uses average real input prices during 1996–2000 as fixed weights for input aggregation. These indices generate nearly identical results, both showing that aggregate input use increased by 96% between 1961 and 2000. If we assume a decline in labour intensity since 1970 (fewer days worked per agricultural worker per year), this reduces the estimated gain in aggregate agricultural inputs by 4% (from 96% to 92% over the whole period).
Agricultural TFP
With estimates of aggregate outputs and inputs, the index of TFP for Indonesian agriculture is found simply by taking the ratio of the output index to the input index (figure 4, with annual growth rates given in table 4). The Tornqvist–Theil TFP index indicates that TFP grew by 90% between 1961 and 2000, or by 93% assuming declining labour intensity on the part of agricultural workers. The error in the Paasche output index (which underestimated growth) is also reflected in the Paasche TFP index (underestimating TFP growth by 4 percentage points over the 40-year period). All three indices show that growth in TFP was rapid during the green revolution decades, but began to slow in the 1980s and fell to less than 0.5% p.a. in the 1990s. Since 1993 there has been no growth at all in TFP.
TABLE 4 Average Annual Growth in Aggregate Input Use and TFP in Agriculture (%)
Paasche Tornqvist–Theil Paasche Tornqvist–Theil
Input Input Index TFP TFP Index
Index Index
(fixed (chain (declining (fixed (chain (declining
weights) weights) labour weights) weights) labour
intensity) intensity)
By decade
1961–70 0.6 0.6 0.6 2.7 3.1 3.1
1971–80 1.8 1.9 1.8 2.1 2.1 2.1
1981–90 3.1 3.1 3.0 1.5 1.5 1.6
1991–2000 1.4 1.3 1.3 0.4 0.4 0.4
By period
1961–2000 1.8 1.8 1.7 1.7 1.7 1.8
1961–67 0.5 0.5 0.5 0.6 0.8 0.8
1968–92 2.2 2.2 2.2 2.5 2.5 2.6
1993–2000 1.2 1.2 1.1 –0.1 –0.1 0.0
Source: Author’s estimates.
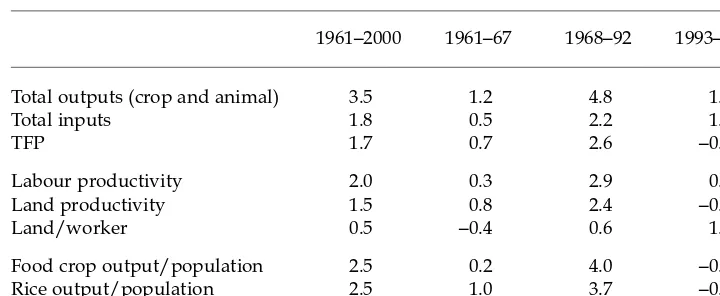
With these estimates, it is possible to decompose total growth in output into a component due to increases in conventional factors of production and a compo-nent due to productivity improvement. Table 5 summarises the results. Between 1961 and 2000, average annual growth in agricultural crop and livestock produc-tion in Indonesia was 3.5%, of which 1.8% was due to increases in land, labour and other conventional inputs and 1.7% was due to improvements in TFP. Increases in TFP were most evident in 1968–92, with little change either before or since these years. The growth in agricultural output since 1993 (about 1.1% p.a.) was entirely due to increases in conventional agricultural inputs, especially land and labour. These general findings are not appreciably affected by our assump-tions about labour intensity per worker in agriculture.
Output per agricultural worker increased by an average of 2% p.a. between 1961 and 2000. Most of this was due to increases in output per hectare of crop land, but crop land per worker also increased. In fact, land per worker was grow-ing by about 1% p.a. even as late as the 1990s, despite the continued increase in the number of workers employed in agriculture. Virtually all of the land expan-sion occurred outside Java and Madura; these densely populated islands actually lost crop land in the 1990s (BPSa).
The final two rows of table 5 give an indication of food security in Indonesia by comparing growth in food production to population growth. By these meas-ures Indonesia’s food economy performed remarkably well during the final decades of the 20th century. Per capita production of both rice and all food crops grew at an annual rate of 2.5% during 1961–2000. However, per capita food pro-duction went into decline in the 1990s, when TFP growth in Indonesian agricul-ture stagnated.
TABLE 5 Average Annual Growth in Productivity in Agriculture (%)
1961–2000 1961–67 1968–92 1993–2000
Total outputs (crop and animal) 3.5 1.2 4.8 1.1
Total inputs 1.8 0.5 2.2 1.2
TFP 1.7 0.7 2.6 –0.1
Labour productivity 2.0 0.3 2.9 0.1
Land productivity 1.5 0.8 2.4 –0.9
Land/worker 0.5 –0.4 0.6 1.0
Food crop output/population 2.5 0.2 4.0 –0.4
Rice output/population 2.5 1.0 3.7 –0.3
Sources: Total output, input and TFP growth is derived from the Tornqvist–Theil output, input and TFP given in tables 2 and 4. Labour is found by dividing aggregate output (see table 1 for sources) by total agricultural labour (see table 3 for sources). Land productivity is derived in the same way. Land/worker is crop land per agricultural worker (see table 3 for sources). Food crop output is the sum of rice, cassava, maize, bean and sweet potato output measured in rice equivalents (see table 1 for sources). Population is from BPSa.
CONCLUSIONS AND IMPLICATIONS
Improvements in the data series for Indonesian agriculture provide an opportu-nity to reassess the productivity performance of this sector during the closing decades of the 20th century. By constructing a Tornqvist–Theil index of input, output and TFP growth, I have been able to minimise the bias inherent in index measures when price weights change over time. My estimation showed that between 1961 and 2000, about half of the growth in agricultural output could be attributed to an expansion of conventional inputs (crop land, labour, livestock, fertiliser and machinery) and about half to TFP. The use of modern industrial inputs (chemical fertilisers and power machinery) grew rapidly from very low initial levels. Nearly all of the growth in TFP occurred between 1968 and 1992, however. By the 1990s, agricultural growth once more relied almost entirely on increases in conventional factors as productivity stagnated.
Recent work on agricultural productivity assessments for China (Fan and Zhang 2002) and India (Fan, Hazell and Thorat 1999) allow some comparisons among the performances of the three largest agricultural economies in Asia since 1970. Indonesia depended upon resource expansion (in particular, bringing new crop land into production) more heavily than either China or India. In China, TFP improvements accounted for 62% of agricultural growth, and in India, more than 70%. Both China and India were able to sustain growth in their agricultural sec-tors during the 1990s whereas agricultural growth in Indonesia slowed signifi-cantly as TFP stagnated.
While a rigorous examination of the underlying causes of the productivity slowdown in Indonesian agriculture is beyond the scope of this study, I can sug-gest some probable causes. Drought-inducing El Niño and macroeconomic shocks took their toll on agricultural production in the late 1990s (especially in 1996–98), but the slowdown in productivity appears to have preceded these events, and has continued since. Probably a more important explanation for the productivity slowdown is that once the initial gains made possible by the green revolution were exhausted, public and private investments in agriculture were not sufficient to sustain further productivity growth. Both government spending and private investment in agriculture have fallen since the mid 1980s as a percentage of agri-cultural GDP (Fuglie and Piggott, forthcoming). While much of the decline in gov-ernment support for agriculture came about through a reduction in fertiliser sub-sidies (which probably had low returns, especially in later years), the decline also extended to investments with a higher pay-off such as rural infrastructure and agricultural research and extension (Fuglie and Piggott, forthcoming).5 Private
sector investment in agriculture fell drastically during the financial crisis of 1997–98. It is unlikely to recover unless the overall investment climate in Indonesia improves and complementary infrastructure investments that can only be made by the public sector are forthcoming.
The stagnation of TFP growth has serious implications for the long-term per-formance of Indonesian agriculture. Indonesia will find it increasingly difficult to expand agricultural land, and without growth in TFP, agricultural output will continue to grow only very slowly. This will speed the drain of resources away from agriculture and rural areas to other sectors of the economy. While move-ment of labour out of agriculture is a natural consequence of economic develop-ment, this transition will be suboptimal if high pay-off investment opportunities
in agriculture are forgone, thus undermining the potential contribution of agri-cultural development to reducing poverty and generating broad-based economic growth for the Indonesian economy.
NOTES
1 These sources include Vademekum Pemasaranfor horticultural crops (Jakarta wholesale
prices) (MOA 1999) and Statistics for Estate Crops of Indonesiafor cacao beans, palm oil
and cane sugar (domestic market prices) (MOA, various issues).
2 VDE and MOA prices for palm oil were identical for the overlapping years 1986–96, so
these series appear to be from the same source. For cane sugar, VDE reports a ‘Sura-baya export price’ that was consistently below the MOA domestic market price of cane sugar by 8–14% for the overlapping years in the series (1990–96). To develop a consis-tent price series for 1961–2000, I used MOA prices for 1990–2000 and VDE prices for 1961–89 multiplied by 1.12.
3 See Booth (1988: 264–71) for a thorough discussion of Indonesian land use statistics.
4 Harvested area differs from crop land in that the former does not include fallow land
or land planted to immature perennials, and double counts land where two crops are harvested in a year.
5 The studies on agricultural growth in India and China by Fan and his colleagues found
strong correlations between public spending on agricultural research/rural infrastruc-ture and agricultural productivity growth in those countries (Fan and Zhang 2002; Fan,
Hazell and Thorat 1999). For Indonesia, Salmon (1991) and Evenson et al. (1997) found
high rates of return to food crop research in the 1970s and 1980s, mainly because the programs studied helped to adapt and disseminate high-yielding varieties made avail-able by international investments in the green revolution. Once the easy gains from these technologies were achieved, productivity growth was not sustained. Unlike its larger Asian neighbours, Indonesia does not yet appear to have developed an agricul-tural research system capable of sustaining productivity growth.
REFERENCES
Alston, Julian M., George W. Norton and Philip G. Pardey (1995), Science under Scarcity:
Principles and Practice for Agricultural Research Evaluation and Priority Setting, Cornell University Press, Ithaca NY.
Arnade, Carlos (1998), ‘Using a Programming Approach to Measure International
Agricultural Efficiency and Productivity’, Journal of Agricultural Economics49: 67–84.
Booth, Anne (1988), Agricultural Development in Indonesia, Allen & Unwin, Sydney.
Booth, Anne (2002), ‘The Changing Role of Non-farm Activities in Agricultural
Households in Indonesia: Some Insights from the Agricultural Censuses’, Bulletin of
Indonesian Economic Studies38 (2): 179–200.
BPSa (Badan Pusat Statistik) (various issues), Statistical Yearbook of Indonesia, Jakarta.
BPSb (various issues), Agricultural Indicators, Jakarta.
BPSc (various issues), Farm Cost Structure of Paddy and Secondary Food Crops, Jakarta.
Craig, Barbara J., Philip G. Pardey and Johannes Roseboom (1997), ‘International Productivity Patterns: Accounting for Input Quality, Infrastructure, and Research’,
American Journal of Agricultural Economics79 (November): 1,064–76.
Evenson, Robert E., Edi Abdurachman, Budiman Hutabarat and Achmat C. Tubagus (1997), ‘Contribution of Research on Food and Horticultural Crops in Indonesia: An
Economic Analysis’, Ekonomi dan Keuangan IndonesiaXLV (4): 551–78.
Fan, Shenggen, and Xiaobo Zhang (2002), ‘Production and Productivity Growth in
Chinese Agriculture: New National and Regional Measures’, Economic Development and Cultural Change50 (4): 819–38.
Fan, Shenggen, Peter Hazell and Sukhadeo Thorat (1999), ‘Linkages between Government
Spending, Growth, and Poverty in Rural India’, Research Report 110, International Food
Policy Research Institute, Washington DC.
FAO (Food and Agriculture Organization) (2001), FAOSTAT Agricultural Databases, Rome.
Fuglie, Keith O., and Roley R. Piggott (forthcoming), ‘Agricultural R&D Policy in
Indonesia’, in P.G. Pardey, J.M. Alston and R.R. Piggott (eds),Agricultural Research Policy
in the Developing World, International Food Policy Research Institute, Washington DC.
Hayami, Yujiro, and Vernon W. Ruttan (1985), Agricultural Development: An International
Perspective, Johns Hopkins University Press, Baltimore MD.
MOA (Ministry of Agriculture) (1999), Vademekum Pemasaran 1990–1999, Directorate
General of Food Crops and Horticulture, Ministry of Agriculture, Jakarta.
MOA (various issues), Statistics for Estate Crops of Indonesia 1990–1999, Directorate General
of Estate Crops, Ministry of Agriculture, Jakarta.
Mundlak, Yair, Donald F. Larson and Rita Butze (2002), ‘Determinants of Agricultural
Growth in Thailand, Indonesia, and the Philippines’, Discussion Paper No. 302, Center
for Agricultural Economic Research, Hebrew University of Jerusalem.
Salmon, David. C. (1991), ‘Rice Productivity and the Returns to Rice Research in
Indonesia’, in R.E. Evenson and C.E. Pray (eds), Research and Productivity in Asian
Agriculture, Cornell University Press, Ithaca NY: 133–57.
Suhariyanto, Kecuk (2001), ‘Agricultural Productivity Growth in Asian Countries’, in G.H.
Peters and P. Pingali (eds), Tomorrow’s Agriculture: Incentives, Institutions, Infrastructure
and Innovations, Proceedings of the 24th International Conference of Agricultural Economists, Berlin, 13–18 August 2000, Ashgate, Burlington VT: 376–82.
Van der Eng, Pierre (1996), Agricultural Growth in Indonesia: Productivity Change and Policy
Impact since 1880, St Martin’s Press, New York.