© The Author 2014. Published by Oxford University Press on behalf of the American Association for Public Opinion Research. All rights reserved. For permissions, please e-mail: [email protected]
ASSESSING THE MECHANISMS OF MISREPORTING TO
FILTER QUESTIONS IN SURVEYS
Abstract To avoid asking respondents questions that do not apply to them, surveys often use filter questions that determine routing into follow-up items. Filter questions can be asked in an interleafed format, in which follow-up questions are asked immediately after each relevant filter, or in a grouped format, in which follow-up questions are asked only after multiple filters have been administered. Most previous inves-tigations of filter questions have found that the grouped format collects more affirmative answers than the interleafed format. This result has
Stephanie Eckman is a senior researcher at the Institute for Employment Research (IAB) in Nuremberg, Germany. Frauke Kreuter is a professor in the Joint Program in Survey Methodology at the University of Maryland, College Park, MD, USA; head of the Statistical Methods Research Department at the Institute for Employment Research (IAB) in Germany, with affiliation at the Ludwig Maximilian University in Munich; and a professor of statistics and methodology at Mannheim University, Mannheim, Germany. Antje Kirchner is a postdoctoral research associ-ate in the Survey Research and Methodology Program at the University of Nebraska–Lincoln, Lincoln, NE, USA. Annette Jäckle is a senior research fellow at the Institute for Social and Economic Research, University of Essex, Essex, UK. Roger Tourangeau is a vice president at Westat in Rockville, MD, USA. Stanley Presser is a Distinguished University Professor in the Sociology Department and the Joint Program in Survey Methodology at the University of Maryland, College Park, MD, USA. The authors are grateful to Yuliya Kosyakova, Barbara Felderer, Ulrich Thomsen, Ruben Bach, and Svenja Wippich for their assistance in the design and analysis of the study. Hal Stern provided helpful comments on an earlier draft. The work reported here is supported by the National Science Foundation (NSF) [SES 0850999 to F.K. and 0850445 to R.T.]. The authors would like to thank the NSF’s Methodology, Measurement, and Statistics Program and Dr. Cheryl Eavey for their support. Any opinions, findings, conclusions, or recommendations expressed in this article are those of the authors and do not necessarily reflect the views of the National Science Foundation. Data collection was also supported by the Institute for Employment Research (IAB). *Address correspondence to Stephanie Eckman, Institute for Employment Research, Weddigenstraße 20–22, Nuremberg, Germany 90478; telephone: +49 911 179 3165; e-mail: [email protected].
doi:10.1093/poq/nfu030 Advance Access publication October 4, 2014
at Jordan University of Science and Technology on July 26, 2016
http://poq.oxfordjournals.org/
been taken to mean that respondents in the interleafed format learn to shorten the questionnaire by answering the filter questions negatively. However, this is only one mechanism that could produce the observed differences between the two formats. Acquiescence, the tendency to answer yes to yes/no questions, could also explain the results. We con-ducted a telephone survey that linked filter question responses to high-quality administrative data to test two hypotheses about the mechanism of the format effect. We find strong support for motivated underreport-ing and less support for the acquiescence hypothesis. This is the first clear evidence that the grouped format results in more accurate answers to filter questions. However, we also find that the underreporting phe-nomenon does not always occur. These findings are relevant to all sur-veys that use multiple filter questions.
Introduction
Filter questions are commonly used in surveys to determine respondent eligi-bility for follow-up questions. For example, a filter question might ask whether a respondent is currently employed, so that only those who report employment receive questions about pay, hours, and commuting. Filter questions generally reduce the overall burden of the questionnaire by routing respondents around questions that do not apply to them. When surveys ask many filter questions, the way in which filter questions are structured affects the responses. Two formats are common. In the interleafed format, the follow-up questions come immediately after the relevant filter question. In the grouped format, the filter questions are asked in a block, and the triggered follow-ups are asked later. The proportion of respondents giving answers that trigger follow-up ques-tions is typically lower when filter quesques-tions are interleafed with the follow-up
questions than when filters are grouped (Kessler et al. 1998; Duan et al. 2007;
Kreuter et al. 2011).
Kreuter et al. (2011, fig. 3) showed that this format effect emerges only after the first few filters: the two formats produce the same number of triggering responses for early filter questions. This finding suggests that respondents’ behavior changes as they learn how a questionnaire is structured. In this paper, we test two response mechanisms that could account for this result. One mech-anism involves respondent attempts to reduce the burden of the interview. The other involves respondent acquiescence.
Respondents’ desire to reduce survey burden is the explanation usually offered for the finding that the interleafed format produces fewer answers triggering follow-up questions. Respondents in the interleafed condition, who initially answer the filter questions accurately, may become bored or find the interview getting too long. With later filter items, respondents may select the response option that does not trigger the follow-up questions in order to
at Jordan University of Science and Technology on July 26, 2016
http://poq.oxfordjournals.org/
shorten the interview. Respondents in the grouped format would not learn about the consequences of their responses and would thus continue to answer the filter questions accurately. We refer to this explanation for the filter format
phenomenon as the burden hypothesis.
An alternative explanation involves acquiescence, a tendency to say yes to yes/
no questions (Krosnick and Presser 2010). In the grouped format, acquiescence to
the filter questions at first appears costless: respondents do not realize that agreeing triggers follow-up questions until all filters have been answered. In the interleafed format, respondents become aware of the consequences of acquiescence after the first yes response, as they are confronted with follow-up questions that may be difficult to answer. As a result, respondents may stop acquiescing and answer later filter questions more accurately. In this way, acquiescence can produce lower trig-gering rates to the later filter questions in the interleafed format. We call this
expla-nation, proposed by Kreuter et al. (2011), the acquiescence hypothesis.
Both of these hypothesized mechanisms are consistent with the findings that the grouped format produces more triggering responses than the interleafed format, and that the difference between the formats grows as respondents answer more filter questions. However, the two mechanisms have different implications for data quality. According to the burden hypothesis, the grouped format should produce more accurate responses to the filter questions, while the acquiescence hypothesis predicts more accurate reporting in the inter-leafed format. Using a survey that contains a link to administrative data, we can explore which format collects more accurate responses to the filter ques-tions and thus determine which mechanism is at work.
A Survey Experiment
We conducted a telephone survey in Germany from August to October 2011. The questionnaire experimentally manipulated the filter format. Because the sample was drawn from administrative records, it was possible to validate answers to some of the filter questions.
QUESTIONNAIRE
Each responding case received filter questions in one of two formats: grouped or interleafed. In the grouped format, 18 filter questions were asked in a single block, followed by the applicable follow-up items. In the interleafed format, the follow-up questions came immediately after each filter question, if they were triggered. Every respondent was randomly assigned to one format and was asked filter questions in that format only.
The filter questions were grouped into three topical sections. One section asked respondents about clothing purchases and was based on questions asked
in the US Consumer Expenditure Survey (Bosley, Dashen, and Fox 1999);
another section asked about employment history; and the third asked about
at Jordan University of Science and Technology on July 26, 2016
http://poq.oxfordjournals.org/
income sources such as unemployment insurance, income support, rental income, and interest income. A yes response to any filter item triggered four follow-up questions. Within a section, all the filter questions triggered the same follow-up questions. The order of the three sections was randomized, and the six filter questions within each of the sections were randomly asked in forward or backward order. To minimize the chances that respondents would think they were filter questions, yes/no questions were not used as follow-up questions.
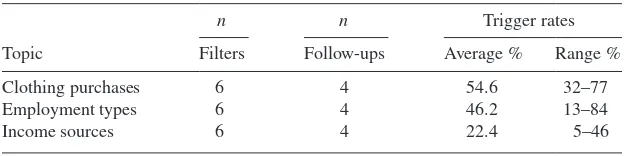
Table 1 summarizes the most important characteristics of the three fil-ter sections. The appendix gives the text of all 18 filfil-ter questions and the follow-up items.
SAMPLE
A sample of adults was drawn from German federal databases (IAB 2011), in
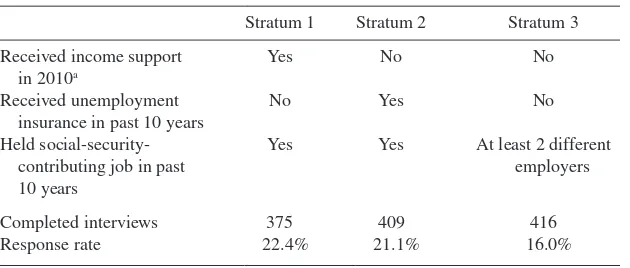
three nonoverlapping strata. The first stratum contained persons who received income support in 2010 and held a social-security-contributing job in the past 10 years. The second consisted of persons who received unemployment insur-ance in the past 10 years, held a social-security-contributing job in the past 10 years, and never received income support. The third stratum consisted of persons who received neither income support nor unemployment insurance and held social-security-contributing jobs with two or more different employ-ers in the past 10 years. Within each stratum, the sample was equal probability. Table 2 summarizes the design. The stratification was intended to ensure that most respondents could truthfully answer yes to many of the filter questions asked in our survey.
In total, 1,200 interviews were completed, yielding a response rate of 19.4
percent (AAPOR RR1).1 The sample size was based on cost considerations and
the power of our tests to detect effects of similar magnitude to those in Kreuter
Table 1. Filter Question Sections
n n Trigger rates
Topic Filters Follow-ups Average % Range %
Clothing purchases 6 4 54.6 32–77
Employment types 6 4 46.2 13–84
Income sources 6 4 22.4 5–46
Note.—The order of administration of the sections was randomized. The order of filters within sections was randomly forward or backward.
1. An additional 1,200 respondents completed the survey but were assigned to experimental con-ditions not used in this paper. The gross sample size was 12,400. The reported response rate is for the entire sample (yielding 2,400 interviews). See Sakshaug, Tutz, and Kreuter (2013) for an analysis of some of the other experiments conducted in this survey.
at Jordan University of Science and Technology on July 26, 2016
http://poq.oxfordjournals.org/
et al. (2011). There were no significant differences in the response rates or breakoff rates across the filter question conditions. Response rates did differ
by stratum (see table 2): as observed in other studies with similar populations,
those who receive support from the federal government have a higher
propen-sity to respond to survey requests (Kreuter, Müller, and Trappmann 2010). The
advance letter and contact protocol told respondents that the survey was about “Employment and Purchase Behavior in Germany” and did not mention the experimental design of the study. Interviewers, however, administered filter questions in both formats and thus were aware of the manipulations.
ADMINISTRATIVE DATA
For respondents who consented, we were able to link their answers to the
employment filter questions with their administrative data (IAB 2013) using a
unique identifier. Overall, 95.2 percent of the respondents (1,142) consented to the link, a rate that did not vary by condition or stratum. Because respond-ents were sampled from the administrative database, there should be no link-ing errors. There were, however, seven cases that consented to the link but had no employment spells in the records. We are unable to explain this, but it should not bias our results.
The administrative records that correspond to the filter questions asked in the employment section are part of the database of social security
contribu-tions made each year by employers in Germany (IAB 2013). All contributing
jobs should be captured in the database. Non-contributing positions, such as civil servant, police officer, professor, and the self-employed, are not covered (Jacobebbinghaus and Seth 2007). Due to these exclusions, we anticipated some mismatch between the responses and the data, but this error should be similar across the two filter formats due to the random assignment of respond-ents to conditions.
Table 2. Sample Design
Stratum 1 Stratum 2 Stratum 3
Received income support
Yes Yes At least 2 different employers
Completed interviews 375 409 416
Response rate 22.4% 21.1% 16.0%
aDue to disability, long-term unemployment, or employment that does not reach a minimum standard of living.
at Jordan University of Science and Technology on July 26, 2016
http://poq.oxfordjournals.org/
Methods
The linked survey and administrative data allowed us to explore the accuracy of respondents’ answers and thus distinguish between the burden and acqui-escence mechanisms. According to the burden hypothesis, the format effect is due to underreporting to the later filter questions in the interleafed format. Respondents in the interleafed format learn to underreport to avoid additional questions, and those in the grouped format do not. Accuracy should thus be higher in the grouped format. According to the acquiescence hypothesis, the format effect is due to overreporting to the early filter questions (inappropriate yes responses) in the interleafed format. Respondents in the interleafed format learn not to acquiesce and thus not to overreport, and those in the grouped format do not. Accuracy should therefore be higher in the interleafed format. From the administrative data about employment available for nearly every respondent, we calculated the percentage of filters in the employment section that were answered correctly, the percentage answered no when yes was the correct answer (false negative), and the percentage answered yes when no was the correct answer (false positive).
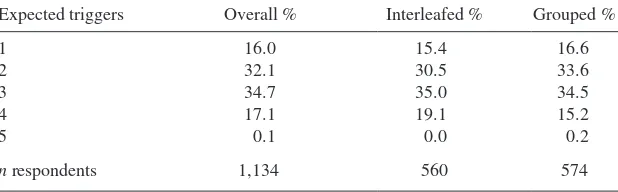
Using the administrative data, we assigned each respondent a score for how many times she should have reported yes in the employment section. For 1,134 respondents, we can validate responses for five of the six job types asked about in the employment section (as noted above, self-employment is a noncontrib-uting position, and therefore cannot be validated). The number of expected yes
responses varies from one to five (see table 3). Some of our analyses are run
separately for respondents with low and high scores. In line with the random assignment of respondents to format, the distribution of the number of these
expected responses does not differ by filter format (χ2 (4) = 4.668; p = 0.322).
Due to the experimental design, we do not need to control for confounders in the analyses and thus complex statistical techniques are not necessary. All analyses are unweighted, as our goal is not to make inference to the population in these strata, but to compare the grouped and interleafed administration of the filter questions. The analysis of filter question accuracy is conducted at the filter question level, which inflates the sample size. To ensure that our standard errors
Table 3. Number of Expected Triggers in Employment Section (column percents)
Expected triggers Overall % Interleafed % Grouped %
1 16.0 15.4 16.6
2 32.1 30.5 33.6
3 34.7 35.0 34.5
4 17.1 19.1 15.2
5 0.1 0.0 0.2
n respondents 1,134 560 574
at Jordan University of Science and Technology on July 26, 2016
http://poq.oxfordjournals.org/
take this into account, we control for clustering within respondents. That is, because answers to the questions are somewhat correlated (e.g., those who had a part-time job are more likely to have had a full-time job), we adjust the standard errors, using the Taylor series linearization method of variance estimation.
Results
We first examine whether the grouped format produced more triggering reports than the interleafed format. We then examine filter question accuracy to distinguish between the two mechanisms.
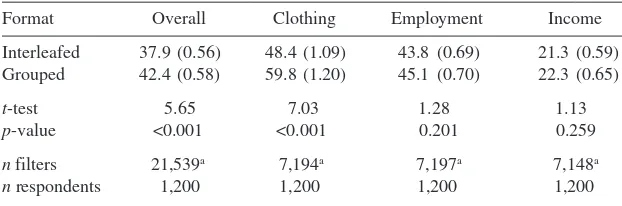
Pooling the three filter sections (clothing, employment, and income), we see the expected effect: respondents in the interleafed format gave triggering answers to the filter questions 37.9 percent of the time versus 42.4 percent of
the time in the grouped format (t = 5.65; see column 1 of table 4). However,
when we separate the results by section, the effect is significant only in the clothing section. The ten-percentage-point difference between the two
for-mats in the clothing section is similar in size to the format effect that Kreuter
et al. (2011) found with similar questions in a US telephone survey. In the employment and income sections, the grouped format produces slightly more triggering reports, but the difference is not significant. Because the order of the sections was randomized, the result reflects a topic and not an order
effect.2
There are several possible explanations for the lack of a format effect in the employment and income sections. It could be that the clothing section was more tedious and/or more difficult than the other sections: both could increase
Table 4. Percent of Filter Questions Triggered, by Filter Format and Section (standard errors in parentheses)
Format Overall Clothing Employment Income
Interleafed 37.9 (0.56) 48.4 (1.09) 43.8 (0.69) 21.3 (0.59) Grouped 42.4 (0.58) 59.8 (1.20) 45.1 (0.70) 22.3 (0.65)
t-test 5.65 7.03 1.28 1.13
p-value <0.001 <0.001 0.201 0.259
n filters 21,539a 7,194a 7,197a 7,148a
n respondents 1,200 1,200 1,200 1,200
aWhile there should be 7,200 filters in each section, some respondents answered “don’t know” or refused the filter questions, and these responses are excluded.
2. We also checked for an effect of the placement of the section within the questionnaire, and found no evidence that sections administered later, in either format, received fewer triggering responses. Kreuter et al. (2011) also found no across-section effects on triggering rates.
at Jordan University of Science and Technology on July 26, 2016
http://poq.oxfordjournals.org/
the likelihood of underreporting to reduce burden and increase the likelihood of acquiescence. Another possible explanation is based on the lower average triggering rates in the employment and income sections. In sections with low trigger rates, respondents in the interleafed format have less opportunity to learn how the filter and follow-up questions worked. The average trigger rate in the employment section was eight percentage points lower than in the
cloth-ing section, and the average rate in the income section was lower still (table 1).
However, we note that Kreuter et al. (2011) found a format effect in filter
sec-tions with even lower triggering rates than in the employment section here. We cannot fully test these competing explanations for the lack of a format effect in the employment and income sections, because our survey was not designed to do so. However, using the linked administrative data, we can test whether respondents who should have said yes more often in the employment
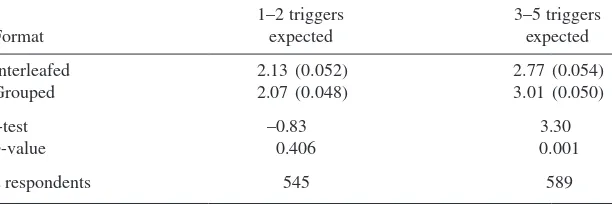
section do demonstrate the format effect. Table 5 shows the average number
of triggers per respondent across the five job types we could validate in the employment section. The respondents are split into two nearly equal-sized groups: those who held one or two of the five job types we can validate (col-umn 1) and those who had three or more (col(col-umn 2). We see that respondents with more job types did in fact say yes to the filter questions more often. In addition, among those respondents who were expected to trigger three or more times, the grouped format produced more triggering responses than the
inter-leafed format (t = 3.30). Thus, we find the expected format effect among this
subset of respondents.
We next explore the accuracy—among all respondents—of the reports to the five employment filter questions that we can validate. Recall that the burden hypothesis predicts greater accuracy in the grouped format and more false negative responses in the interleafed format. The acquiescence hypoth-esis predicts more accuracy in the interleafed format and more false positive
responses in the grouped format. In the first three columns of table 6, we see
that there is incorrect reporting in both formats. Overall, almost 80 percent of
Table 5. Average Number of Triggered Filters in Employment Section, by Filter Format and Expected Number of Triggers (standard errors in parentheses)
at Jordan University of Science and Technology on July 26, 2016
http://poq.oxfordjournals.org/
Table 6. Correct and Incorrect Reporting to Five Filter Questions in the Employment Section (standard errors in parentheses)
All linked respondents Respondents with 3–5 triggers expected
Format Pct. correct
Pct. false negative
Pct. false
positive Pct. correct
Pct. false negative
Pct. false positive
Interleafed 75.8 (0.85) 13.2 (0.66) 11.1 (0.56) 74.6 (1.21) 18.6 (0.97) 6.9 (0.58)
Grouped 79.4 (0.79) 9.8 (0.55) 10.8 (0.53) 79.4 (1.12) 13.3 (0.86) 7.3 (0.60)
t-test 3.08 –3.91 –0.30 –2.90 –4.04 0.58
p-value 0.002 < 0.001 0.764 0.004 < 0.001 0.561
n filters 4,397 649 621 2,264 471 209
n respondents 1,134 505 532 589 343 202
ilter Questions
729
the responses to the five filter questions were accurate, about 10 percent were underreports, and about 10 percent were overreports. However, there are sig-nificantly more accurate reports in the grouped format and sigsig-nificantly more false negatives in the interleafed format. False positives do not vary by format. Restricting this analysis to those respondents expected to trigger three or more
times makes the results stronger (see the last three columns of table 6).
These results strongly favor the burden hypothesis over the acquiescence hypothesis: the grouped format collects more accurate data than the inter-leafed format, and respondents in the interinter-leafed format underreport.
Discussion and Conclusion
This study, with an experimental manipulation of the filter format and a link to high-quality administrative data, has led to two related findings. First, the format effect is due more to respondents’ desire to minimize interview bur-den than to acquiescence. Second, the grouped format produces more accurate responses to filter questions. Previous studies have argued in favor of these conclusions, but ours is the first to provide direct evidence for them. The study has also shown that the format effect observed in earlier research does not always occur. Whether it appears or not may be related to the baseline trigger rate or to how tedious or difficult the questions are. Our data do not allow us to test these hypotheses.
Our results provide support for the use of the grouped format over the interleafed format. However, the grouped format may be awkward for respondents. They must first answer a series of yes/no questions and then later return to some of those topics to answer the follow-up items. Recall may be easier, and measurement error in the follow-up questions lower, when respondents can stick to one topic at a time, as the interleafed for-mat permits. Due to the potential benefits of the interleafed forfor-mat, future research should search for ways to improve the interleafed format and mini-mize underreporting.
Appendix: Wording of Filter and Follow-Up Questions
CLOTHING SECTION FILTERS
1.1 This year, that is in 2011, have you bought a coat or jacket for yourself or for someone else?
1.2 This year, that is in 2011, have you bought a shirt or a blouse for your-self or for someone else?
1.3 This year, that is in 2011, have you bought trousers for yourself or for someone else?
at Jordan University of Science and Technology on July 26, 2016
http://poq.oxfordjournals.org/
1.4 This year, that is in 2011, have you bought shoes for yourself or for someone else?
1.5 This year, that is in 2011, have you bought sportswear for yourself or for someone else?
1.6 This year, that is in 2011, have you bought swimwear for yourself or for someone else?
CLOTHING SECTION FOLLOW-UPS
1.1.1 For whom did you purchase this coat or jacket? For yourself, a family member, or someone else?
1.1.2 In what month did you purchase this coat or jacket? 1.1.3 How much did this coat or jacket cost?
1.1.4 How satisfied are you with this coat or jacket? Are you very satisfied, somewhat satisfied, somewhat dissatisfied, or very dissatisfied?
EMPLOYMENT SECTION FILTERS
2.1 Have you ever held a full-time job? (Note: We explicitly instructed respondents not to include self-employment.)
2.2 Have you ever held a part-time job? (Note: We explicitly instructed respondents not to include self-employment or Mini-Jobs.)
2.3 Have you ever held a so-called Mini-Job, with a payment of 400 Euros a month or less?
2.4 Have you ever received professional training? 2.5 Have you ever received paid practical training? 2.6 Have you ever been self-employed?
EMPLOYMENT SECTION FOLLOW-UPS
2.1.1 From when and until when did you hold your most recent full-time
job?3
2.1.2 How many hours per week did/do you work in your most recent full-time job?
2.1.3 In what industry was/is your most recent full-time job?
2.1.4 What was your last monthly income at your most recent full-time job?
INCOME SECTION FILTERS
3.1 In the year 2010: Did you or another person in your household have income from interest or investment income, e.g., savings, shares, equity funds, or fixed-interest securities?
3. Several of the follow-ups in this section contained additional wording experiments. We show only one form here.
at Jordan University of Science and Technology on July 26, 2016
http://poq.oxfordjournals.org/
3.2 In the year 2010: Did you or another person in your household have income from rental property, including leases and subleases?
3.3 In the year 2010: Did you or another person in your household receive a child benefit?
3.4 In the year 2010: Did you or another person in your household receive parental money or a maternity benefit?
3.5 In the year 2010: Did you or another person in your household receive
income support?4
3.6 In the year 2010: Did you or another person in your household receive unemployment insurance?
INCOME SECTION FOLLOW-UPS
3.1.1 Which person in your household has received income from inter-est or invinter-estment income? You yourself or another member of your household?
3.1.2 How often (with what regularity) did your household receive income from interest or investment income?
3.1.3 How large was the last amount of income from interest or investment income that your household received in 2010?
3.1.4 In what month in 2010 did your household first receive income from interest or investment income?
References
Bosley, John, Monica Dashen, and Jean Fox. 1999. “When Should We Ask Follow-Up Questions about Items in Lists?” Proceedings of the Survey Research Methods Section of the American Statistical Association, 749–54.
Duan, Naihua, Margarita Alegria, Glorisa Canino, Thomas G. McGuire, and David Takeuchi. 2007. “Survey Conditioning in Self-Reported Mental Health Service Use: Randomized Comparison of Alternative Instrument Formats.” Health Service Research 42:890–907. IAB (Institut für Arbeitsmarkt- und Berufsforschung). 2011. Nuremberg: Integrierte
Erwerbsbiographien (IEB) V09.00.
———. 2013. Nuremberg: Beschäftigtenhistorik (BeH), Version 09.03.00.
Jacobebbinghaus, Peter, and Stefan Seth. 2007. “The German Integrated Employment Biographies Sample IEBS.” Schmollers Jahrbuch. Zeitschrift für Wirtschafts- und Sozialwissenschaften 127:335–42.
Kessler, Ronald C., Hans-Ulrich Wittchen, Jamie M. Abelson, Katherine McGonagle, Norbert Schwarz, Kenneth S. Kendler, Bärbel Knäuper, and Shanyang Zhao. 1998. “Methodological Studies of the Composite International Diagnostic Interview (CIDI) in the US National Comorbidity Survey (NCS).” International Journal of Methods in Psychiatric Research 7:33–55.
Kreuter, Frauke, Susan McCulloch, Stanley Presser, and Roger Tourangeau. 2011. “The Effects of Asking Filter Questions in Interleafed versus Grouped Format.” Sociological Methods and Research 40:80–104.
4. Income support refers to funds for those with disabilities, the long-term unemployed, and those whose income does not reach a minimum standard of living.
at Jordan University of Science and Technology on July 26, 2016
http://poq.oxfordjournals.org/
Kreuter, Frauke, Gerrit Müller, and Mark Trappmann. 2010. “Nonresponse and Measurement Error in Employment Research: Making Use of Administrative Data.” Public Opinion Quarterly 74:880–906.
Krosnick, Jon A., and Stanley Presser. 2010. “Questionnaire Design.” In Handbook of Survey Research, edited by Peter V. Marsden and James D. Wright, 263–313. 2nd ed. West Yorkshire, England: Emerald Group.
Sakshaug, Joseph, Valerie Tutz, and Frauke Kreuter. 2013. “Placement, Wording, and Interviewers: Identifying Correlates of Consent to Link Survey and Administrative Data.” Survey Research Methods 7(2):133–144.
at Jordan University of Science and Technology on July 26, 2016
http://poq.oxfordjournals.org/