Refer to Important disclosures in the last page of this report
Stock DataTarget price (Rp) Rp8,650
Prior TP (Rp) Rp8,900
Share price (Rp) Rp7,200
Upside/downside (%) +20.1
Shares outstanding (m) 18,649
Market cap. (US$ m) 8,836
Republic of Indonesia 60.0%
Estimate Change; Vs. Consensus 2018F 2019F PT Indo Premier Sekuritas
[email protected] +62 21 5793 1168
Slowing growth due to lower NIMs
9M18 net profit grew 12.6% driven by strong asset growth.
However, core profit fell in 3Q due to NIM pressure, cost growth.
Credit cost has normalised, thus unlikely to be key earnings driver.
Reiterate Buy albeit with lower TP of Rp8,650 (from Rp8,900).
Decent results.
BBNI reported profit of Rp11.4tn in 9M18 (+12.6%), in-line with
our FY18F forecast (Rp15.1tn) and consensus estimate (Rp15.4tn). The bank’s
modest earnings growth was driven by its strong asset growth (loans: +15.6%;
deposits: +14.2%), which was well above industry growth, although its operating
cost growth has also accelerated (+12% yoy) while loan provisioning was stable
(-2.7% yoy). Quarterly profit grew by 5.6% qoq in 3Q but this was largely due to
one-off recovery income of Rp400bn from asset sales related to BBNI’s 20-year
old legacy NPLs and its lower credit cost of 127bps (2Q: 176bps). Excluding this,
BBNI’s core profit fell by 9% qoq in 3Q due to NIM pressure and strong operating
cost growth.
NIM pressure
. BBNI’s core profit growth slowed to 6.3% in 9M18 due to lower
NIM of 5.43% (-23bps yoy) and challenging financial markets in Indonesia, which
led to the bank’s lower trading incomes. More importantly, we estimate BBNI’s
NIM narrowed to 5.19% in 3Q (2Q: 5.66%; 1Q: 5.44%) due to lower asset yields
and rising cost of funds. BBNI’s loan yields (bank-only) declined to 9.7% in 9M18
(1H18: 9.9%), indicating steeper falls during the third quarter alone. BBNI’s NIM
squeeze in 3Q is our key concern in light of rising rates in Indonesia and the
bank’s lower scope for credit cost improvements in the coming years.
Asset quality
. BBNI’s NPL ratio declined to 2.0% in 3Q (2Q: 2.16%) with the
improvements seen across all loan segments except for middle corporate loans,
which worsened to 3.0% (from 2.7%), while special mention loans also improved
to 150%. In line with this, the bank’s credit cost fell to an unusually low of 127bps
in 3Q (1H: 167bps) while management is guiding for credit cost of 1.4%-1.7% for
2018, with similar credit costs expected for 2019. As such, with the bank’s credit
cost already normalising this year, we expect asset quality improvements will no
longer be a key earnings growth driver for BBNI in the coming years.
Valuation
. We trimmed our earnings forecasts by 1-2% and our TP to Rp8,650
(from Rp8,900) due to our lower equity book value forecast arising from declining
bond prices in Indonesia, which led to unrealised bond revaluation losses in equity
capital of Rp3.9tn for the bank. Our TP is based on GGM-derived FY18F P/B target
of 1.5x, assuming LT ROAE of 14.5%, growth of 8.5%, cost of equity of 12.5%.
We estimate LT ROAE based on our DuPont analysis, assuming LT ROAA of 1.82%
and asset/equity leverage of 8x. Reiterate BUY.
Bank Negara Indon.
(
BBNI IJ
)
19 October 2018
Results Note
BUY
(Unchanged)
Year To 31 Dec 2016A 2017A 2018F 2019F 2020F
Operating income (RpBn) 39,921 43,480 46,663 51,929 58,647
PPOP (RpBn) 20,705 22,617 23,785 27,148 31,322
Source: BBNI, IndoPremier Share Price Closing as of : 18-October-2018
2
Refer to Important disclosures in the last page of this report
Fig. 1: Net Interest Income (Rp bn) and NIMs (%) Fig. 2: Non-Interest Income (Rp bn; % of Gross Income)
Source: Company, IndoPremier Source: Company, IndoPremier
Fig. 3: Operating Expense (Rp bn) and Cost/Income Ratio (%)
Fig. 4: Pre-Provision Profit (Rp bn; % of Average Assets)
Source: Company, IndoPremier Source: Company, IndoPremier
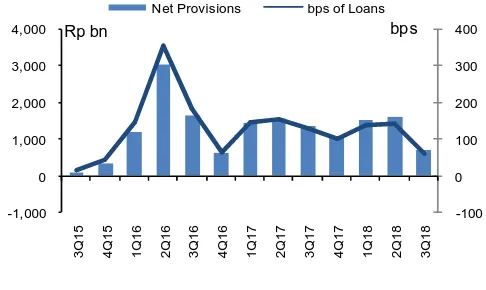
Fig. 5: Net Loan Provisioning (Rp bn; bps of Average Loans) Fig. 6: Net Profit (Rp bn) and ROAA (%)
Source: Company, IndoPremier Source: Company, IndoPremier
2%
Net Interest Income Net Interest Margin
Rp bn
Other Income Other Income % of Total
Rp bn
Operating Expenses Cost-Income Ratio
Rp bn
Pre-Provision Profit Pre-Provision Profit ROAA
Rp bn
Net Provisions bps of Loans
bps
Net Profit Net Profit ROAA
3
Refer to Important disclosures in the last page of this report
Third-Quarter 2018 Results
(Rp Bn) 9M18 9M17 % Y-Y 3Q18 2Q18 % Q-Q
Customer Deposits 548,593 480,532 14.2 548,593 526,482 4.2
Non-Performing Loans (NPL) 9,741 11,701 -16.7 9,741 9,868 -1.3
Special Mention Loans 19,312 15,298 26.2 19,312 19,312 0.0
Loan Loss Reserves (LLR) 14,647 16,777 -12.7 14,647 14,369 1.9
Total Assets 763,524 668,208 14.3 763,524 734,189 4.0
Risk-Weighted Assets 226,062 192,759 17.3 226,062 207,306 9.0
4
Refer to Important disclosures in the last page of this report
Year To 31 Dec (RpBn) 2016A 2017A 2018F 2019F 2020F
Income Statement
Interest income 43,768 48,178 52,807 61,865 73,524
Interest expense (13,773) (16,240) (18,316) (23,204) (29,352)
Net interest income 29,995 31,938 34,491 38,660 44,172
Fees and commissions 6,473 7,314 8,192 9,011 9,912
Trading income 1,288 1,590 1,200 1,200 1,200
Other operating income 2,166 2,638 2,779 3,057 3,363
Total operating income 39,921 43,480 46,663 51,929 58,647
Personnel expenses (8,834) (9,277) (10,019) (10,821) (11,903)
G&A expenses (6,212) (6,923) (7,615) (8,224) (9,046)
Other operating expenses (4,171) (4,664) (5,243) (5,736) (6,375)
Pre-provision operating profit 20,705 22,617 23,785 27,148 31,322
Provisions (7,853) (7,126) (7,038) (7,744) (9,119)
Loan recovery income 1,378 1,732 2,100 1,800 1,600
Operating profit 14,229 17,223 18,847 21,203 23,803
Non-operating profit 74 (57) (125) 0 0
Exceptional items 0 0 0 0 0
Pre-tax profit 14,303 17,165 18,722 21,203 23,803
Income tax (2,893) (3,395) (3,744) (4,241) (4,761)
Minority interests (71) (154) (20) (22) (30)
Reported net profit 11,339 13,616 14,958 16,940 19,012
Balance Sheet
Cash 11,168 11,578 15,103 17,459 20,265
Current account with BI 30,147 32,701 45,098 51,767 59,675
Placements at BI & other banks 39,960 49,929 50,421 50,923 51,435
Short-term investments 33,997 52,430 53,650 54,993 56,470
Government bonds 63,006 79,849 100,268 100,268 100,268
Gross loans 393,275 441,314 515,404 602,297 704,242
Loan provisions (16,681) (14,524) (15,512) (18,156) (22,076)
Other assets 48,160 56,053 60,032 64,327 68,966
Total Assets 603,032 709,330 824,464 923,877 1,039,244
Customer deposits 435,545 516,098 590,665 678,772 783,308
Deposits from other banks 10,224 12,177 13,394 14,734 16,207
Securities and borrowings 43,957 50,595 53,444 56,468 59,678
Other liabilities 24,052 29,558 57,589 47,748 37,040
Total Liabilities 513,778 608,427 715,093 797,722 896,234
Share capital 23,623 23,623 23,623 23,623 23,623
Reserves and others 12,736 14,656 10,633 12,633 12,633
Retained earnings 50,798 60,314 73,115 87,899 104,754
Shareholders' equity 87,157 98,592 107,371 124,155 141,011
Minority interest 2,097 2,311 2,000 2,000 2,000
Total Liabilities & Equity 603,032 709,330 824,464 923,877 1,039,244
5
Refer to Important disclosures in the last page of this report
Year To 31 Dec 2016A 2017A 2018F 2019F 2020F
Growth Ratios (% yoy)
Gross loans 20.6 12.2 16.8 16.9 16.9
Total assets 18.6 17.6 16.2 12.1 12.5
Customer deposits 17.6 18.5 14.4 14.9 15.4
Net interest income 17.4 6.5 8.0 12.1 14.3
Non-interest income 22.4 16.3 5.4 9.0 9.1
Total operating income 24.7 21.0 9.4 12.5 12.3
Operating expense 16.4 8.6 9.7 8.3 10.3
PPOP 20.7 9.2 5.2 14.1 15.4
Net profit 25.1 20.1 9.8 13.3 12.2
Profitability Ratios
ROAA (%) 2.04 2.08 1.95 1.94 1.94
ROAE (%) 13.9 14.9 14.5 14.6 14.3
NIM (%) 6.38 5.63 5.20 5.14 5.19
Credit cost (bps) 183.0 131.0 103.2 106.4 115.1
Cost/income (%) 48.1 48.0 49.0 47.7 46.6
LDR (%) 90.3 85.5 87.3 88.7 89.9
CAR (%) 19.2 18.8 18.0 17.4 16.7
NPL ratio (%) 3.0 2.3 1.9 1.8 2.0
Provisions/NPL (%) 143.3 143.8 159.1 163.1 158.4
Head Office
PT INDO PREMIER SEKURITAS
Wisma GKBI 7/F Suite 718
Jl. Jend. Sudirman No.28
Jakarta 10210 - Indonesia
p +62.21.5793.1168
f +62.21.5793.1167
INVESTMENT RATINGS
BUY : Expected total return of 10% or more within a 12-month period HOLD : Expected total return between -10% and 10% within a 12-month period SELL : Expected total return of -10% or worse within a 12-month period
ANALYSTS CERTIFICATION.
The views expressed in this research report accurately reflect the analyst;s personal views about any and all of the subject securities or issuers; and no part of the research analyst's compensation was, is, or will be, directly or indirectly, related to the specific recommendations or views expressed in the report.
DISCLAIMERS