Refer to Important disclosures in the last page of this report
Stock DataTarget price (Rp) Rp630
Prior TP (Rp) Rp700
Shareprice (Rp) Rp462
Upside/downside (%) +36.4
Sharesoutstanding (m) 4,705
Marketcap. (US$ m) 144
PT Arman Investment Utama 9.9%
PT Persada Capital Investama 7.9%
PT Union Sampoerna 5.5%
Estimate Change; Vs. Consensus 2018 2019 PT Indo Premier Sekuritas [email protected] +62 21 5793 1168
Widening losses, but expect better 4Q
Poor 9M18 result, below expectation.
Industrial land sales of 8ha in 9M18.
To open another two Batiqa hotels owned by investor.
Maintain Buy albeit lower TP of Rp630 (from Rp700).
Another loss in 3Q18, but expect positive 4Q18.
SSIA booked loss of Rp67bn
in 9M18, which came below market expectation vs. 9M17 earnings of Rp1.2tn
solely from Cipali toll road divestment. Operating profit was down to Rp100bn
(-57% yoy), which came below market expectation forming 37%/43% of
our/consensus FY18F estimate. In 3Q18, SSIA booked loss of Rp10bn, which is
much stronger than Rp47bn loss in 2Q18. Furthermore, we expect SSIA to book a
better 4Q18 given seasonality in its hospitality business and its construction
business unit which has better occupancy rate and recognition in 4Q.
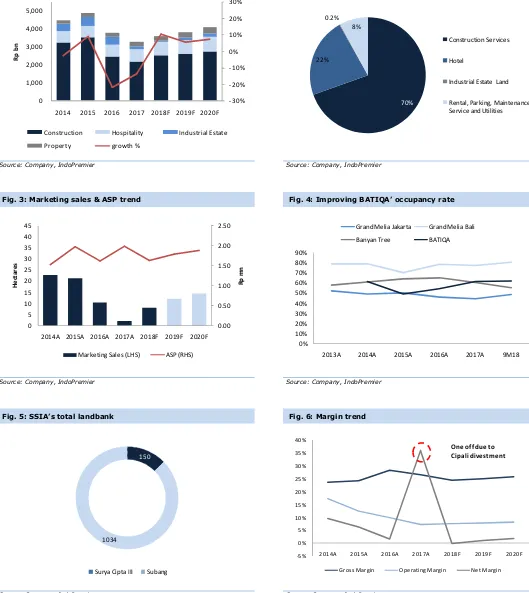
Contribution from industrial estate segment.
As of 9M18, SSIA booked
industrial land sales of 8ha (9M17: 2.1ha) with ASP of US$120 (-18% yoy).
With
this sales, SSIA has fulfilled 80% of our FY18 sales assumption of 10ha. Despite
lower than expected ASP (Ours: US$150), we are positive toward the sales as
industrial land sales is SSIA’s only high margin business (FY17 GPM: 76%). In the
other hand, as of 9M18, SSIA has acquired additional land of 174ha in Subang,
cumulating total land bank of 1,034ha in Subang. SSIA plans to start the ground
breaking for Subang City of Industry in July 2019 after at least acquiring 1,200ha.
Continuous BATIQA expansion.
In August 2018, SSIA has opened a new
Batiqa hotel in Surabaya, making it their 7
thBatiqa hotel chain. Given early
operation of new hotels, Batiqa chain is still booking negative earnings in 9M18.
However, the occupancy rate (OR) in Batiqa hotels has shown an improvement to
61.7 in 9M18 with average room rate (ARR) of Rp332k (9M17: 57% with ARR of
Rp296k). Thus, SSIA is planning to open another two Batiqa which will owned by
investor that will be operated the two Batiqa hotels.
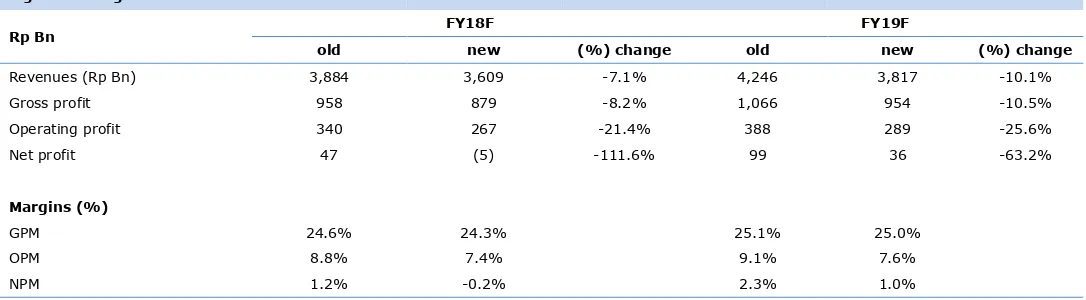
Maintain Buy with lower TP of Rp630.
We expect most of the industrial land
sales in 2018 would only be able to be recognized in 2019. In addition, given
Subang project development delay to 2H19, we reduce our industrial land sales
for FY19F to 12ha (from: 20ha). Thus we forecast SSIA to book a loss of Rp5bn in
FY18F, while reduce our FY19F earnings by 63%. Given lower earnings outlook,
our RNAV calculation has decreased to Rp630/share as we roll over our base
calculation to 2019. SSIA currently trades at 63% to our estimate RNAV estimate
or FY18F P/B of 0.5x, providing cheap valuation for the counter. Upside potential
to our call might come from faster industrial sales recognition and Subang
Source: SSIA, IndoPremier Share Price Closing as of : 01-November-2018
2
Refer to Important disclosures in the last page of this report
Fig. 1: Revenue by segments Fig. 2: 9M18 revenue by segment
Source: Company, IndoPremier Source: Company, IndoPremier
Fig. 3: Marketing sales & ASP trend Fig. 4: Improving BATIQA’ occupancy rate
Source: Company, IndoPremier Source: Company, IndoPremier
Fig. 5: SSIA’s total landbank Fig. 6: Margin trend
Source: Company, IndoPremier Source: Company, IndoPremier
-30%
2014 2015 2016 2017 2018F 2019F 2020F
R
p
b
n
Construction Hospitality Industrial Estate
Property growth %
Industrial Estate Land
Rental, Parking, Maintenance Service and Utilities
2014A 2015A 2016A 2017A 2018F 2019F 2020F
R
Marketing Sales (LHS) ASP (RHS)
0%
2013A 2014A 2015A 2016A 2017A 9M18
Grand Melia Jakarta Grand Melia Bali
Banyan Tree BATIQA
150
1034
Surya Cipta III Subang
-5%
2014A 2015A 2016A 2017A 2018F 2019F 2020F Gross Margin Operating Margin Net Margin
3
Refer to Important disclosures in the last page of this report
Fig. 7: 9M18 result summary
(Rp Bn) 9M18 9M17 % yoy 4Q17 3Q17 % qoq % of Ours % of Consensus
Sales 2,658.5 3,274.2 -18.8% 1,138.4 610.7 86.4% 74% 73.7%
Gross Profit 625.6 863.9 -27.6% 264.3 176.4 49.9% 72% 72.3%
Operating Profit 100.2 234.4 -57.2% 55.4 6.3 774.5% 42% 41.2%
Net Income (65.6) 1,178.4 nm (9.6) (47.2) -79.7% nm nm
GPM (%) 24% 26% 23% 29%
OPM (%) 4% 7% 5% 1%
NPM (%) -2% 36% -1% -8%
Source: Company, IndoPremier
Fig. 8: Earnings Revisions
Rp Bn FY18F FY19F
old new (%) change old new (%) change
Revenues (Rp Bn) 3,884 3,609 -7.1% 4,246 3,817 -10.1%
Gross profit 958 879 -8.2% 1,066 954 -10.5%
Operating profit 340 267 -21.4% 388 289 -25.6%
Net profit 47 (5) -111.6% 99 36 -63.2%
Margins (%)
GPM 24.6% 24.3% 25.1% 25.0%
OPM 8.8% 7.4% 9.1% 7.6%
NPM 1.2% -0.2% 2.3% 1.0%
4
Refer to Important disclosures in the last page of this report
Year To 31 Dec (RpBn) 2016A 2017A 2018F 2019F 2020F
Income Statement
Net Revenue 3,797 3,274 3,609 3,817 4,095
Cost of Sales (2,728) (2,410) (2,731) (2,862) (3,043)
Gross Profit 1,069 864 879 954 1,051
SG&A Expenses (636) (629) (623) (683) (750)
Operating Profit 433 234 256 271 301
Net Interest (181) (243) (157) (121) (110)
Forex Gain (Loss) (5) 1 1 1 1
Others-Net (50) 1,790 36 42 50
Pre-Tax Income 197 1,782 135 193 243
Income Tax (103) (84) (100) (108) (120)
Minorities (38) (63) (41) (49) (47)
Net Income 62 1,178 (5) 36 76
Balance Sheet
Cash & Equivalent 1,520 1,145 1,040 753 919
Receivable 1,193 3,364 1,241 1,346 1,445
Inventory 392 415 457 479 509
Other Current Assets 276 161 160 166 177
Total Current Assets 3,381 5,085 2,897 2,744 3,049
Fixed Assets - Net 2,394 3,315 4,141 4,406 4,489
Goodwill 0 0 0 0 0
Non Current Assets 103 37 57 62 59
Total Assets 7,195 8,851 7,512 7,641 8,017
ST Loans 0 550 250 250 250
Payable 538 456 0 527 548
Other Payables 606 1,408 911 1,030 1,215
Current Portion of LT Loans 752 226 0 0 889
Total Current Liab. 1,896 2,640 1,616 1,807 2,902
Long Term Loans 1,704 1,494 1,305 1,115 226
Other LT Liab. 242 240 267 327 393
Total Liabilities 3,843 4,375 3,188 3,249 3,521
Equity 994 985 985 986 986
Retained Earnings 1,918 3,023 2,841 2,879 2,949
Minority Interest 441 468 497 528 561
Total SHE + Minority Int. 3,353 4,477 4,324 4,393 4,497
Total Liabilities & Equity 7,195 8,851 7,512 7,641 8,017
5
Refer to Important disclosures in the last page of this report
Year to 31 Dec 2016A 2017A 2018F 2019F 2020F
Cash Flow
Net Income (Excl.Extraordinary&Min.Int) 101 1,241 35 85 123
Depr. & Amortization 137 159 174 184 193
Changes in Working Capital 203 (2,070) 2,014 (50) (107)
Others 138 166 221 (2) 277
Cash Flow From Operating 571 (47) 2,445 218 486
Capital Expenditure (430) (1,013) (1,021) (455) (272)
Others 60 865 0 0 0
Cash Flow From Investing (370) (148) (1,021) (455) (272)
Loans 1,079 (186) (716) (190) 0
Equity 3 0 0 0 0
Dividends (45) (51) (177) 1 (5)
Others (148) (251) (140) (81) (69)
Cash Flow From Financing 889 (488) (1,032) (269) (74)
Changes in Cash 1,091 (684) 392 (506) 140
Financial Ratios
Gross Margin (%) 28.2 26.4 24.3 25.0 25.7
Operating Margin (%) 11.4 7.2 7.1 7.1 7.4
Pre-Tax Margin (%) 5.2 54.4 3.7 5.1 5.9
Net Margin (%) 1.6 36.0 (0.2) 1.0 1.9
ROA (%) 0.9 14.7 (0.1) 0.5 1.0
ROE (%) 1.9 30.1 (0.1) 0.8 1.7
ROIC (%) 1.3 19.3 (0.1) 0.7 1.3
Acct. Receivables TO (days) 33.9 33.7 34.0 34.7 34.5
Acct. Receivables - Other TO (days) 78.8 220.4 198.8 89.0 89.9
Inventory TO (days) 6.3 6.0 6.3 6.1 6.2
Payable TO (days) 63.9 75.3 60.8 62.6 64.5
Acct. Payables - Other TO (days) 0.1 2.9 2.5 0.1 0.1
Debt to Equity (%) 73.3 50.7 36.0 31.1 30.4
Interest Coverage Ratio (x) 0.4 1.0 0.6 0.4 0.4
Net Gearing (%) 27.9 25.1 11.9 13.9 9.9
Head Office
PT INDO PREMIER SEKURITAS
Wisma GKBI 7/F Suite 718
Jl. Jend. Sudirman No.28
Jakarta 10210 - Indonesia
p +62.21.5793.1168
f +62.21.5793.1167
INVESTMENT RATINGS
BUY : Expected total return of 10% or more within a 12-month period HOLD : Expected total return between -10% and 10% within a 12-month period SELL : Expected total return of -10% or worse within a 12-month period
ANALYSTS CERTIFICATION.
The views expressed in this research report accurately reflect the analysts personal views about any and all of the subject securities or issuers; and no part of the research analyst's compensation was, is, or will be, directly or indirectly, related to the specific recommendations or views expressed in the report.
DISCLAIMERS